RTD sensors are renowned for their precise and accurate temperature measurement, particularly within narrow temperature ranges. Their resistance exhibits a highly sensitive response to temperature fluctuations, enabling the detection of even minute changes. This precision makes them invaluable for applications demanding exacting temperature control. If you’d like to learn more about Resistance Temperature Detector Sensors, I recommend reading this article:
The Industrial IoT Wireless RTD Temperature Sensor
The NCD Industrial IoT Long Range Wireless RTD Temperature Sensor Transmitter excels at measuring extremely high and low temperatures with exceptional precision. This IoT device accommodates any standard 100 Ohm 3-Wire RTD sensor. To enhance accuracy, it incorporates an onboard RTD signal amplifier. Ideal for demanding industrial environments, this wireless transmitter monitors temperatures in applications such as industrial boilers, liquid storage, and food preservation.
If you plan to purchase a temperature sensor and are unsure about the best option for your application, I recommend reading the following articles. They cover essential details about these IIoT temperature sensors:
This article aims to introduce the main features of the NCD-Dashboard and provide instructions on how to set up (Import, Configuration, and Connection) within your Node-RED instance. This solution serves as a visual tool to help you start working with the sensor in an easy way.
Overview
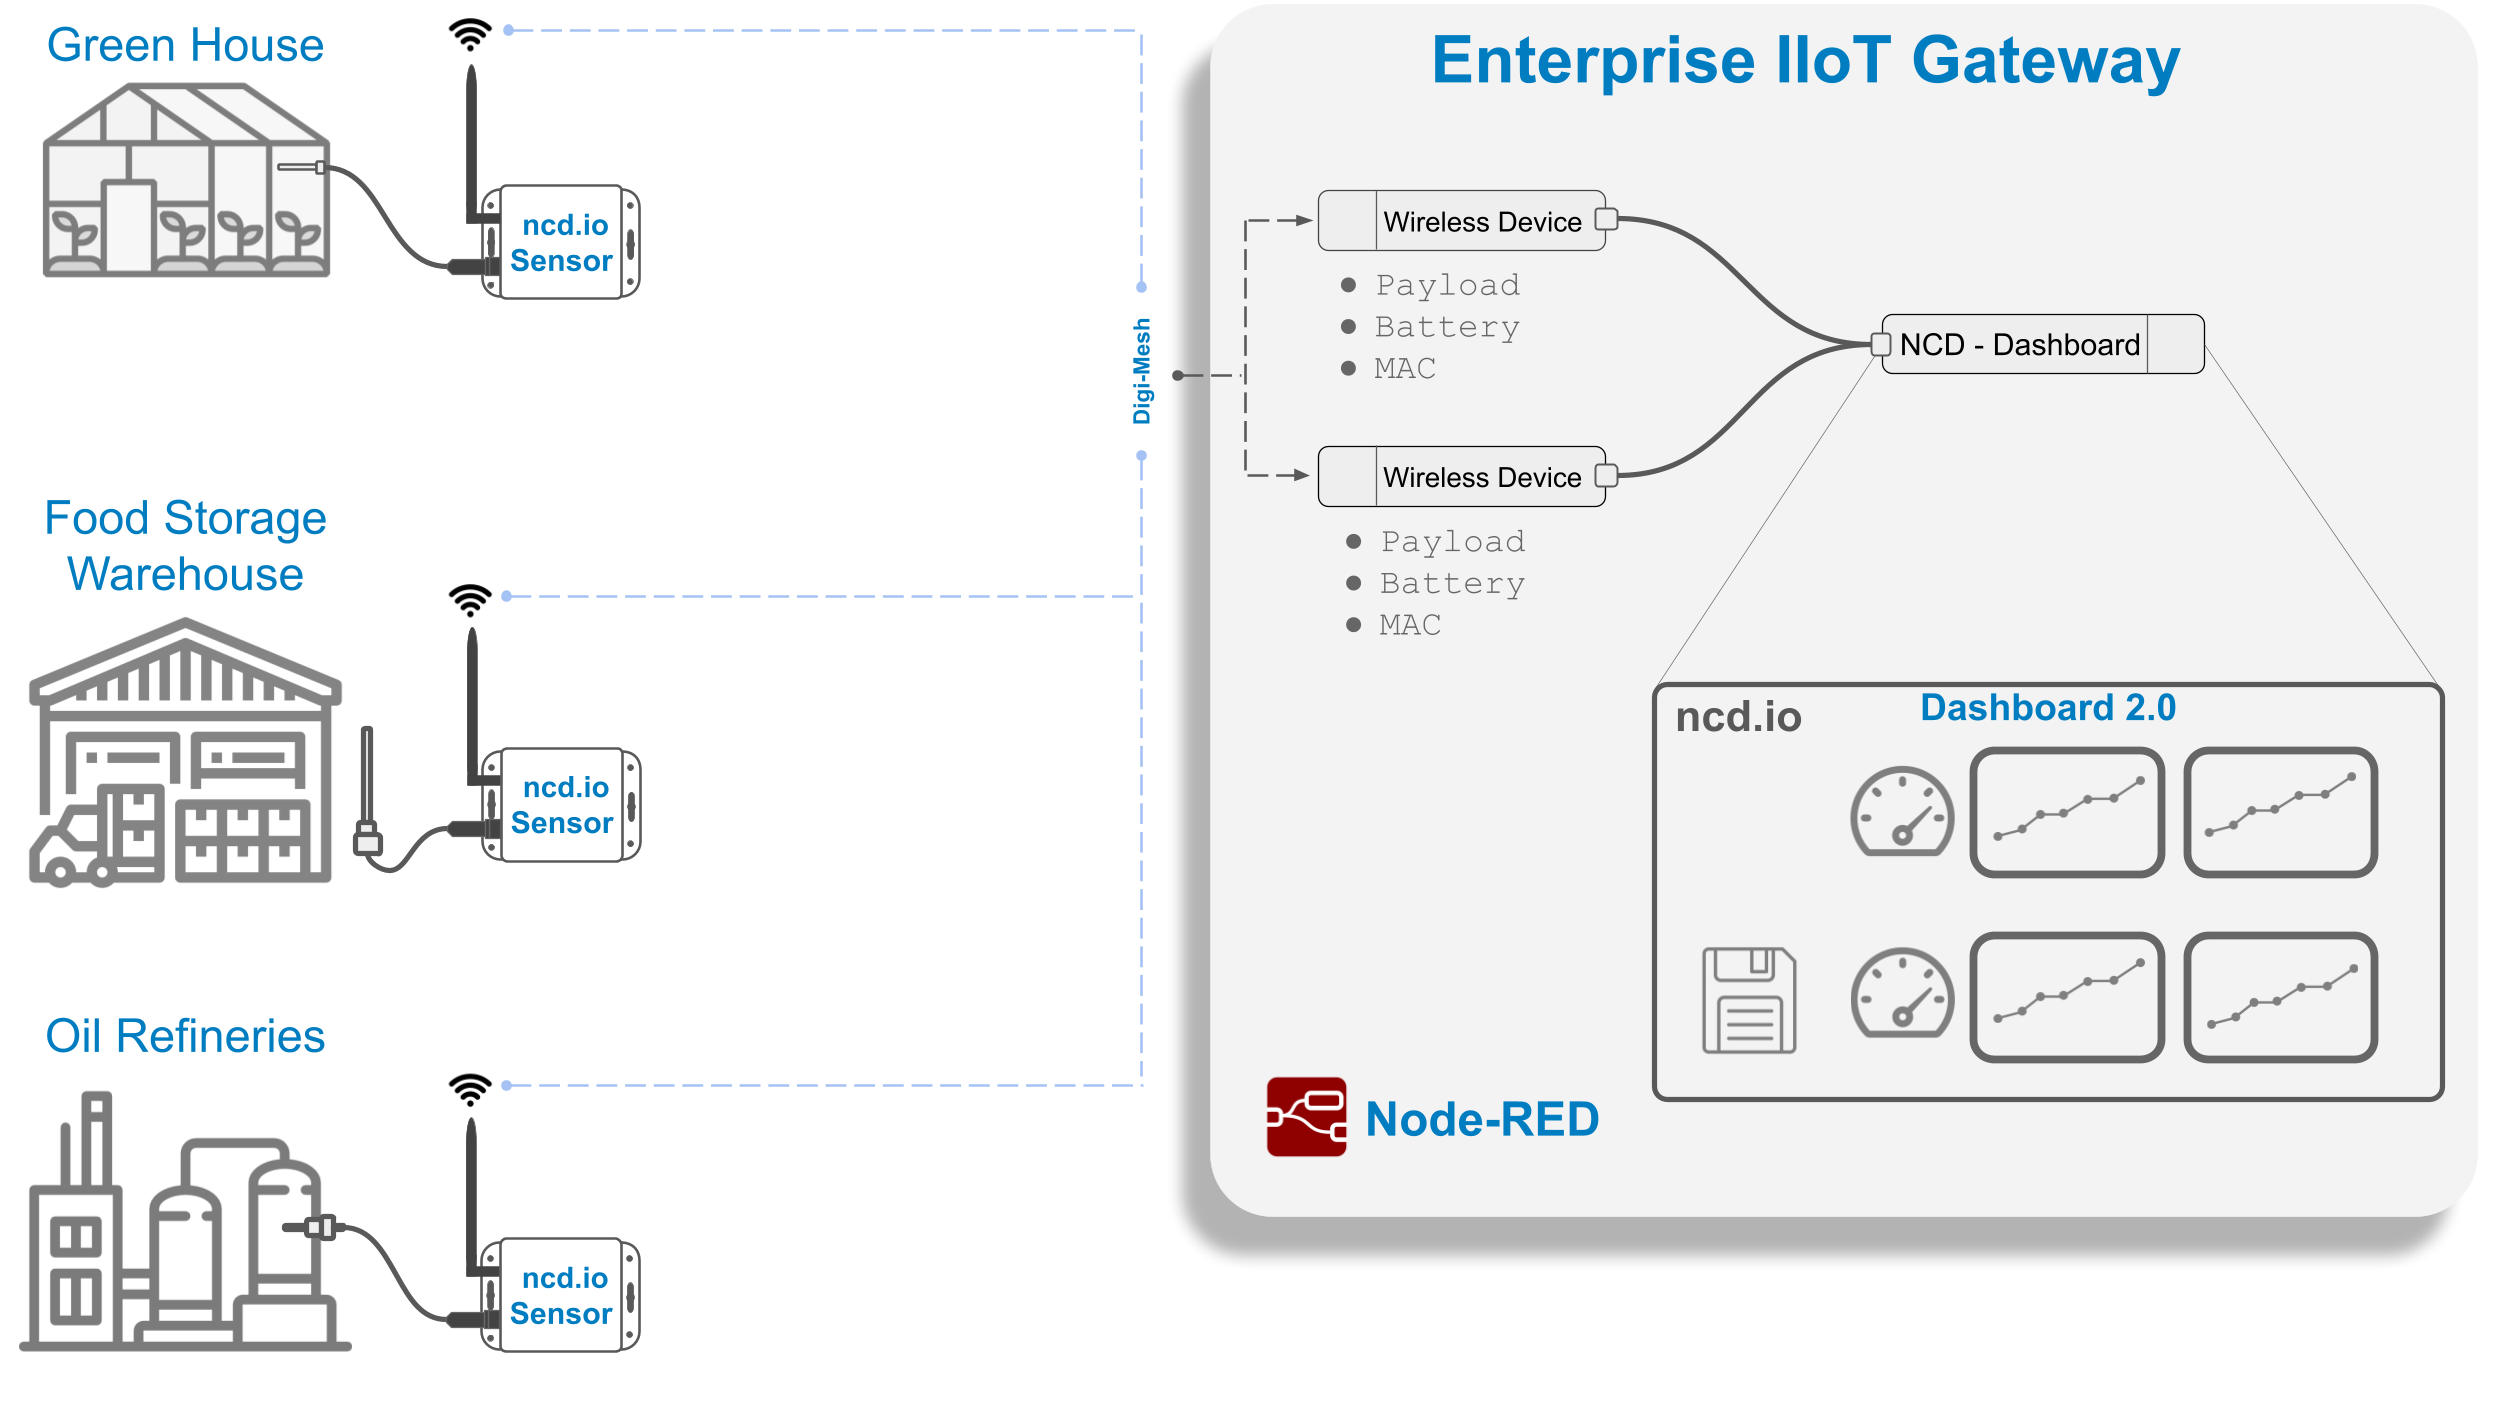
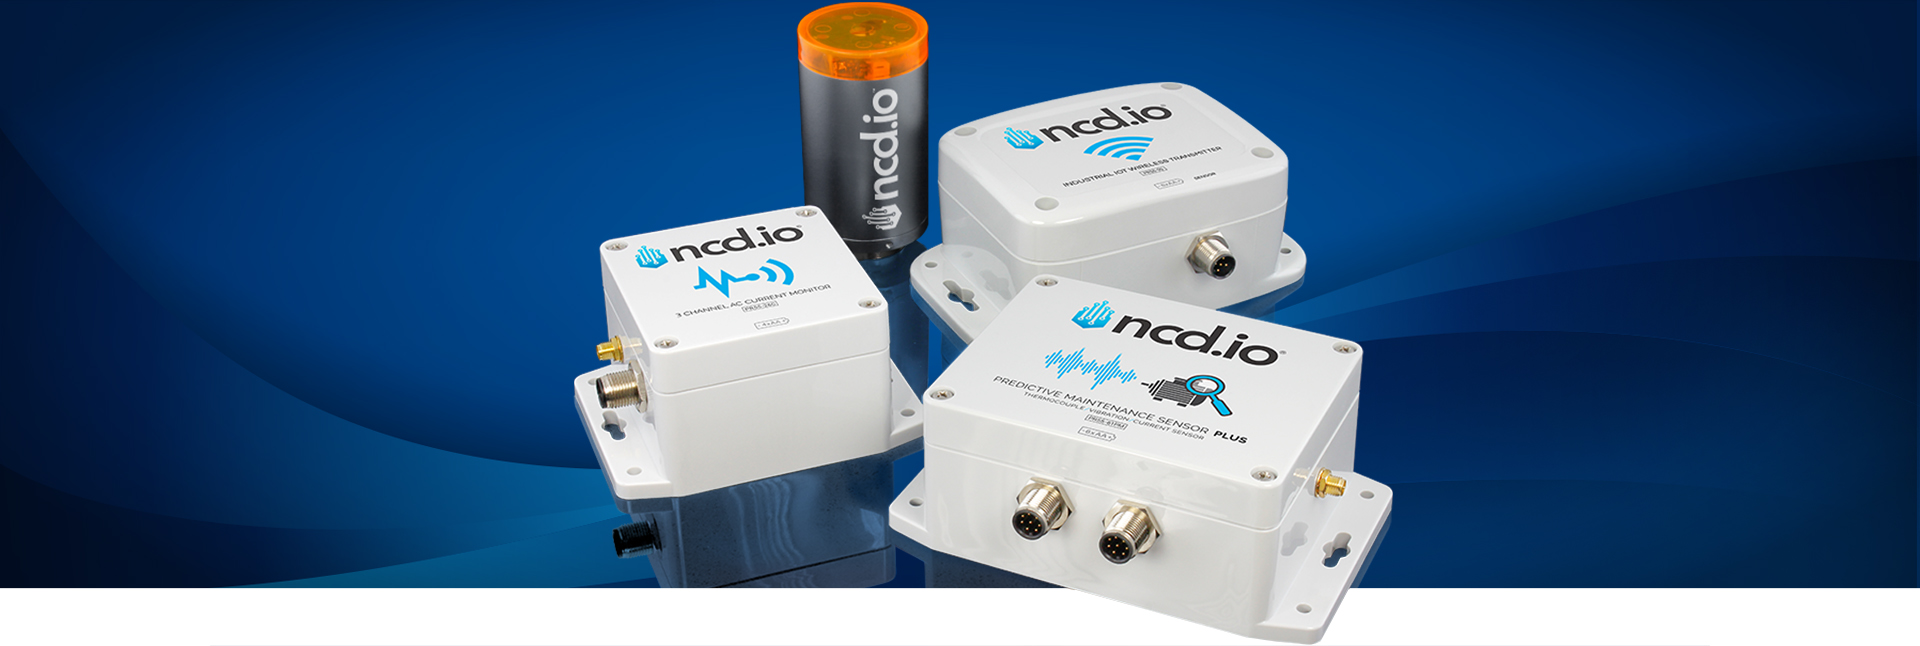
The next image is a visual representation of the Industrial IoT Wireless RTD Temperature Sensor. The sensor(s) collect the data of interest from the field elements, and then send the signal via Digi-Mesh to the Enterprise IIoT Gateway or Industrial IoT Wireless Modem, where it is processed by Node-RED and then sent to the NCD-Dashboard for storage and intuitive visualization.
NoteIf you are using the Industrial Wireless to USB Modem or the Industrial IoT Wireless to Ethernet Modem, you should install Node-RED on your PC.
Highlights
Real-Time Data
Real-time display of the variables emitted by the sensor.
Temperature.
Battery level.
Historical Data
Historical data visualization of the values of the variables emitted by the sensor.
Detection by Type
Industrial IoT Wireless RTD Temperature Sensor
Data Inspection
Function to inspect from the dashboard the objectdata coming from the sensor(s).
Local Datalogger
Generation and storage in local (or user-defined) path of CSV file with data from the sensor(s).
Dynamic Sensor Selection via MAC Address
Dynamic Data Loading: This feature allows your NCD Dashboard to automatically update the displayed information based on user selection.
Sensor Selection via MAC Address: Users can choose the sensor they want to see data from using a dropdown menu that lists sensors by their unique MAC address.
Automatic Data Update: Once a sensor is selected, the NCD Dashboard automatically retrieves and displays the relevant data for that specific sensor.
On-Demand Download
Convenient Data Export: Download sensor data as CSV files directly from your web browser.
Local File Access Not Required: Download the CSV file to any device within your local network, regardless of where the dashboard is hosted.
NoteThe data itself must be stored locally on the machine running the Node-RED.
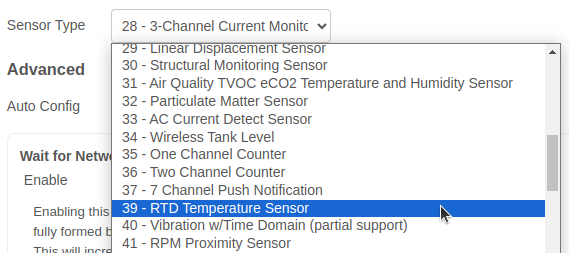
Important!This NCD Dashboard is designed for exclusive use with Industrial IoT Wireless RTD Temperature Sensor (Type 36).
Requirements
Before you begin using the NCD-Dashboard, you’ll need to have the following software installed:
Node-RED
NCD Library
FlowFuse Dashboard 2
Node-RED
Node-RED, is a visual programming tool, It provides a browser-based editor that allows creating applications by wiring predefined black box functions (nodes) . Despite its technical nature, Node-RED offers a user-friendly interface. Node-RED is an open-source project under the OpenJS Foundation. This means it’s free to use, without any monthly subscription fees. You can install and run Node-RED locally on your PC, or, in the case of our Enterprise IIoT Gateway, it comes pre-installed and runs as a service.
Sensor Data Processing and Delivery Flexibility
Every NCD sensor packet creates a message (object) that flows through connected nodes within Node-RED. These nodes allow you to:
Modify the message to suit your specific application needs.
Package the data into various protocols like MQTT, Modbus, or OPC-UA. Send the data directly to your preferred cloud platform (Azure, AWS, Ubidots, Losant, etc.).
Inject the data directly into an SQL or NoSQL database.
Integrate with SCADA systems like Ignition SCADA.
Resources
Here you can find a complete getting started guide for accessing Node-RED from the Enterprise IIoT Gateway:
This library handles communication to, and configuration of, the NCD Wireless Sensor Line. It can be used in conjunction with Node-RED to create and manage a Wireless Sensor Network using the Node-RED flow-based development tool on any platform.
NoteThis library is pre-installed on the Enterprise IIoT Gateway and ready to use. However, if you're using an IIoT Modem to communicate with sensors from a PC, follow the steps below to install the library.
Installing NCD Library from Node-RED Interface
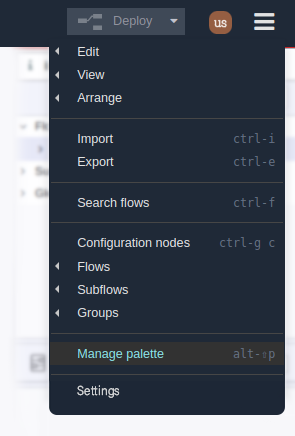
Step 1.- Access to Node-RED interface, then, inside the Node-RED flow editor you must go to the main menu (top right) and select the “Manage Palette” Option as shown in the following Image:
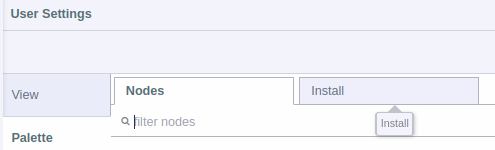
Step 2.- The “User Settings” window will be displayed, inside “Palette” you must select click on the “Install” tab.
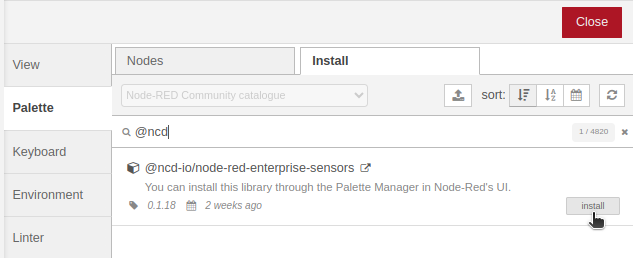
Step 3.- In Search Field enter “@ncd-io/node-red-enterprise-sensors”, you will see the following:
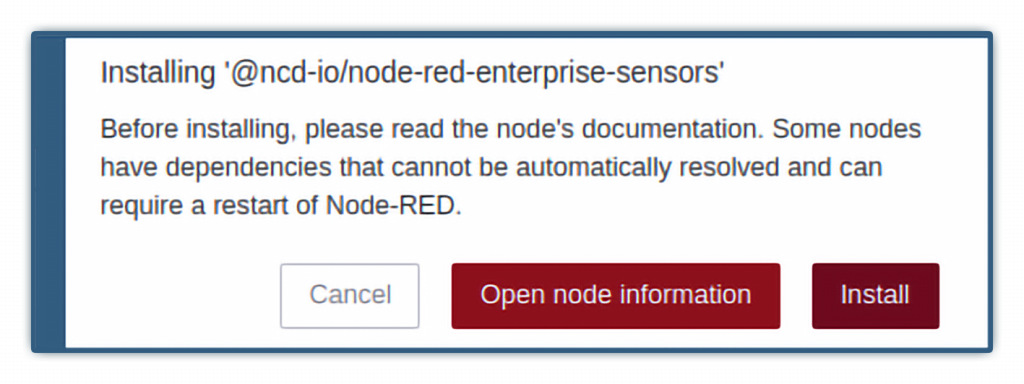
Step 4.- Click the “Install” button to start the installation process, a window will appear at the top of the screen, asking you to confirm the installation:
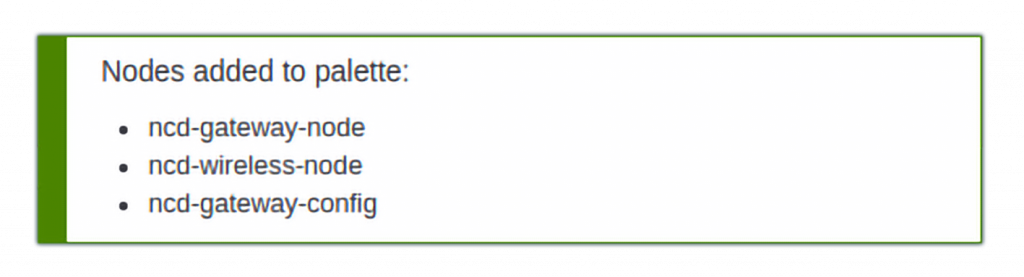
Step 5.- Once the process is completed you will see the following window:
See the following GIF for a visual demonstration of the installation process:
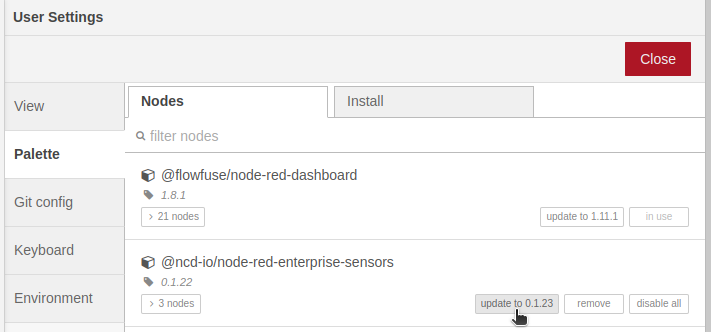
NoteIf you already have the NCD library installed on your Node-RED instance and a new version of NCD library is available, just click on the update button, you will see the following.
FlowFuse Dashboard 2
FlowFuse Dashboard 2.0 is an easy to use collection of nodes for Node-RED that allows you to create data-driven Dashboards & data visualizations. Installation procedure is similar to the previous one, FlowFuse’s Node-RED Dashboard 2.0 is also available in the Node-RED Palette Manager.
Step 1.- Open the menu in the top-right of Node-RED, then Click “Manage Palette”:
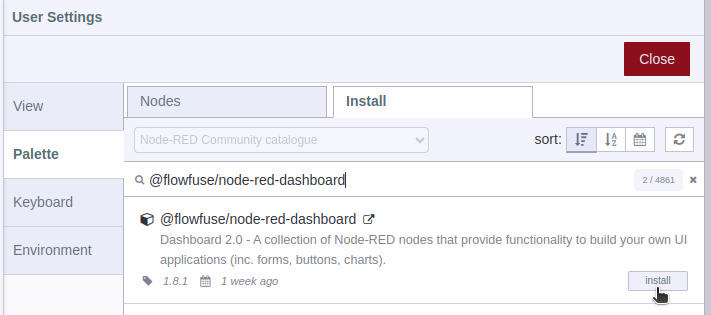
Step 2.- Switch to the “Install” tab, Search “@flowfuse/node-red-dashboard”, Install the package:
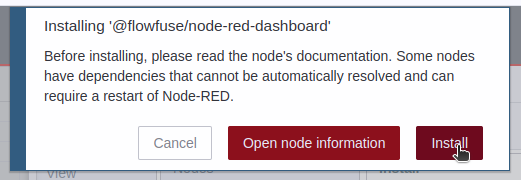
Step 3.- You must confirm the installation by clicking on the Install button in the pop-up window.
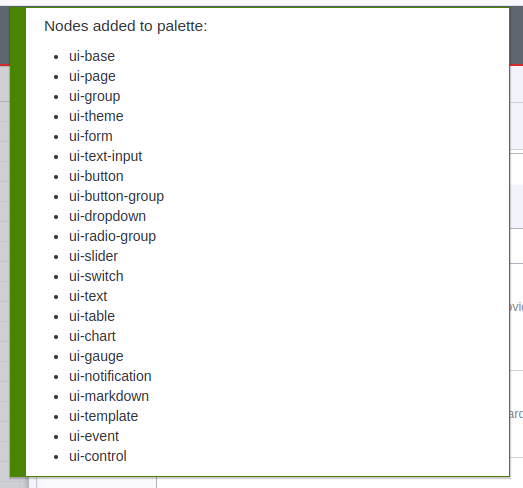
Step 4.- You will see a list of the dashboard 2 nodes that have been installed.
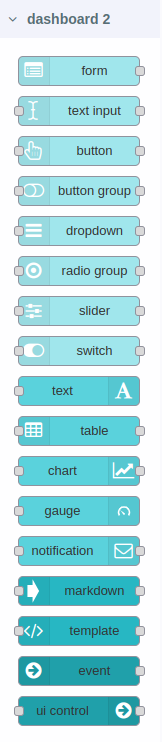
Step 5.- In workspace you can see the available nodes in the nodes palette, as shown in the following image:
See the following GIF for a visual demonstration of the installation process:
Important!Our NCD Dashboards are supported and maintained for version 2 of the Dashboard, not version 1.
Importing
After successfully installing Node-RED and Dashboard 2.0, you’re ready to import the NCD Dashboard, which is specifically designed and optimized for NCD sensors. The process is straightforward, but be sure to follow these steps carefully:
Copy the JSON: Locate the NCD Dashboard JSON file.
Import the JSON: Within Node-RED, use the import function to bring in the copied JSON file.
This will import the NCD Dashboard elements into your Node-RED workspace, allowing you to visualize and interact with your NCD sensor data.
Copy Dashboard File
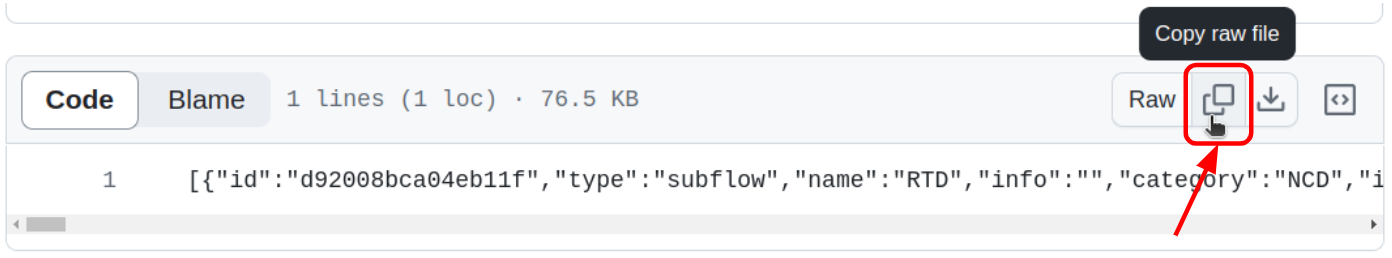
1. Click on the following link to access the NCD Dashboard source code:
2. Once the repository is open, locate the button that allows you to copy the raw code of the NCD Dashboard. Refer to the following image for a visual reference:
Import Dashboard
With the NCD Dashboard source code copied, head back to the Node-RED node editor and follow these next steps carefully:
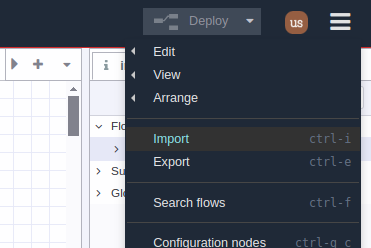
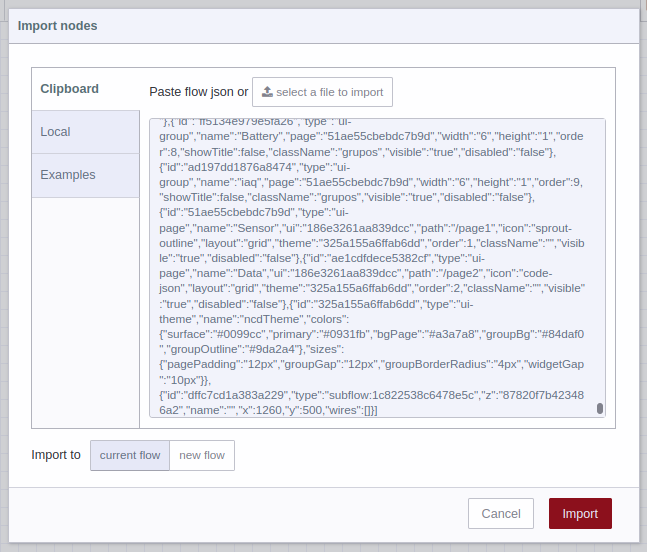
1. Go to the Main Menu (icon in the upper right corner) then click on “Import” option, as shown in picture:
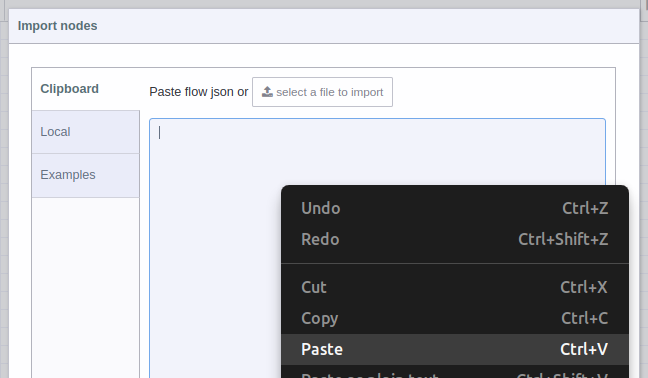
2. A text-box will be opened. Right click and paste the code you just copied from GitHub, as shown in picture:
3. You should see the JSON code in text-box, now you can press the red “Import” button at the bottom right (by default the “current flow” option is selected):
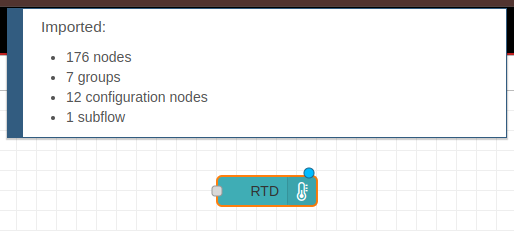
4. In the top of the Node-RED editor, you will see information of the NCD-Dashboard you just imported, and automatically you will have the node available inside the node editor, now you can position it inside the editor or workspace by left clicking:
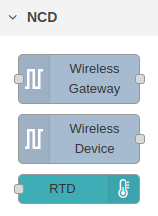
5. You may also notice that the NCD-Dashboardnode has been added to the NCD node group in nodes palette.
This GIF provides a visual demonstration of the importing process.
Configuring
This section delves into configuring and connecting nodes within the Node-RED editor. Here, we’ll explore:
Configure NCD Nodes: how to set up NCD Nodes to get data from sensors.
Node Connections: Learn how to establish connections between your nodes to create the desired data flow.
Properties and Data Storage Configuration: Discover the property that allows you to define the path where sensor data will be stored within the NCD-Dashboard node.
NCD Dashboard Node Status: Understand how to utilize the visual node status feature to monitor the operational state of each node.
Configure NCD Nodes
The first step is to configure your NCD nodes (you may have already configured your nodes). but it is important to remember that this NCD-Dashboard only works for The Industrial IoT Wireless RTD Tmperature Sensor :
In the following links, you can find information on configuring NCD nodes in Node-RED to get sensor data:
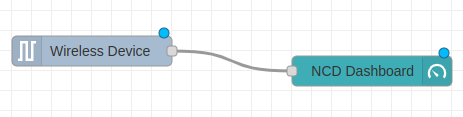
With your NCD nodes configured and sensor data flowing, the next step is to connect the output of the “NCD Wireless Device” node (corresponding to the sensor) to the input of the “NCD Dashboard” node. Refer to the following image for a visual representation:
Connecting Multiple Sensors
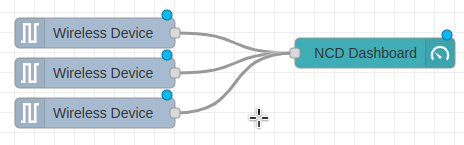
The NCD Dashboard node is designed to handle data from several sensors simultaneously. Simply connect the output of each “Wireless Device” node to the same input of the “NCD Dashboard” node, as illustrated in the following image:
NoteWe’ll discuss how the user interface handles multiple devices in a later section.
Properties and Data Storage Configuration
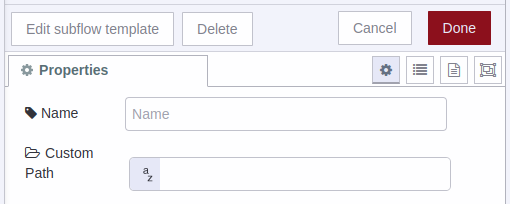
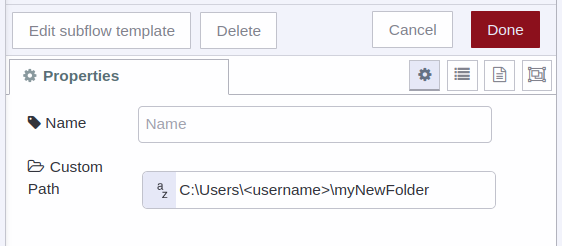
If you double left click on the NCD Dashboard node you can open the Properties.
Name: You can assign an identifier to the NCD-Dashboard node. This name only helps distinguish your specific node within the node editor (from other nodes).
Custom Path: By default, this property is set to a fixed location. The NCD-Dashboard retrieves data from your sensor and stores it locally within Node-RED.
Data Storage: The NCD-Dashboard automatically saves the generated CSV files from the sensor(s) within the Node-RED folder.
Linux: $HOME/.node-red/log
Windows: $HOMEPATH/.node-red/log
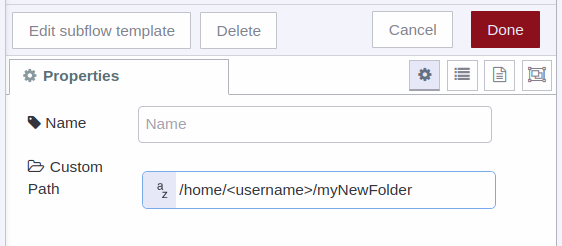
NoteBy default, the NCD-Dashboard stores sensor data in its default location. However, you have the flexibility to specify a different local path for data storage. To do this, simply assign the desired local directory path to the “Custom Path” property within the NCD-Dashboard node. The NCD-Dashboard will then use your designated path to store sensor data.
For PC/Windows
For Linux
NCD Dashboard Node Status
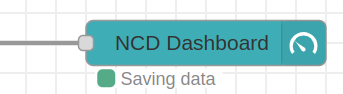
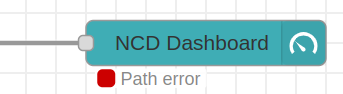
The NCD Dashboard nodes are designed to provide visual feedback on their operational state. This status can vary depending on the node’s input data or configuration. Here are some common scenarios you might encounter:
1. If the path you enter is correct, or if you leave the property field blank (using the default path), you should see a “Saving data” status when new sensor data arrives at the node input, indicating successful storage.
2. It’s important to assign a valid route. If the NCD-Dashboard detects an invalid route, it will display a “Path error” message.
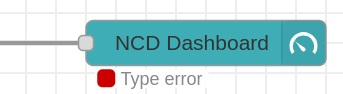
3. If you connect a different type of NCD sensor, you will see the “Type error message”.
Accessing NCD Dashboard
After successfully configuring and connecting your nodes, the next step is to access the user interface. This is where the NCD Dashboard elements, such as gauges, charts, and buttons, are displayed.
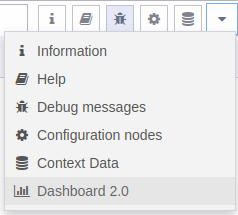
Step 1. Clic on the “Dashboard 2.0” option in the sidebar:
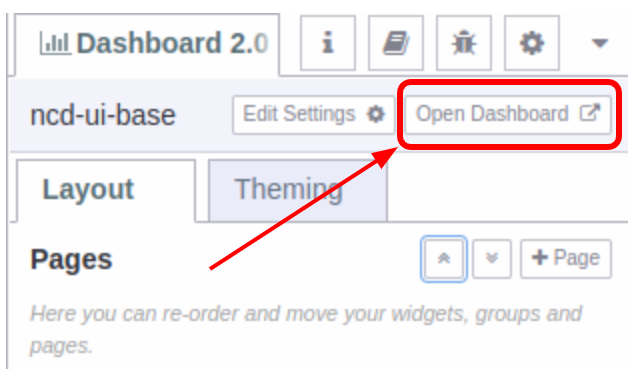
Step 2. Then click on the “Open Dashboard” option:
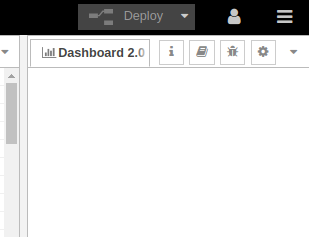
NoteIn case you have deployed and cannot see the “Dashboard 2.0” content, you should reload the current page of the web browser with the “F5” key or “Reload page”.
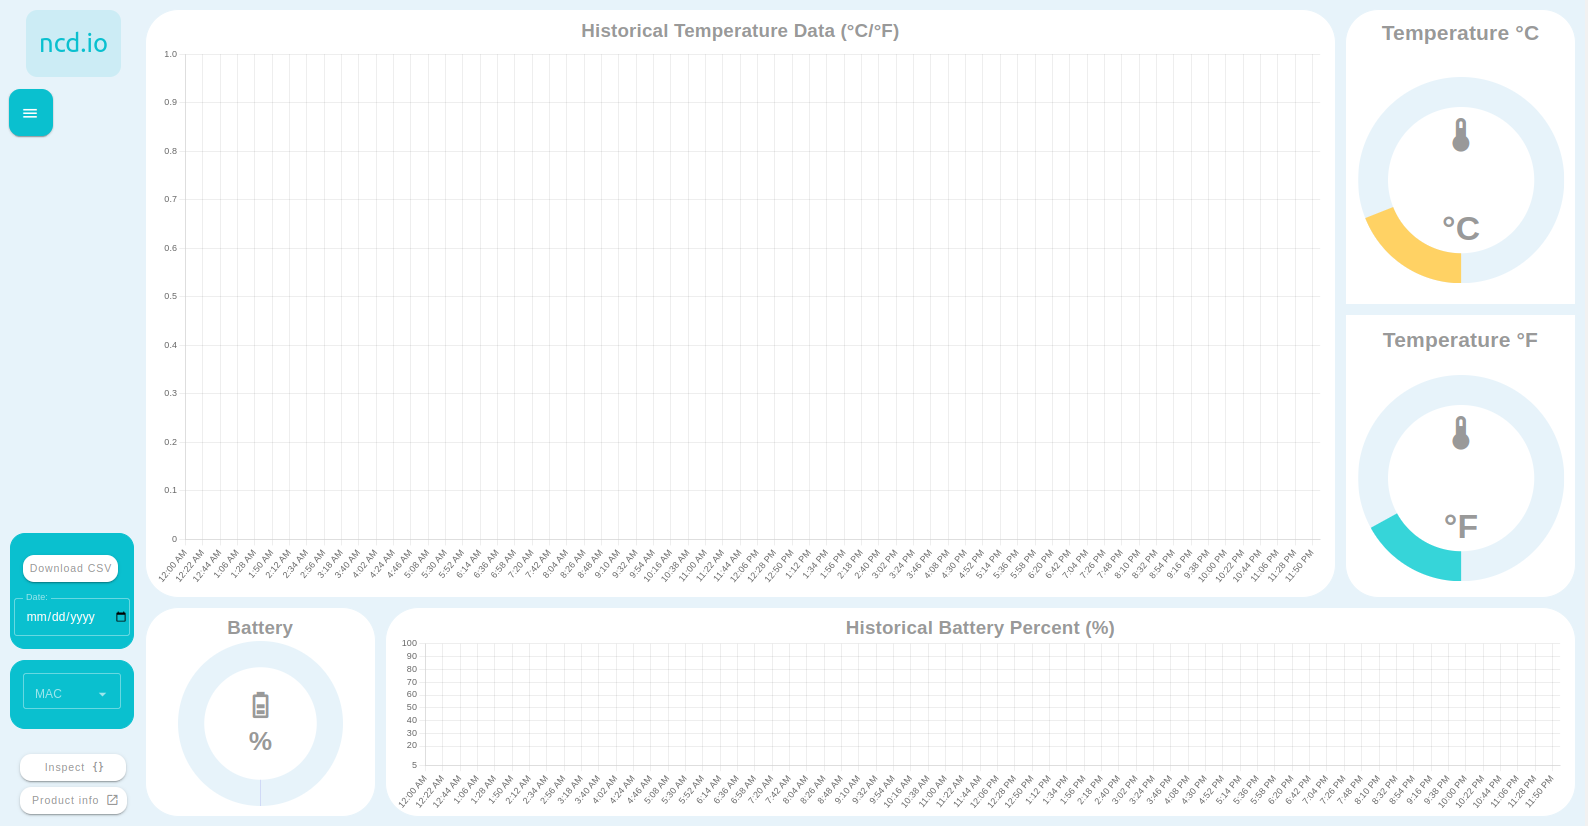
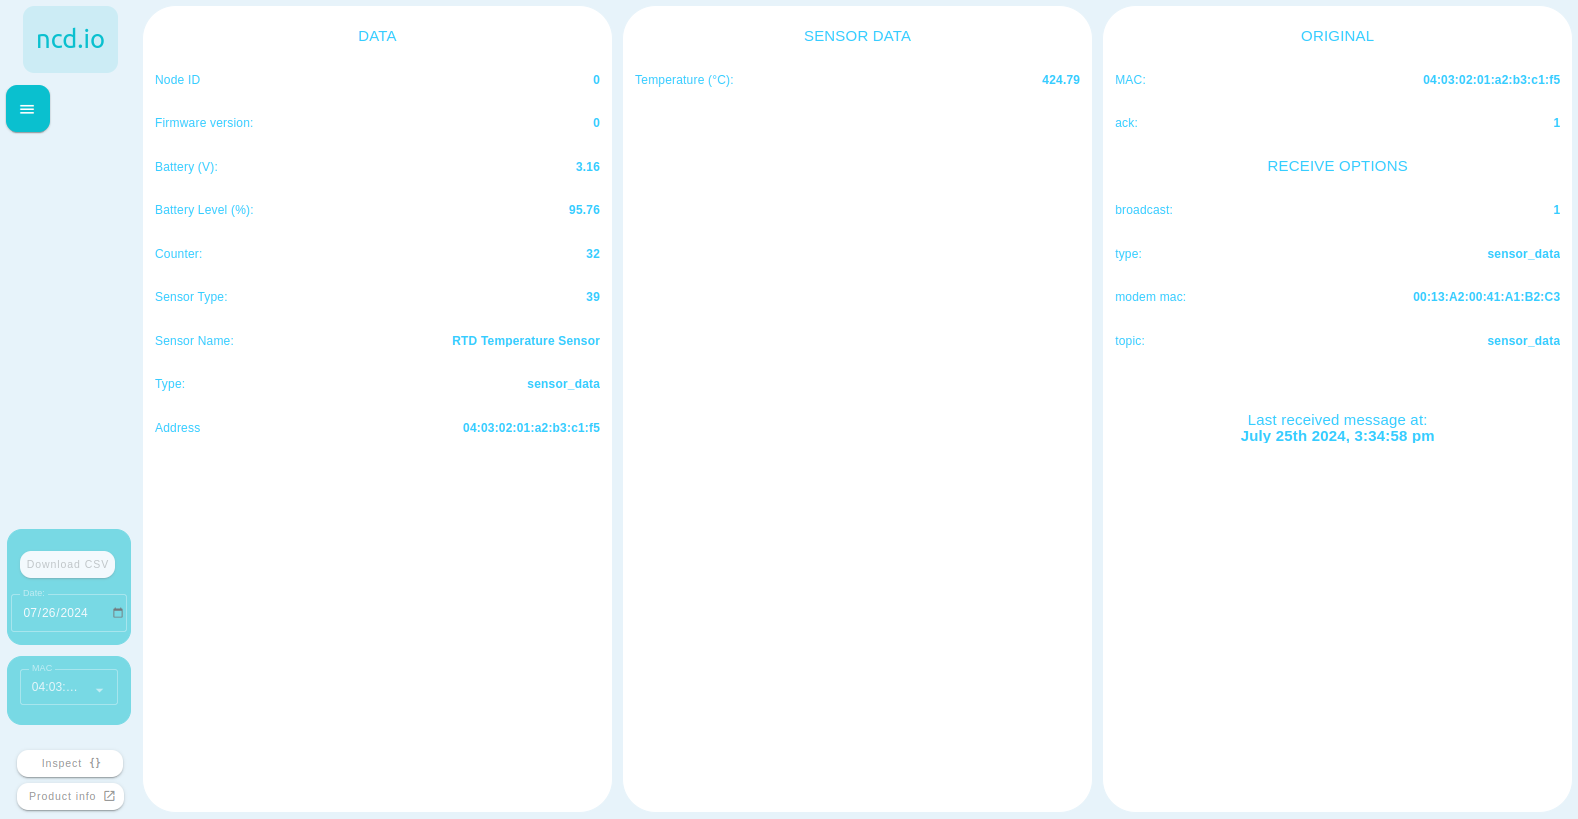
Step 3. Your NCD Dashboard will automatically open in a new window, displaying the following elements:
Features
In the next section, we’ll delve into the NCD Dashboard elements and their characteristics.
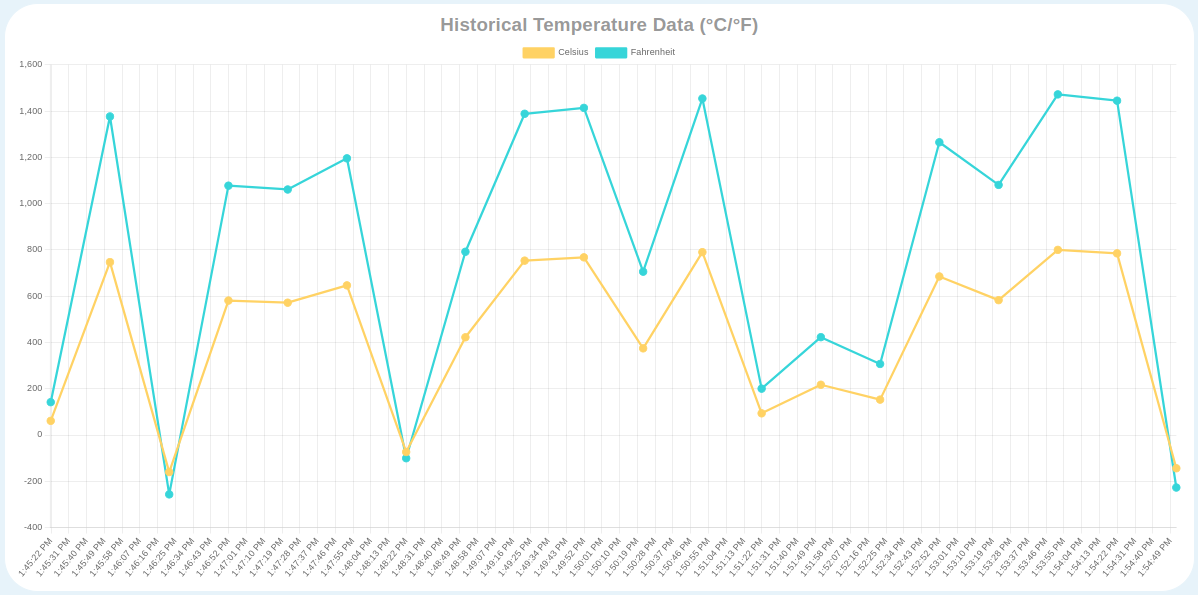
Main Temperature Chart
The NCD Dashboard offers insightful chart that track historical temperature data. This chart is configured to display or load the most recent 20 data points, providing a clear picture of temperature trends. Additionally, the chart dynamically update to reflect the latest sensor readings, ensuring you always have access to real-time and historical information.
NoteIt is possible to show/hide individual lines in the chart, allowing you to display only the unit of your interest, either Celsius or Fahrenheit.
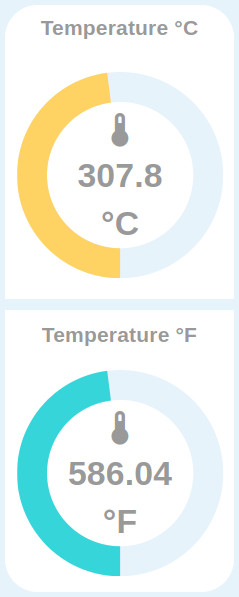
Main Temperature Gauges
Indicator displaying the temperature value in real time. You can view real-time temperature data in Celsius or Fahrenheit units.
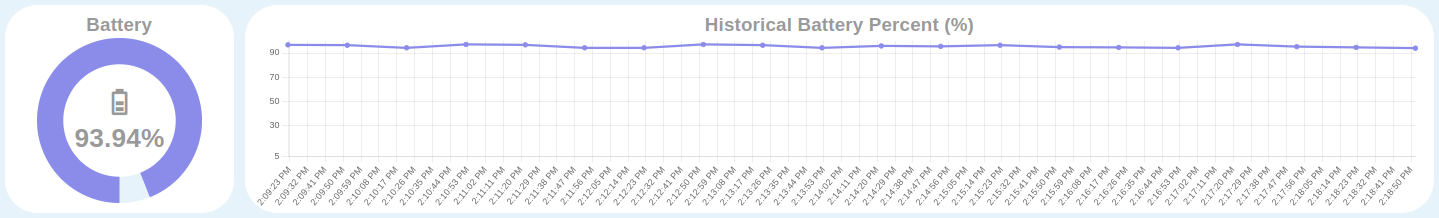
Battery Status
The NCD Dashboard provides a dedicated gauge and chart to visualize both real-time and historical sensor battery levels. This allows you to proactively predict battery replacements, ensuring uninterrupted sensor operation.
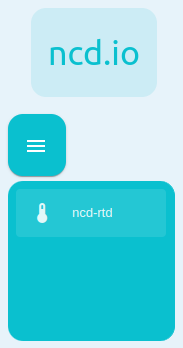
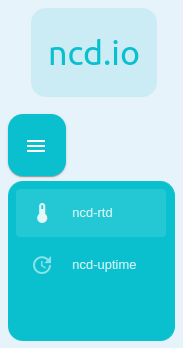
Main Menu
This menu facilitates switching between different NCD-Dashboards within the user interface (UI). This functionality is particularly useful if you have configured multiple NCD Dashboards to monitor various types of sensors or processes.
NoteFor example, if you have configured an NCD dashboard and import another NCD dashboard type, you will be able to navigate between the NCD Dashboards from the main menu. An example of this process is illustrated in the following GIF:
DatePicker & Datalogger
The NCD Dashboard allows you to directly download locally stored CSV files containing historical data from your NCD Sensors through your web browser.
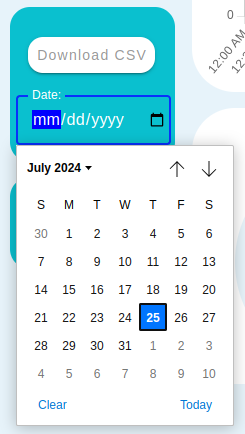
Step 1.- To display the date picker you must click on the icon on the right side of the “Date:” box.
Step 2.- Then select the date of interest:
Locate the download section in the bottom left corner. It features two fields:
Date: Enter the desired date (format: mm/dd/yyyy) to download the corresponding CSV file containing historical sensor data for that specific day.
Download CSV Button: Click this button to initiate the download of the CSV file directly to your web browser.
Date Format:
mm: Represents the month (e.g., 01 for January, 12 for December).
dd: Represents the day of the month (e.g., 01 for the first, 31 for the last day of the month).
yyyy: Represents the four-digit year.
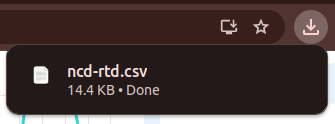
Step 3.- Then click on the “Download CSV” button. If the NCD-Dashboard finds the file for that date, you should be able to see the download begin (indicated by your web browser’s download icon) as shown in image.
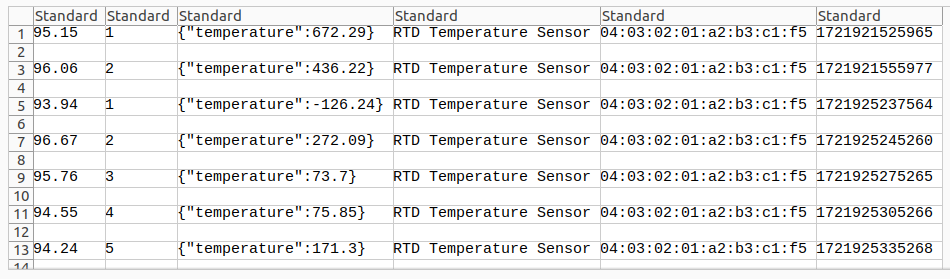
Step 4.- You can open the downloaded CSV file. The content will be similar to the following:
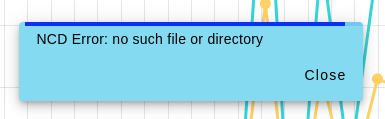
NoteIn case you enter a date of interest, which there is no CSV file generated, and press the “Download CSV” button, you will see the following message:
Important!CSV file download function is currently only available for the default data storage option (local in the path “./node-red”).
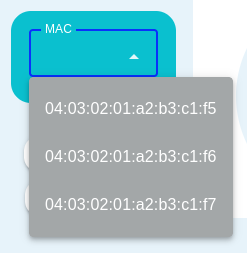
MAC Address Dropdown
The NCD-Dashboard provides a dropdown menu that allows you to select the ncd sensor of interest for loading, displaying, and storing its variables based on its MAC address.
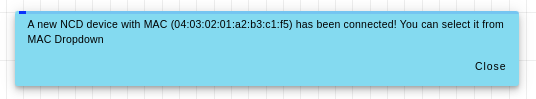
When you connect a new NCD sensor to the NCD-Dashboard node, a pop-up window appears indicating a new device connection. This sensor will automatically be available for selection in the MAC Address dropdown.
An example of this process is shown in the following image:
Inspect
You can access the object data of each sensor using the “Inspect” button on the NCD-Dashboard. Click the button once to view the selected sensor’s inspection window, and click it again to return to the data view.
Product Info
The “Product Info” button directs you to information about the corresponding sensor on our website.
Summary
NCD’s IoT Long Range Wireless RTD Temperature Sensors excel in the market, offering unparalleled range, precision, battery life, security, and affordability. These sensors are the cornerstone of our comprehensive data collection solutions.
To visualize and leverage this data effectively, in this Article we explored our NCD RTD Temperature Dashboard. This dedicated, user-friendly platform seamlessly integrates with Node-RED, providing real-time and historical insights to optimize equipment maintenance and overall health.