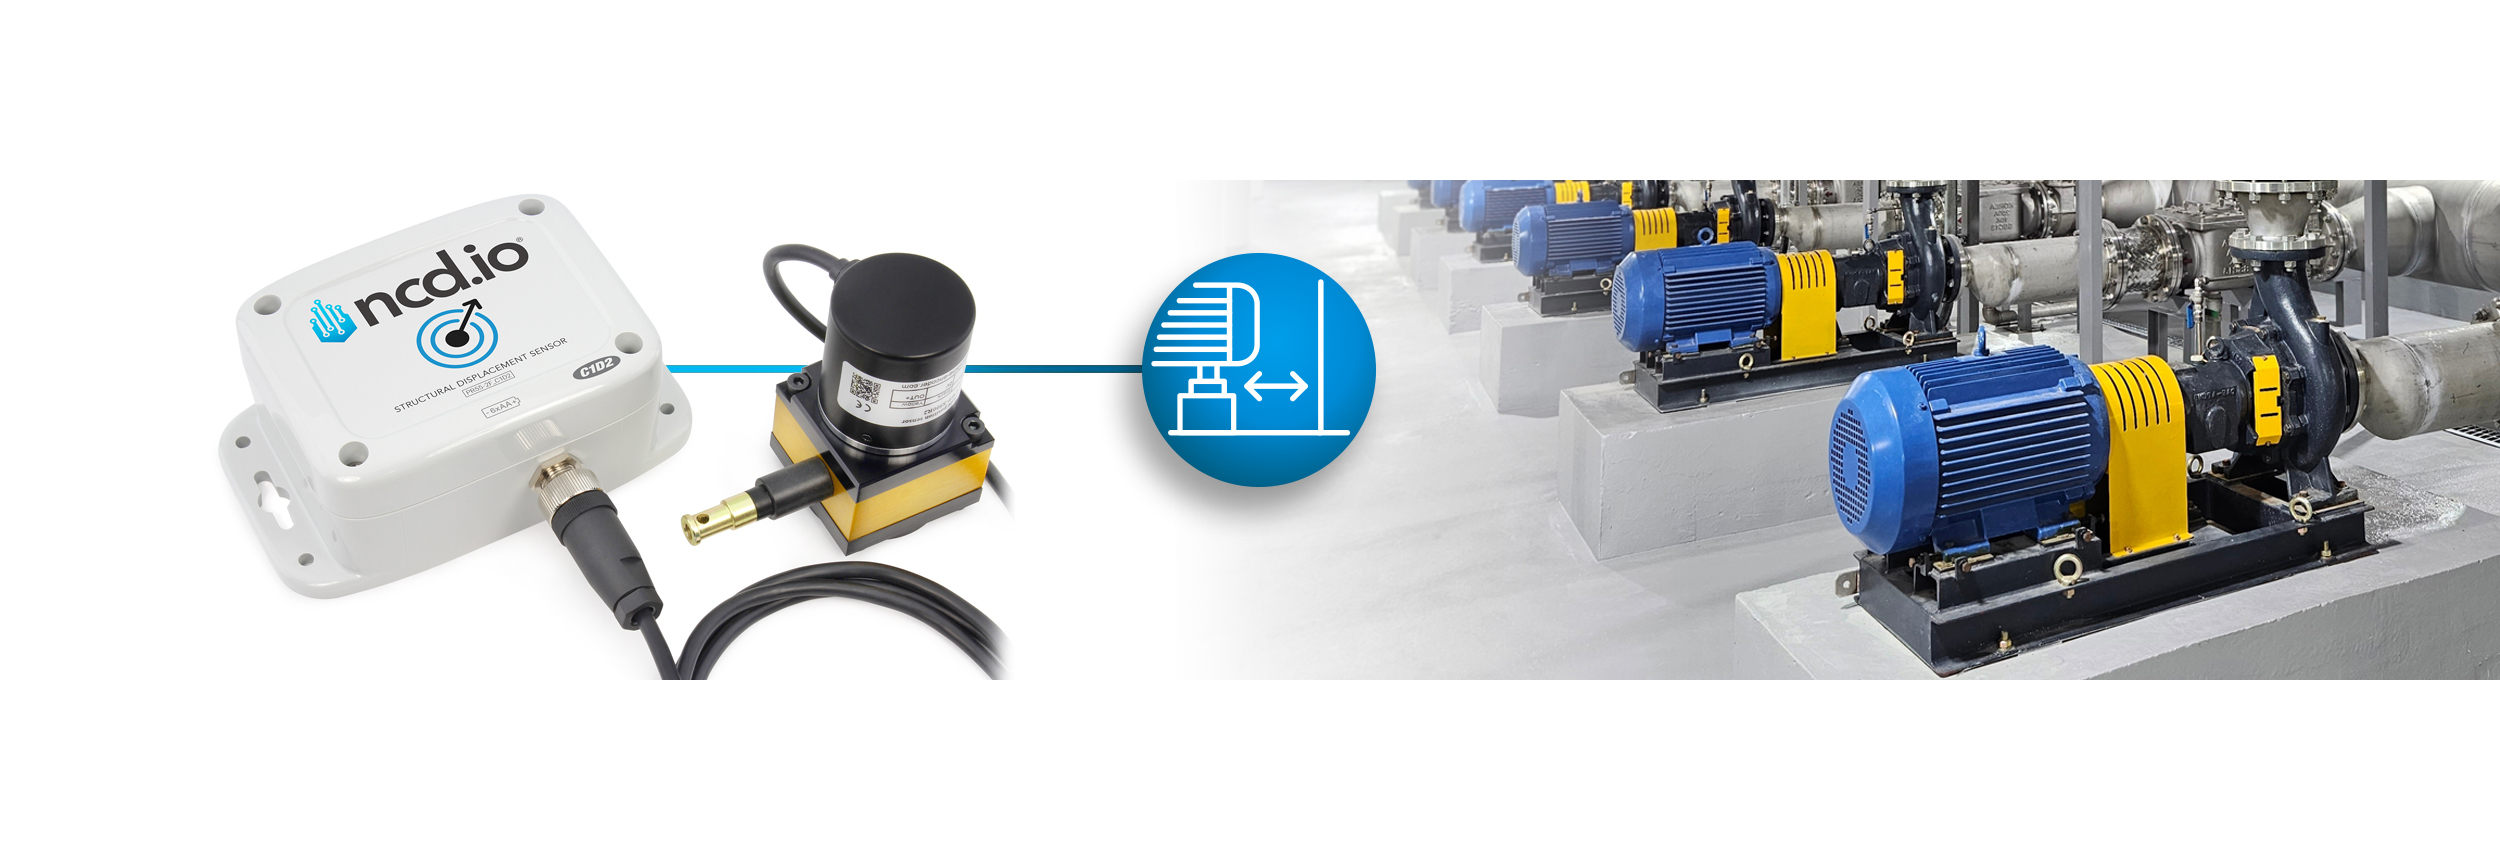
Mechanical vibrations are essential in factories and crucial for equipment health. They occur when machines experience imbalances, misalignments, worn bearings, or other problems. To assess your equipment’s condition effectively, analyzing these vibrations focuses on measuring three key aspects: intensity (amplitude), speed (frequency), and source (direction). By tracking these indicators, we can identify potential issues early on, allowing for prompt interventions and preventive maintenance plans. This proactive approach minimizes the risk of unexpected equipment stoppages and expensive repairs, ensuring optimal efficiency in your industrial processes.
For example vibration analysis is a crucial tool for monitoring pump health and preventing costly repairs. Sensors detect abnormal vibrations, which can indicate problems like imbalance or misalignment. These sensors are mounted on key pump parts and connect to a monitoring system that displays readings and analyzes data. Regularly checking and maintaining these sensors ensures accurate readings. Beyond detecting problems, vibration analysis can also optimize pump performance. By analyzing vibration data, engineers can identify areas for improvement in efficiency and wear reduction. Overall, vibration sensors are valuable for monitoring and maintaining pumps. They help detect potential problems early, prevent damage, and optimize pump performance. It’s important to remember that different pump types have varying vibration tolerance levels, and the effect of vibration on pump life depends on factors like duration and type of pump.
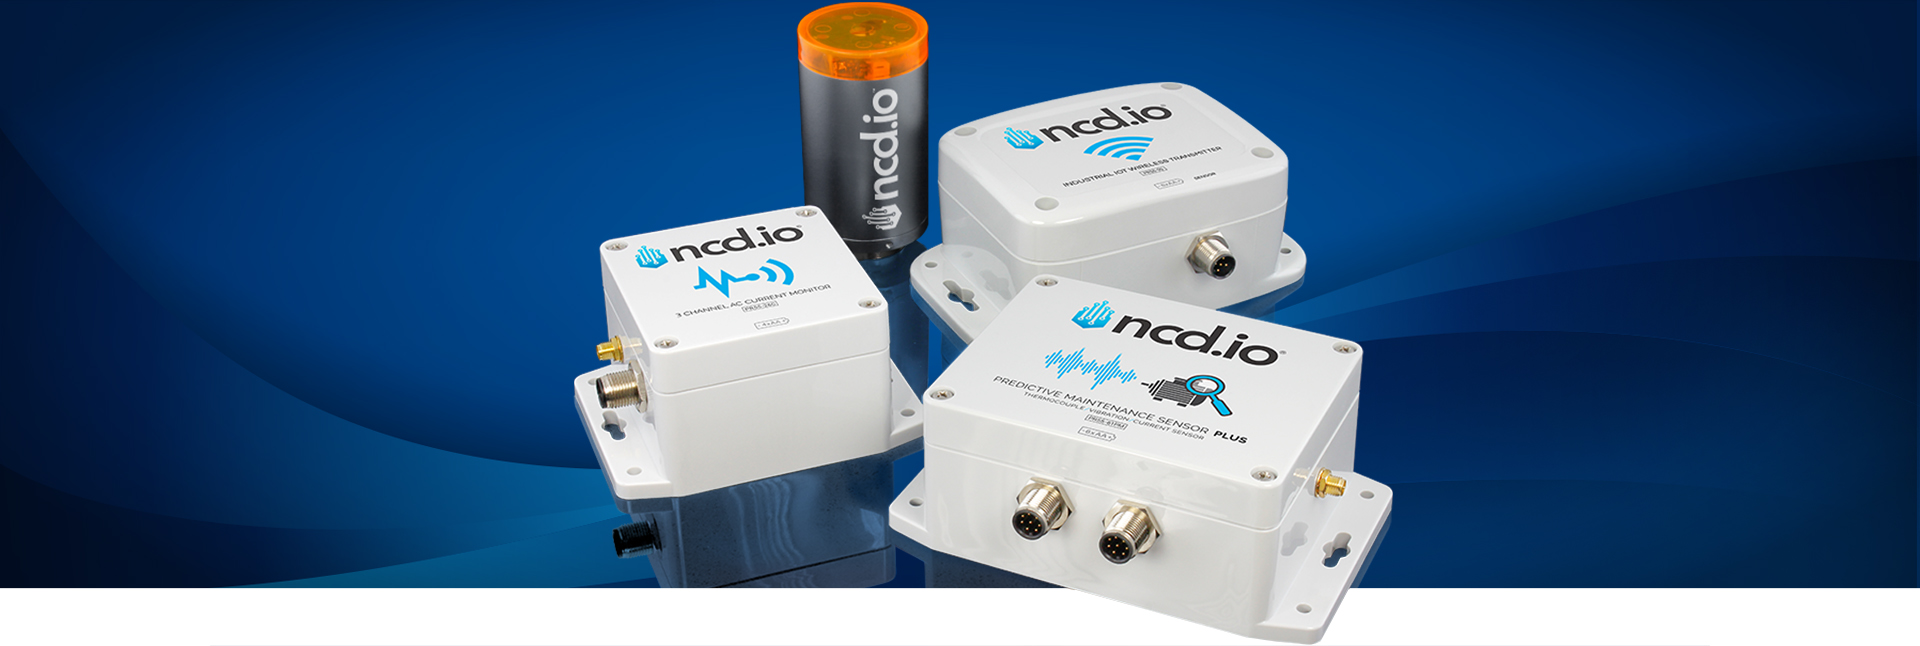
Industrial IoT Wireless 2 Channel Vibration Temperature Sensor V3
Imagine a silent guardian for your industrial operation, one that keeps a watchful eye (or rather, a watchful sensor) on not just one, but two crucial pieces of equipment simultaneously. That’s the power of the NCD’s Two-Channel Industrial IoT Wireless Vibration and Temperature Sensor V3.
This innovative sensor acts as a double agent, meticulously monitoring both mechanical vibrations and temperature across two different machines. By continuously analyzing these vital signs, the NCD sensor empowers you to identify potential problems early on, before they snowball into major issues. This proactive approach translates to significant savings in maintenance costs, increased production uptime, and ultimately, a more robust and efficient industrial operation.
The key advantage here is the ability to monitor two separate pieces of equipment with a single sensor. This eliminates the need for duplicate installations, saving you time, money, and valuable space.
Applications:
Monitoring motors, pumps, compressors, and other industrial equipment.
Predictive maintenance programs for machine health.
Want to learn more about how this revolutionary Vibration Sensor can transform your industrial monitoring? Click the “Show more” button.
NCD Dashboard
This article aims to introduce the main features of our 2Ch – Vibration ncd-dashboard and provide instructions on how to set up (Import, Configuration, and Connection) within your Node-RED instance. This solution serves as a visual tool to help you start working with the sensor in an easy and intuitive way.
Overview
The next image is a visual representation of the Industrial IoT Wireless 2 Channel Vibration Temperature Sensor v3. The sensor(s) collect the data of interest from the field elements, and then send the signal via Digi-Mesh to the Enterprise IIoT Gateway or Industrial IoT Wireless Modem, where it is processed by Node-RED and then sent to the NCD-Dashboard for storage and intuitive visualization.
Real-time display of the variables emitted by the sensor (Ch1 & Ch2):
ODR
Temperature.
Batery Percent.
3-axis – RMS Acceleration.
3-axis – MAX Acceleration.
3-axis – Velocity (mm).
3-axis – Displacement (mm).
3-axis – Peak (Hz).
Historical Data
Historical data visualization of the values of the variables emitted by the sensor.
Detection by Type
Industrial IoT Wireless 2 Channel Vibration Temperature Sensor V3
Data Inspection (Object)
Function to inspect from the dashboard the objectdata coming from the sensor(s).
Dynamic Sensor Selection via MAC
Dynamic Data Loading: This feature allows your NCD Dashboard to automatically update the displayed information based on user selection.
Sensor Selection via MAC Address: Users can choose the sensor they want to see data from using a dropdown menu that lists sensors by their unique MAC address.
Automatic Data Update: Once a sensor is selected, the NCD Dashboard automatically retrieves and displays the relevant data for that specific sensor.
Local Datalogger
Generation and storage in local (or user-defined) path of CSV file with data from the sensor(s).
On-Demand Download
Convenient Data Export: Download sensor data as CSV files directly from your web browser.
Local File Access Not Required: Download the CSV file to any device within your local network, regardless of where the dashboard is hosted. (Note: The data itself must be stored locally on the machine running the Node-RED flow)
IMPORTANT
This NCD Dashboard is designed for exclusive use with Industrial IoT Wireless 2 Channel Vibration Temperature Sensor V3 (Type 81).
Requirements
Before you begin using the NCD-Dashboard, you’ll need to have the following software installed:
Node-RED
NCD Library
FlowFuse Dashboard 2
Note: An Internet connection is required on your PC or Enterprise IIoT Gateway during the installation process.
Node-RED
Node-RED, is a visual programming tool, It provides a browser-based editor that allows creating applications by wiring predefined black box functions (nodes) . Despite its technical nature, Node-RED offers a user-friendly interface.
Node-RED is an open-source project under the OpenJS Foundation. This means it’s free to use, without any monthly subscription fees. You can install and run Node-RED locally on your PC, Raspberry Pi, or, in the case of our Enterprise IIoT Gateway, it comes pre-installed and runs as a service.
Key Features:
Open Source: Node-RED is freely available for use and modification, making it a cost-effective and transparent choice.
Local Installation: Run Node-RED directly on your device, providing complete control over data and privacy.
Every NCD sensor packet creates a message (object) that flows through connected nodes within Node-RED. These nodes allow you to:
Modify the message to suit your specific application needs.
Package the data into various protocols like MQTT, Modbus, or OPC-UA. Send the data directly to your preferred cloud platform (Azure, AWS, Ubidots, Losant, etc.).
Inject the data directly into an SQL or NoSQL database.
Integrate with SCADA systems like Ignition SCADA.
Here you can find a complete getting started guide for accessing Node-RED from the Enterprise IIoT Gateway:
This library handles communication to, and configuration of, the NCD Wireless Sensor Line. It can be used in conjunction with Node-RED to create and manage a Wireless Sensor Network using the Node-RED flow-based development tool on any platform.
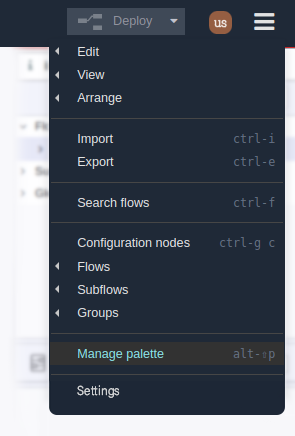
Step 1.- To install this library, the first thing to do is to access Node-RED which runs as a service on the Enterprise IIoT Gateway. Then, inside the Node-RED flow editor you must go to the main menu (top right) and select the “Manage Palette” Option as shown in the following Image:
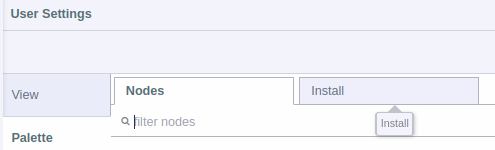
Step 2.- The “User Settings” window will be displayed, inside “Palette” you must select click on the “Install” tab.
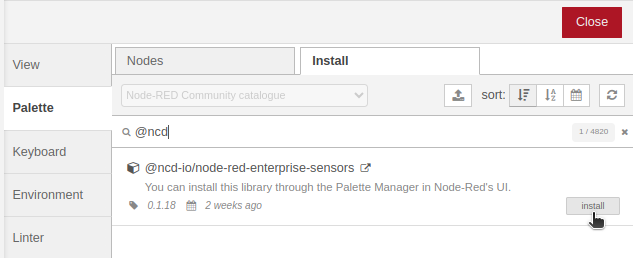
Step 3.- In Search Field enter “@ncd-io/node-red-enterprise-sensors”, you will see the following:
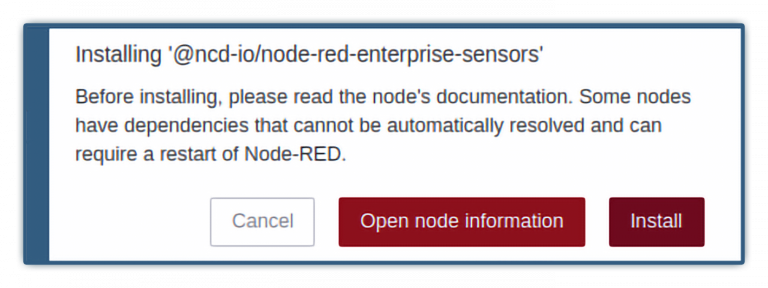
Step 4.- Click the “Install” button to start the installation process, a window will appear at the top of the screen, asking you to confirm the installation:
Step 5.- Once the process is completed you will see the following window:
Note: see the following GIF for a visual demonstration of the installation process:
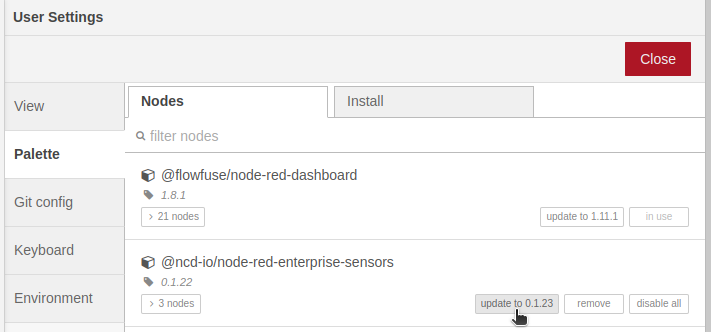
NOTE: If you already have the NCD library installed on your Node-RED instance and a new version of NCD library is available, just click on the update button, you will see the following:
Note: you can find the Enterprise Sensor Library Documentation here:
FlowFuse Dashboard 2.0 is an easy to use collection of nodes for Node-RED that allows you to create data-driven Dashboards & data visualizations. Installation procedure is similar to the previous one, FlowFuse’s Node-RED Dashboard 2.0 is also available in the Node-RED Palette Manager.
Step 1.- Open the menu in the top-right of Node-RED, then Click “Manage Palette”:
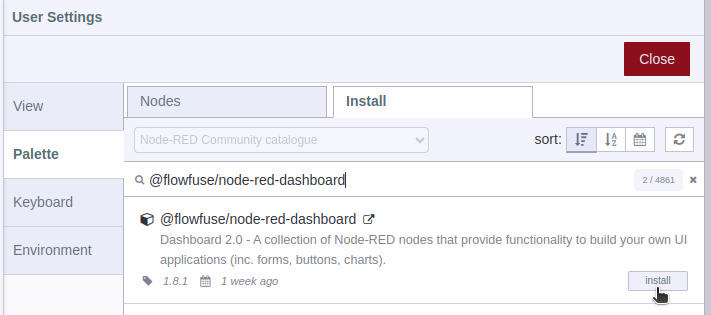
Step 2.- Switch to the “Install” tab, Search “@flowfuse/node-red-dashboard”, Install the package:
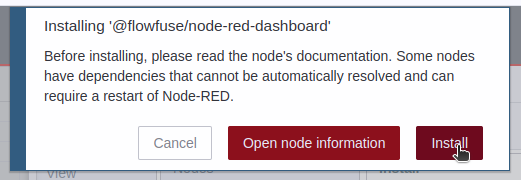
Step 3.- You must confirm the installation by clicking on the Install button in the pop-up window.
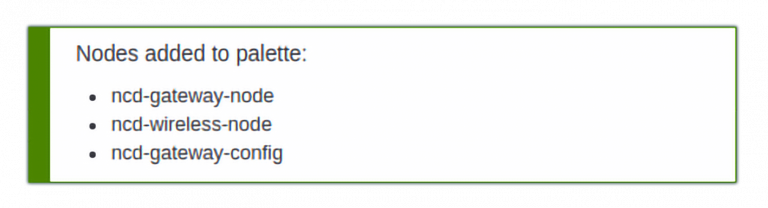
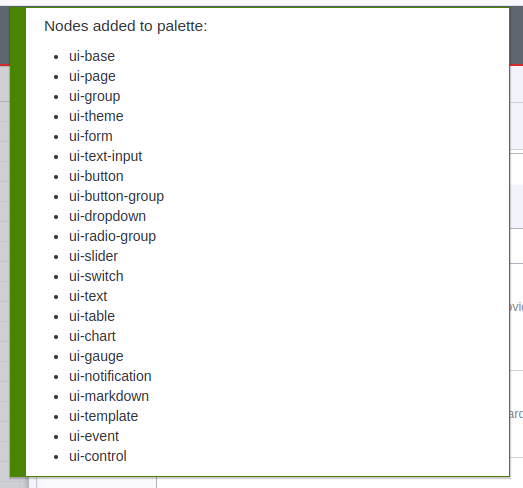
Step 4.- You will see a list of the dashboard 2 nodes that have been installed.
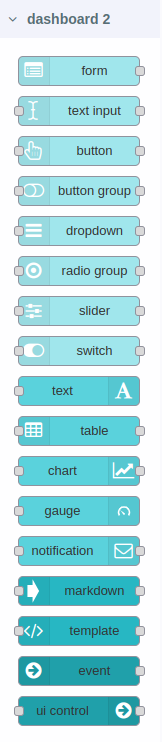
Step 5.- In workspace you can see the available nodes in the nodes palette, as shown in the following image:
Note: see the following GIF for a visual demonstration of the installation process:
IMPORTANT
Our NCD Dashboards are supported and maintained for version 2 of the Dashboard, not version 1.
Importing the NCD-Dashboard
After successfully installing Node-RED and Dashboard 2.0, you’re ready to import the NCD Dashboard, which is specifically designed and optimized for NCD sensors. The process is straightforward, but be sure to follow these steps carefully:
Copy the JSON: Locate the NCD Dashboard JSON file.
Import the JSON: Within Node-RED, use the import function to bring in the copied JSON file.
This will import the NCD Dashboard elements into your Node-RED workspace, allowing you to visualize and interact with your NCD sensor data.
Step 1. Copy the JSON
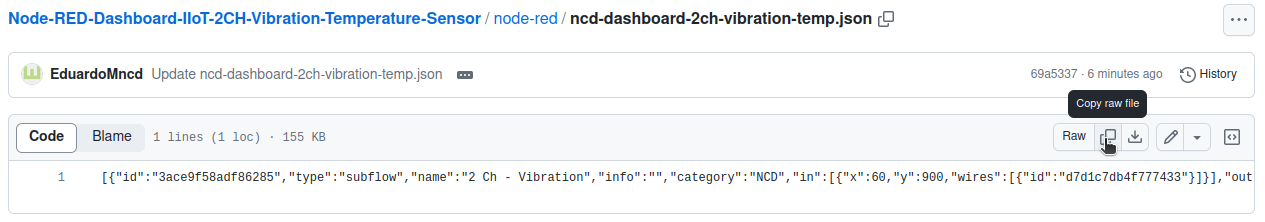
1. Click on the following link to access the NCD Dashboard source code:
2. Once the repository is open, locate the button that allows you to copy the raw JSON code of the dashboard. Refer to the following image for a visual reference:
Step 2. Import the JSON
With the NCD Dashboard source code copied, head back to the Node-RED node editor and follow these next steps carefully:
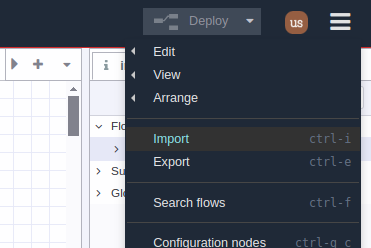
1.- Go to the Main Menu (amburger icon in the upper right corner) then click on “Import” option, as shown in picture.
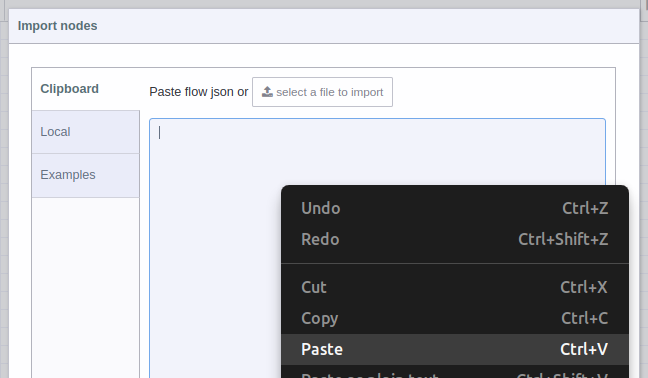
2.- A text-box will be opened. Right click and paste the JSON code you just copied from GitHub, as shown in picture:
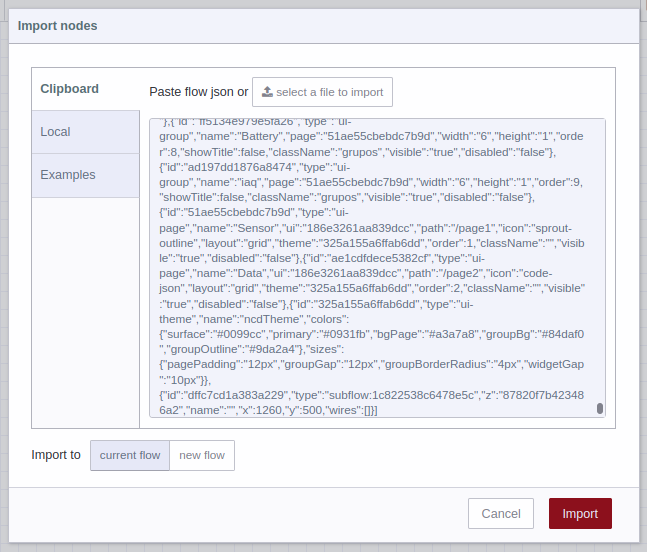
3.- You should see the JSON code in text-box, now you can press the red “Import” button at the bottom right (by default the “current flow” option is selected):
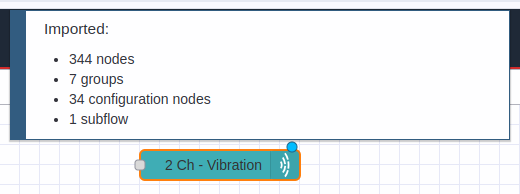
4.- In the top of the Node-RED editor, you will see information of the NCD-Dashboard you just imported, and automatically you will have the node available inside the node editor, now you can position it inside the editor or workspace by left clicking:
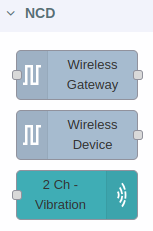
5.- You may also notice that the NCD-Dashboardnode has been added to the NCD node group in nodes palette.
Note: This GIF provides a visual demonstration of the importing process.
Configuring and Connecting Nodes in Node-RED
This section delves into configuring and connecting nodes within the Node-RED editor. Here, we’ll explore:
Configure NCD Nodes: how to set up NCD Nodes to get data from sensors.
Node Connections: Learn how to establish connections between your nodes to create the desired data flow.
Properties and Data Storage Configuration: Discover the property that allows you to define the path where sensor data will be stored within the NCD-Dashboard node.
NCD Dashboard Node Status: Understand how to utilize the visual node status feature to monitor the operational state of each node.
1. Configure NCD Nodes
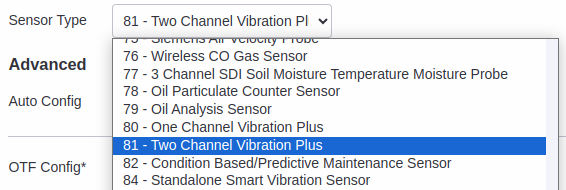
The first step is to configure your ncd nodes (you may have already configured your nodes), but it is important to remember that this NCD-Dashboard only works for The Industrial IoT Wireless 2 Channel Vibration Temperature Sensor v3:
In the following links, you can find information on configuring NCD nodes in Node-RED to get sensor data:
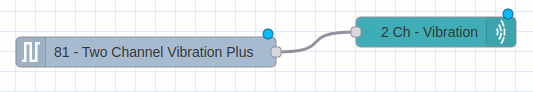
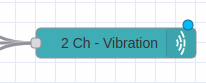
With your NCD nodes configured and sensor data flowing, the next step is to connect the output of the “NCD Wireless Device” node (corresponding to the sensor) to the input of the “NCD Dashboard” node. Refer to the following image for a visual representation:
For Type 81
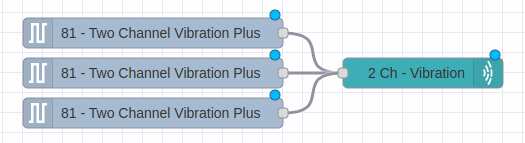
Connecting Multiple Sensors
The NCD Dashboard node is designed to handle data from several sensors simultaneously. Simply connect the output of each “Wireless Device” node to the same input of the “NCD Dashboard” node, as illustrated in the following image:
Note: We’ll discuss how the user interface handles multiple devices in a later section.
3. Properties and Data Storage Configuration
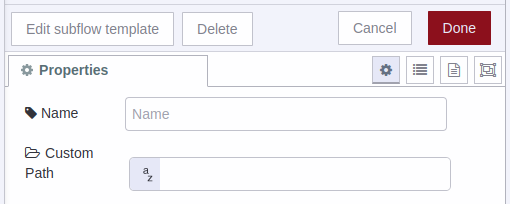
If you double left click on the NCD Dashboard node you can open the Properties.
Name: You can assign an identifier to the NCD-Dashboard node. This name only helps distinguish your specific node within the node editor (from other nodes).
Custom Path: By default, this property is set to a fixed location. The NCD-Dashboard retrieves data from your sensor and stores it locally within Node-RED.
Data Storage: The NCD-Dashboard automatically saves the generated CSV files from the sensor(s) within the Node-RED folder.
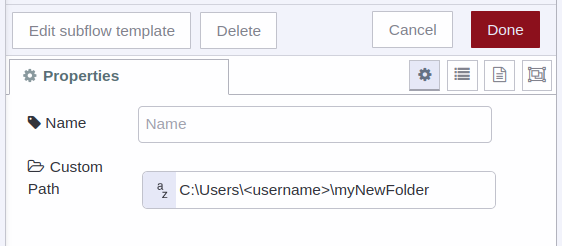
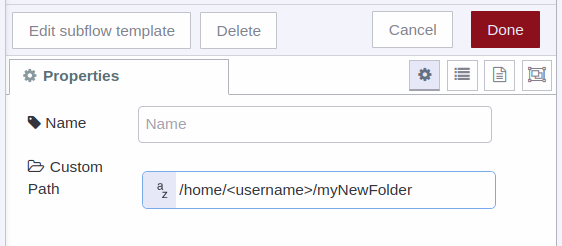
NOTE: By default, the NCD-Dashboard stores sensor data in its default location. However, you have the flexibility to specify a different local path for data storage. To do this, simply assign the desired local directory path to the “Custom Path” property within the NCD-Dashboard node. The NCD-Dashboard will then use your designated path to store sensor data.
1) For PC/Windows
2) For Linux
4. NCD Dashboard Node Status
The NCD Dashboard nodes are designed to provide visual feedback on their operational state. This status can vary depending on the node’s input data or configuration. Here are some common scenarios you might encounter:
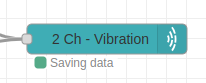
1.- If the path you enter is correct, or if you leave the property field blank (using the default path), you should see a “Saving data” status when new sensor data arrives at the node input, indicating successful storage.
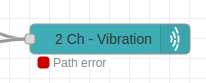
2.- It’s important to assign a valid route. If the NCD-Dashboard detects an invalid route, it will display a “Path error” message.
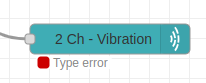
3.- If you connect a different type of NCD sensor, you will see the “Type error message”.
NOTE: Remember, after making any modifications to your Node-RED flow, click the “Deploy” button located in the top right corner of the Node-RED Flow editor. This ensures your changes take effect.
Accessing NCD Dashboard
After successfully configuring and connecting your nodes, the next step is to access the user interface. This is where the NCD Dashboard elements, such as gauges, charts, and buttons, are displayed.
The procedure is as follows:
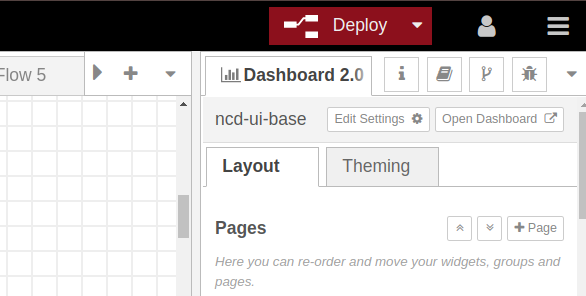
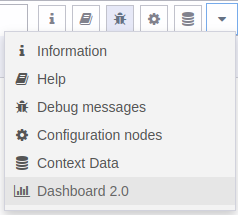
Step 1. Clic on the “Dashboard 2.0” option in the sidebar:
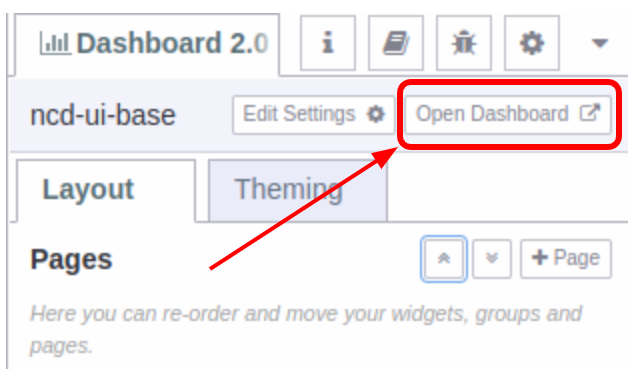
Step 2. Then click on the “Open Dashboard” option:
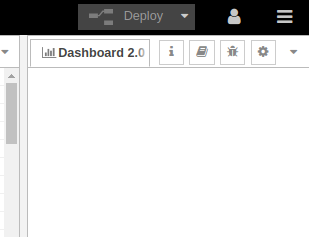
Note: In case you have deployed and cannot see the “Dashboard 2.0” content, you should reload the current page of the web browser with the “F5” key or “Reload page”.
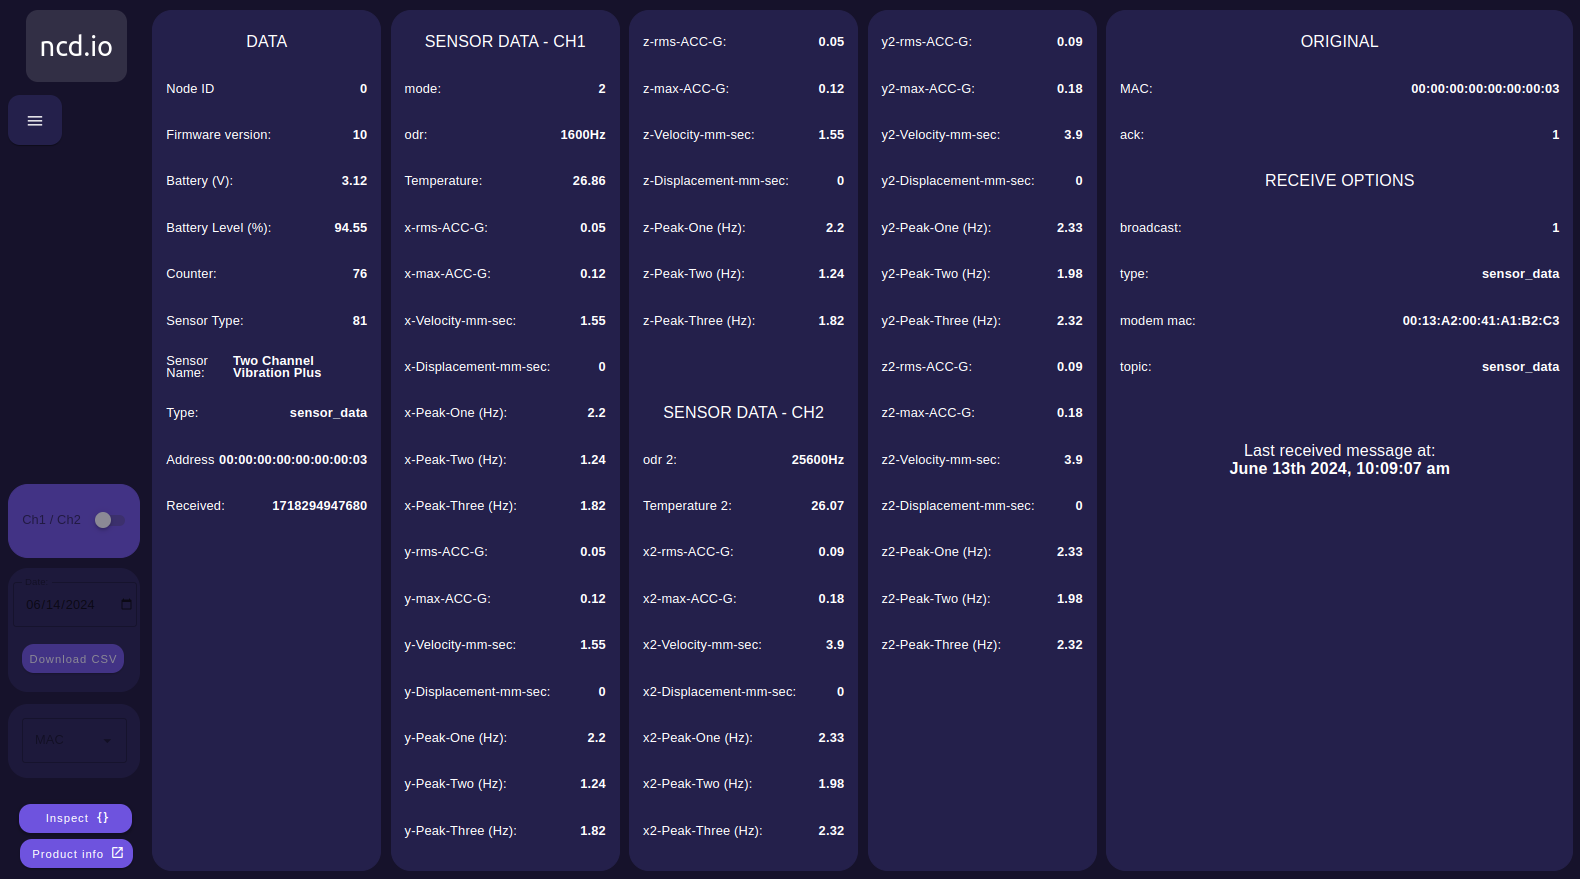
Step 3. Your NCD Dashboard will automatically open in a new window, displaying the following elements:
NCD Dashboard Features
In the next section, we’ll delve into the dashboard elements and their characteristics.
Main Charts
The NCD Dashboard offers insightful charts that track historical vibration data. These charts are configured to display or load the most recent 20 data points, providing a clear picture of vibration trends. Additionally, the charts dynamically update to reflect the latest sensor readings, ensuring you always have access to real-time and historical information.
Channel 1
Channel 2
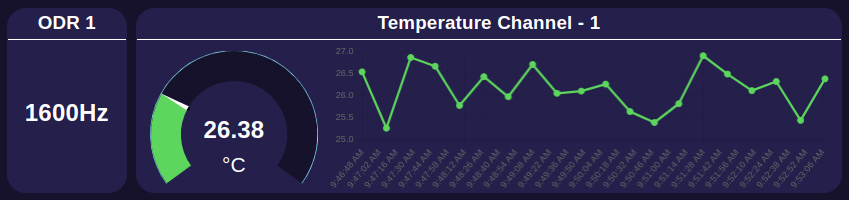
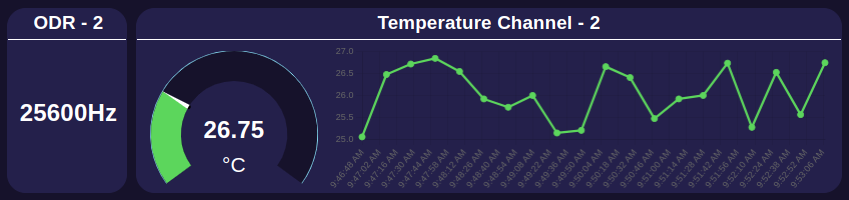
Temperature and ODR Widgets
Indicator displaying the configured ODR parameter and temperature value in real-time, with a chart to show historical Temperature data.
Channel 1
Channel 2
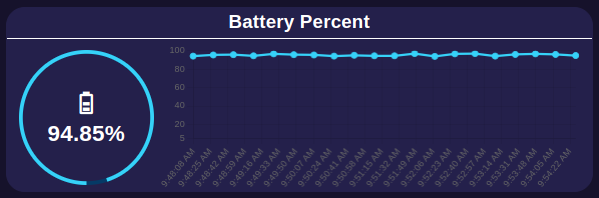
Battery Status
The NCD Dashboard provides a dedicated gauge and chart to visualize both real-time and historical sensor battery levels. This allows you to proactively predict battery replacements, ensuring uninterrupted sensor operation.
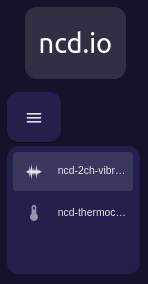
Main Menu
This menu facilitates switching between different NCD-Dashboards within the user interface (UI). This functionality is particularly useful if you have configured multiple NCD Dashboards to monitor various sensors or processes.
Note:For example if you have configured an 2ch-ncd-dashboard and you import an ncd-Thermocouple-dashboard you will be able to navigate between the NCD-Dashboards from the main menu. An example of this process is ilustrated in the following GIF:
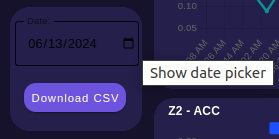
Date Picker & CSV Download
The NCD Dashboard allows you to directly download locally stored CSV files containing historical data from your NCD Sensors through your web browser.
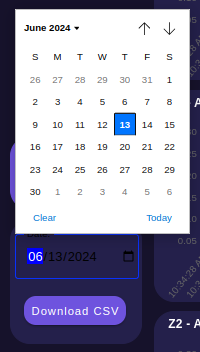
Step 1.- To display the date picker you must click on the icon on the right side of the “Date:” box:
Step 2.- Then select the date of interest:
Locate the download section in the bottom left corner. It features two fields:
Date: Enter the desired date (format: mm/dd/yyyy) to download the corresponding CSV file containing historical sensor data for that specific day.
Download CSV Button: Click this button to initiate the download of the CSV file directly to your web browser.
Date Format:
mm: Represents the month (e.g., 01 for January, 12 for December).
dd: Represents the day of the month (e.g., 01 for the first, 31 for the last day of the month).
yyyy: Represents the four-digit year.
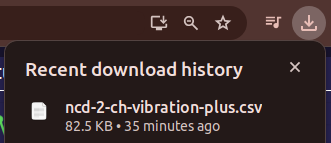
Step 3.- Then click on the “Download CSV” button. If the NCD-Dashboard finds the file for that date, you should be able to see the download begin (indicated by your web browser’s download icon) as shown in image.
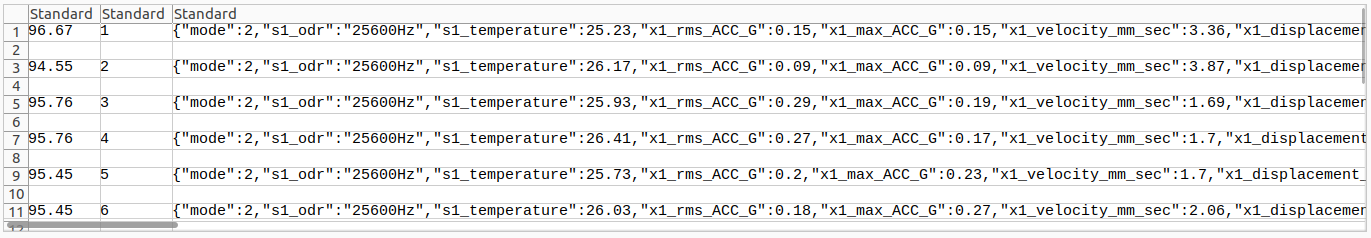
Step 4.- You can open the downloaded CSV file. The content will be similar to the following:
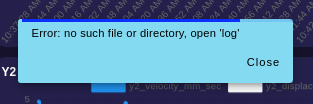
Note: In case you enter a date of interest, which there is no CSV file generated, and press the “Download CSV” button, you will see the following message:
IMPORTANT
CSV file download is currently only available for the default data storage option (local in the path “./node-red”).
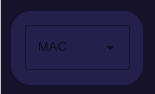
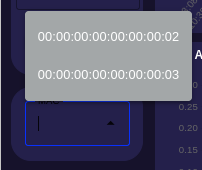
MAC Address Dropdown
The NCD-Dashboard provides a dropdown menu that allows you to select the ncd sensor of interest for loading, displaying, and storing its variables based on its MAC address.
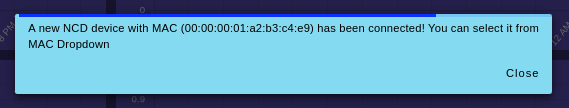
When you connect a new NCD sensor to the NCD-Dashboard node, a pop-up window appears indicating a new device connection. This sensor will automatically be available for selection in the MAC Address dropdown.
An example of this process is shown in the following image:
Inspect
You can access the object data of each sensor using the “Inspect” button on the NCD-Dashboard. Click the button once to view the selected sensor’s inspection window, and click it again to return to the data view.
You can see an example in the following image:
Product Info
The “Product Info” button directs you to information about the corresponding sensor on our website.
Summary
This article unveils the refined and optimized dashboard designed for the NCD Industrial IoT Wireless 2-Channel Vibration & Temperature Sensor V3, a cutting-edge solution for industrial monitoring. The sensor continuously monitors two crucial indicators of equipment health – mechanical vibrations and temperature – acting as a preemptive defense against unexpected malfunctions. By analyzing this essential data, the NCD sensor empowers users to proactively detect potential problems before they snowball into major issues. This forward-thinking approach translates to significant cost savings in maintenance, increased production uptime, and ultimately, a more resilient and streamlined industrial operation.
The article delves deeper into the NCD Vibration & Temperature Dashboard, a user-friendly visual tool that seamlessly integrates with existing Node-RED projects. This dashboard offers real-time and historical data visualization, allowing users to make informed decisions concerning equipment health and maintenance plans.