In many industrial applications, collecting and managing sensor data can be a significant challenge. Traditional data logging solutions often require dedicated hardware, complex software, or external cloud services, which can increase costs and introduce network dependencies. This article introduces a powerful Node-RED flow designed to solve these challenges by transforming an Enterprise IIoT Gateway into a local data logging and management hub. This flow automatically saves sensor data to CSV files directly on the gateway, providing a reliable and accessible local logger. Furthermore, it includes an intuitive dashboard that allows users to easily view, download, and manage these historical data files from any PC on the same network, ensuring you have complete control over your data without relying on external services.
Requirements
To successfully follow and implement the steps outlined in this guide, you will need the following components and software:
A computer equipped with Wi-Fi or Ethernet connectivity to connect to the Enterprise IIoT Gateway and access Node-RED.
Software:
Node-RED: (Pre-installed on the Enterprise IIoT Gateway)
NCD Library: (Pre-installed on the Enterprise IIoT Gateway)
FlowFuse Dashboard 2: This must be installed as per the instructions provided in its documentation.
Install Dashboard
FlowFuse Dashboard 2.0 is an easy to use collection of nodes for Node-RED that allows you to create data-driven Dashboards & data visualizations. Installation procedure is similar to the previous one, FlowFuse’s Node-RED Dashboard 2.0 is also available in the Node-RED Palette Manager.
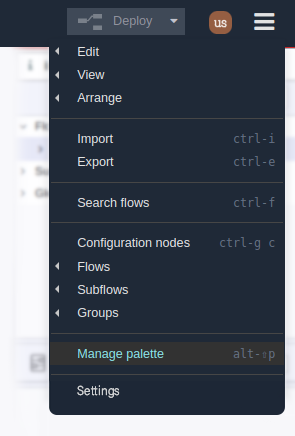
Step 1. Open the menu in the top-right of Node-RED, then Click “Manage Palette”:
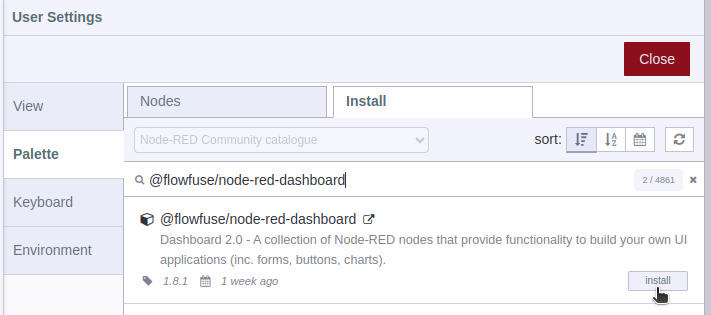
Step 2. Switch to the “Install” tab, Search “@flowfuse/node-red-dashboard”, Install the package:
Click to expand
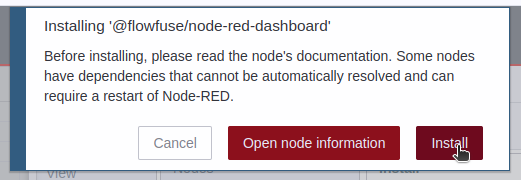
Step 3. You must confirm the installation by clicking on the Install button in the pop-up window.
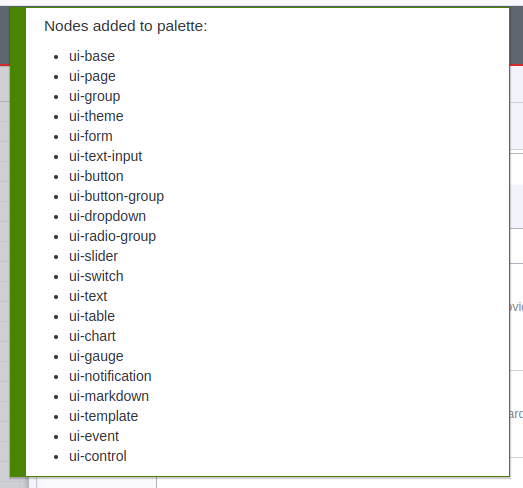
Step 4. You will see a list of the dashboard 2 nodes that have been installed.
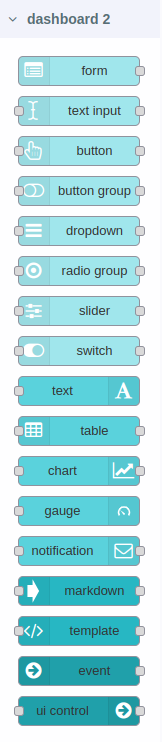
Step 5. In workspace you can see the available nodes in the nodes palette, as shown in the following image:
See the following GIF for a visual demonstration of the installation process:
Click to expand
Importing Flow
Next step is to import the flow, which has been specifically designed and optimized for seamless integration with NCD sensors. The import process is straightforward; however, it is essential to follow these steps carefully:
Step 1. Click on the following link to access the NCD Json Flow source code:
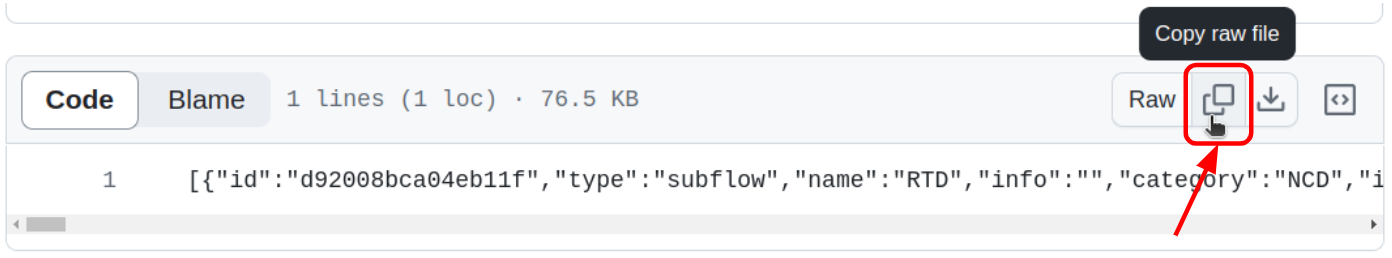
Step 2. Once the repository is open, locate the button that allows you to copy the raw code of the NCD Dashboard. Refer to the following image for a visual reference:
Click to expand
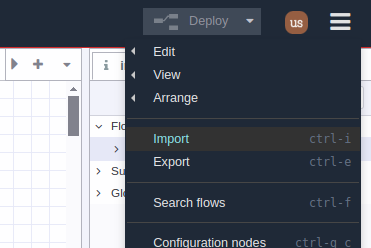
Step 3. Head back to the Node-RED editor and go to the Main Menu (icon in the upper right corner) then click on “Import” option, as shown in picture:
Click to expand
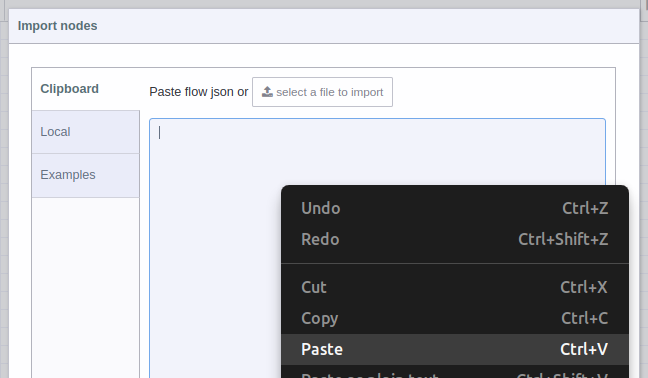
Step 4. A text-box will be opened. Right click and paste the code you just copied from GitHub, as shown in picture:
Click to expand
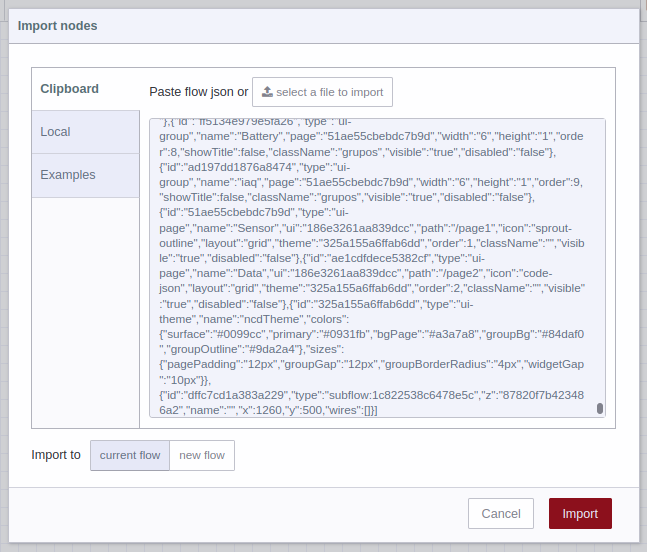
Step 5. You should see the JSON code in text-box, now you can press the red “Import” button at the bottom right (by default the “current flow” option is selected):
Click to expand
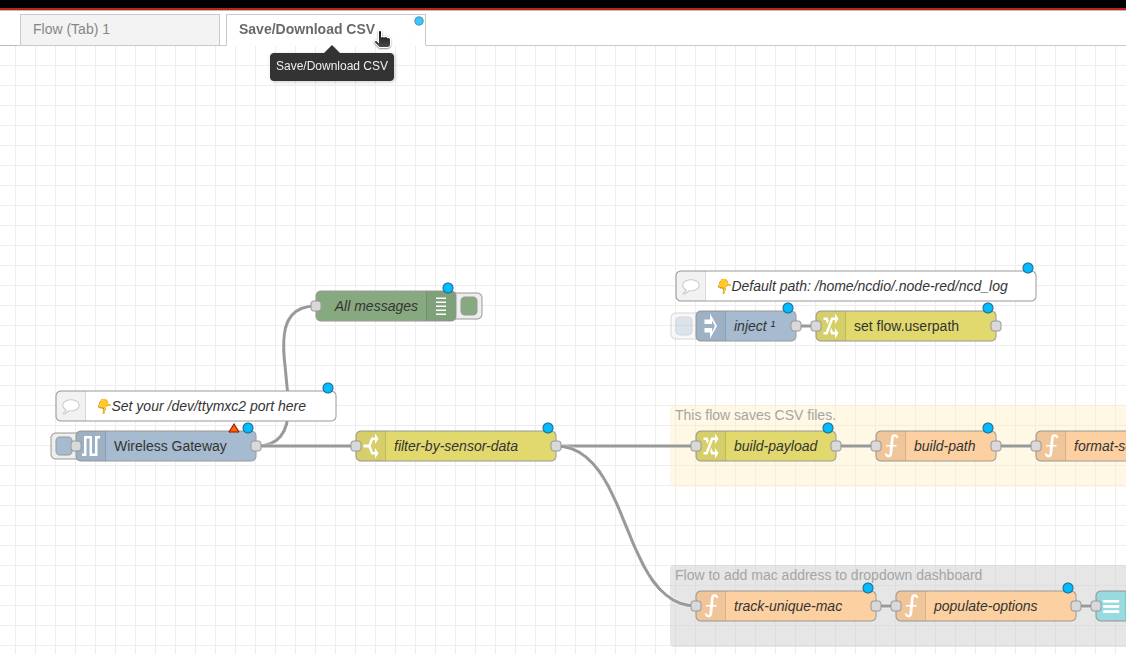
Step 6. A few nodes in the imported flow may already exist in your workspace. You should click ‘Import copy’ to avoid overwriting them. After the import is complete, a new tab will appear in your workspace. Clicking this tab will reveal the dashboard flow.
Click to expand
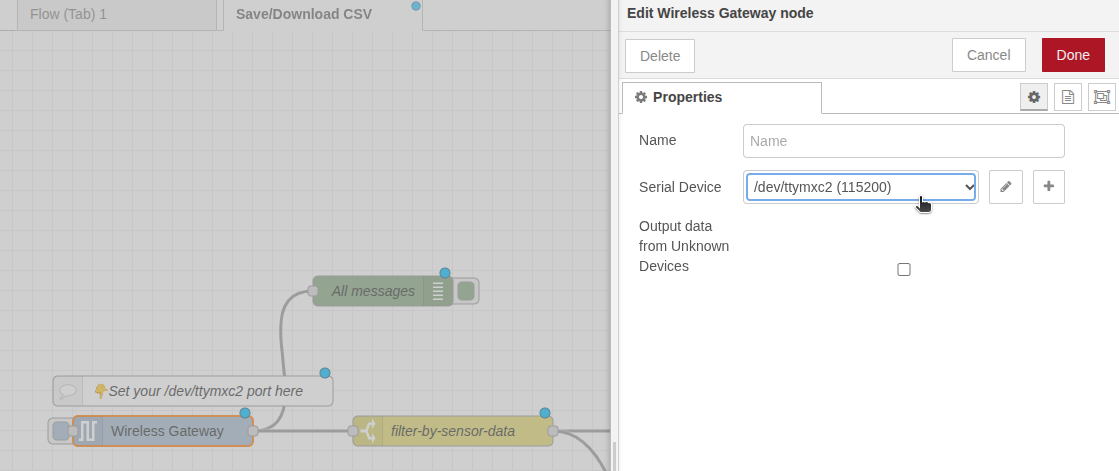
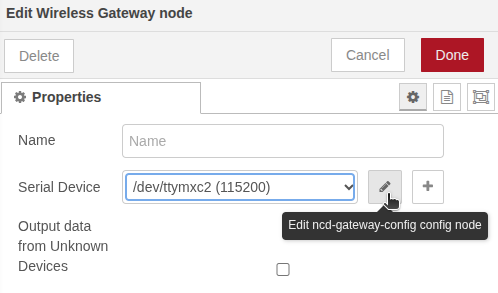
Step 7. To configure the Wireless Gateway node, double-click the Wireless Gateway node within the flow tab. From the dropdown menu, select the appropriate serial port /dev/ttymxc2
Click to expand
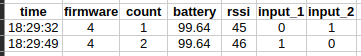
(Optional) To include RSSI values in your data log, you need to edit the gateway’s configuration. Click the pencil icon on the ncd-gateway-config node to open its configuration.
Click to expand
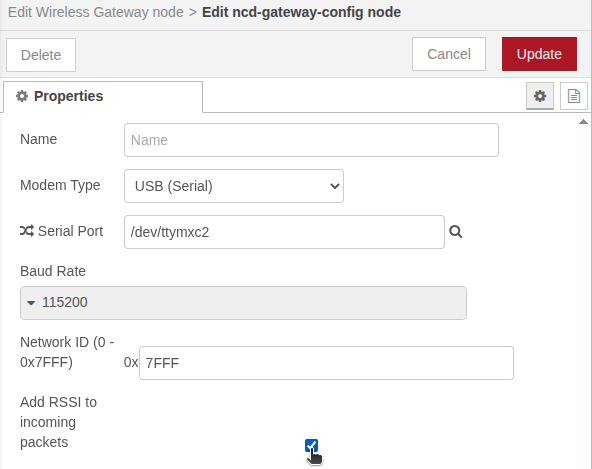
Enable the Add RSSI to incoming packets checkbox.
Click to expand
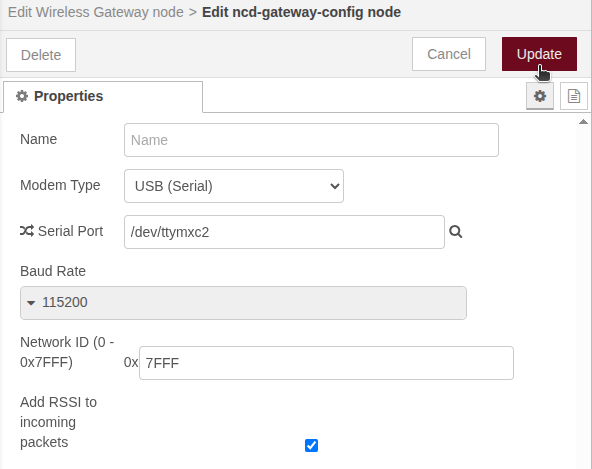
Click Update to save the changes and finally, click Done to close the configuration window.
Click to expand
Step 8. Click on Deploy button in order to save and apply the changes.
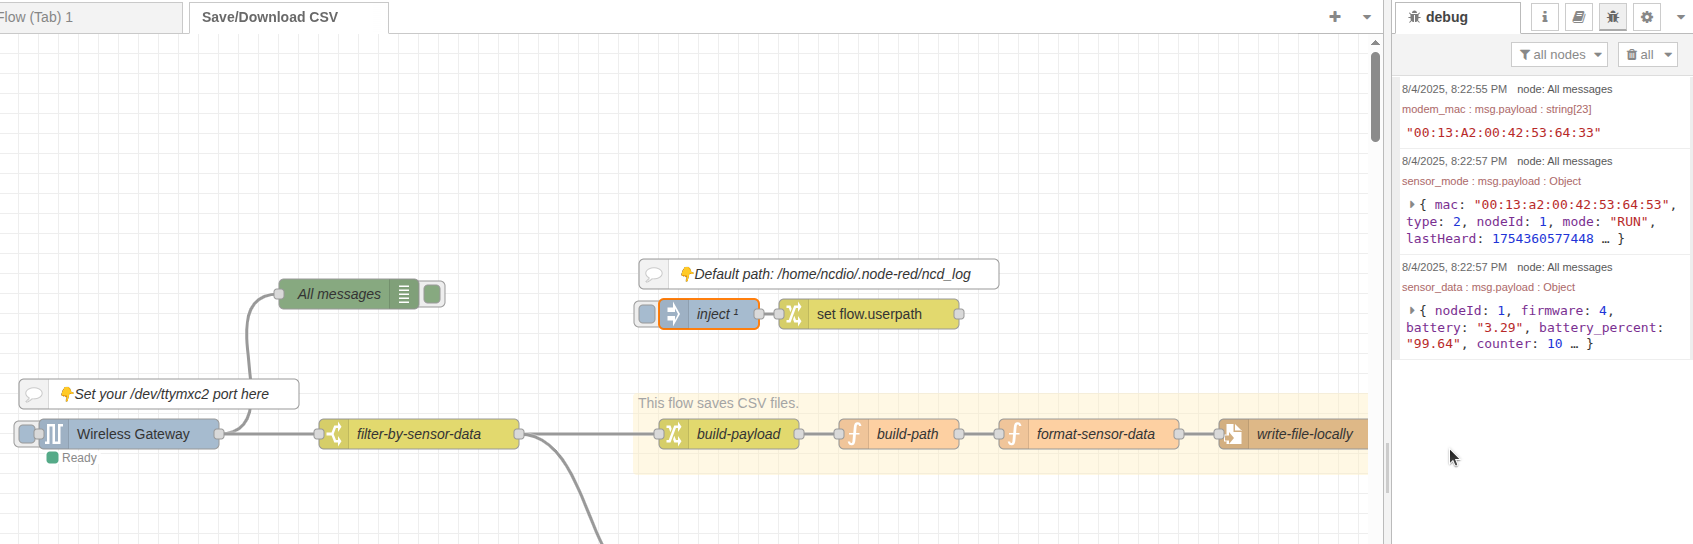
Wait for the next sensor transmission, depending on your sensor’s settings, this could take a few moments or several minutes. You can also manually reset the sensor, this will force it to send new sensor data immediately, which is a good way to test the flow right away.
Click to expand
Accessing Dashboard
After successfully configuring and deploying your nodes, the next step is to access the interface. This is where the NCD Dashboard elements are displayed.
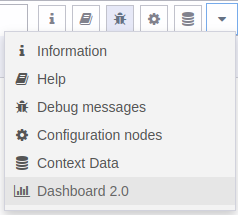
Step 1. Clic on the “Dashboard 2.0” option in the sidebar:
Click to expand
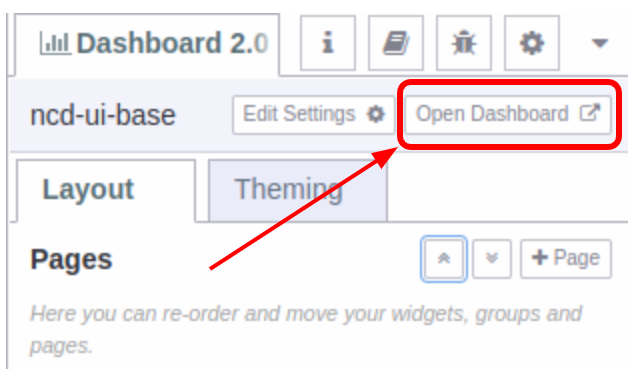
Step 2. Then click on the “Open Dashboard” option:
Click to expand
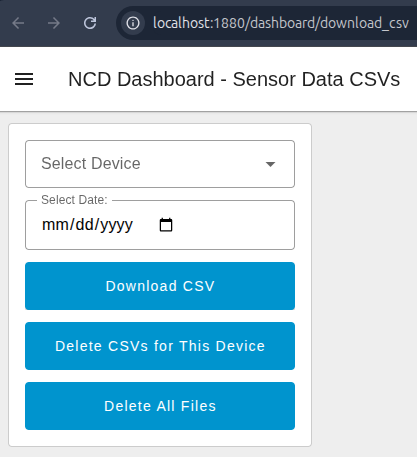
Step 3. Once you open the dashboard, you’ll see several components designed to help you manage your sensor data.
Select Device: This dropdown lists all the MAC addresses of the sensors that have transmitted data since the last deploy. Use this to select the specific sensor whose data you wish to download or manage. If your sensor’s address isn’t listed, it means the flow hasn’t received any data from it yet.
Select Date: This is a date picker widget. Use it to select the specific date of the CSV file you want to download. The flow will look for a CSV file with a timestamp matching the date you choose, so be sure to pick a valid date when the sensor was active.
Download CSV Button: Clicking this button will initiate the download of the selected CSV file. If the file exists, it will be saved to your local PC’s downloads folder. If the file doesn’t exist for the selected device and date, you’ll receive an error message indicating that the file was not found.
Delete CSVs for This Device Button: This button is a powerful tool for managing storage. Clicking it will permanently delete all CSV files associated with the currently selected device. Use this after you’ve downloaded your files to free up memory on the gateway.
Delete All Files Button: This button will delete all CSV files stored on the Enterprise IIoT Gateway, regardless of the device. Use this with caution, as it will erase all historical sensor data.
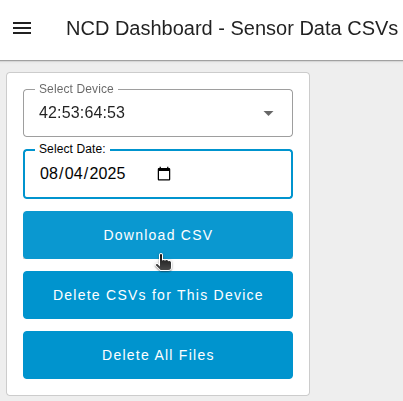
Downloading Your First File
Once your sensor starts transmitting data, its MAC address will appear in the Select Device dropdown. Simply select the device, choose your desired date, and click the Download Button to get the file on your PC.
Important!Each time you download a CSV file, it is automatically removed from the Gateway at the same time. You can easily disable this feature by simply disconnecting the wire that leads to the "delete after download" flow.