Within the Industrial landscape, Mechanical Vibration plays a critical role. It arises when machinery experiences imbalances in moving parts, misalignment issues, bearing wear, and other factors.
To gain valuable insights into the health of your equipment, mechanical vibration analysis focuses on measuring three key variables: Amplitude, Frequency, and Direction. By monitoring these indicators, we can effectively diagnose the root cause of potential problems, allowing for timely interventions and preventative maintenance strategies. This proactive approach helps to minimize the risk of unexpected downtime and costly repairs, ensuring optimal operational efficiency for your industrial processes.
From Misalignment to Breakdown: How Vibration Impacts Motor Health
Let’s consider the case of an Electric Motor. Mechanical vibration can have a domino effect on its internal components. Unbalance, a condition caused by vibration, can disrupt the precise alignment of the motor’s parts. This misalignment often accelerates wear and tear on bearings and seals, ultimately reducing the motor’s performance and lifespan.
Furthermore, excessive Vibration can cause the motor’s rotor to become unbalanced itself. This creates a vicious cycle, generating even more vibration and noise. Consequently, the operating temperatureof the motor increases. If left unaddressed, this escalating scenario can lead to a sudden and costly equipment shutdown.
Industrial IoT Wireless Vibration Temperature Sensor V3
The Industrial IoT Wireless Vibration Temperature Sensor V3 steps onto the scene as your silent guardian. This innovative sensor acts as a sensory outpost, meticulously monitoring two crucial indicators of equipment health: mechanicalvibration and temperature.
By continuously analyzing these vital signs, the ncd sensor empowers you to identify potential problems early on, before they escalate into major issues. This proactive approach translates to significant savings in maintenance costs, increased production uptime, and ultimately, a more robust and efficient industrial operation.
If you want to know more about the features of this sensor, click on the read more button.
ncd-dashboard
This article aims to introduce the main features of our vibration ncd-dashboard and provide instructions on how to set up (import, configuration, and connection) within your Node-RED instance. This solution serves as a visual tool to help you start working with the sensor in an easy and intuitive way.
The next image depicts the ncd Industrial IoT Wireless Vibration Temperature Dashboard Architecture. The sensor(s) collect data of interest from field elements (such as electric motors, pumps, compressors, robotic equipment, conveyors, or transport vehicles, etc.). The signal is then sent wirelessly via Digi-Mesh to the Enterprise IIoT Gateway, where it’s processed by Node-RED and forwarded to the ncd-dashboard 2.0 for management, storage, and intuitive visualization.
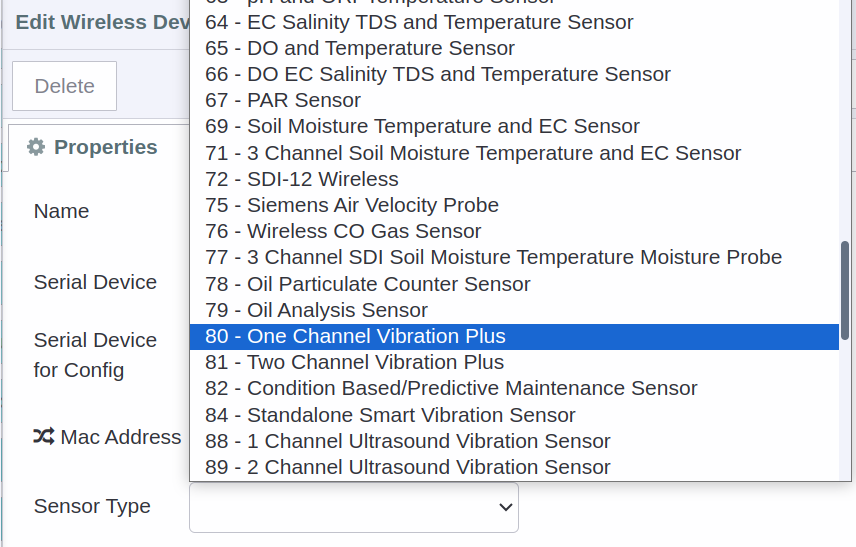
It identifies the MAC Addresses of the devices connected to the node, they are listed in a Dropdown and by selecting the device (MAC) the data is loaded to the Dashboard.
DataLogger
Local storage and CSV file generation (default or user-defined) of sensor data.
Data Loading
Dynamic Loading of Data from Local CSV Files to Charts and Gauges.
CSV Download
Function to download CSV files from web browser by user-defined date.
Inspect
Function to display the raw message coming from the sensor node.
Requierements
To import this ncd-dashboard it is necessary to have previously installed:
Node-RED
@ncd-io/node-red-enterprise-sensors
@flowfuse/node-red-dashboard
Node-RED Instance
Node-RED is a low-code, browser-based tool designed to connect hardware devices, cloud platforms, and database infrastructures. Every ncd-sensor packet creates a message (object) that flows through interconnected nodes. These nodes can modify the message to fit your application needs.
Node-RED offers flexibility for data manipulation and transmission. You can:
Package the message into a protocol like MQTT, Modbus, or OPC-UA.
Send the message directly to your cloud platform (e.g., Azure, AWS, Ubidots, Losant).
Inject it directly into an SQL or NoSQL database.
Seamless Integration with NCD Gateways
Both the Enterprise IIoT Gateway and Enterprise IIoT Gateway Lite come pre-installed with Node-RED running as a service. This allows for immediate utilization of Node-RED’s capabilities for data management within your IIoT infrastructure.
node-red-enterprise-sensors Library
This library handles communication to, and configuration of, the NCD Wireless Sensor Line. It can be used in conjunction with Node-RED to create and manage a Wireless Sensor Network using the Node-RED flow-based development tool on any platform. For specific examples of different sensor types using this package, check out the resources tab of the appropriate product page. If you cannot find an example, or need further assistance, check out the Node-RED section of our forum.
Installing library
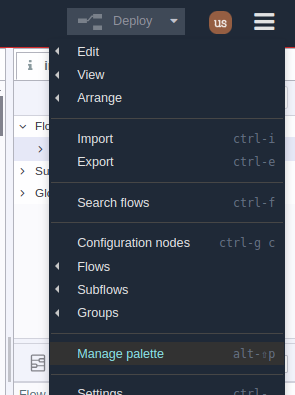
1.- Access Node-RED Instance then go to the main menu (top right) and select the “Manage palette” option:
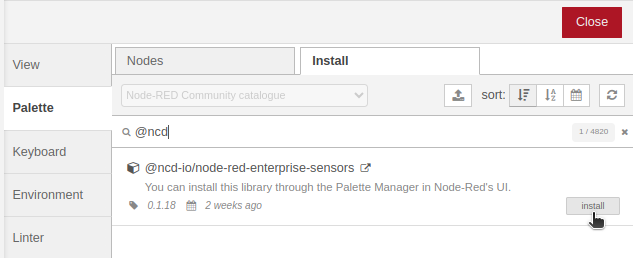
2.- In the next window, select the “Install” tab. In the search box, type “@ncd“. You should then see the “@ncd-io/node-red-enterprise-sensors” library listed. Click the “Install” button.
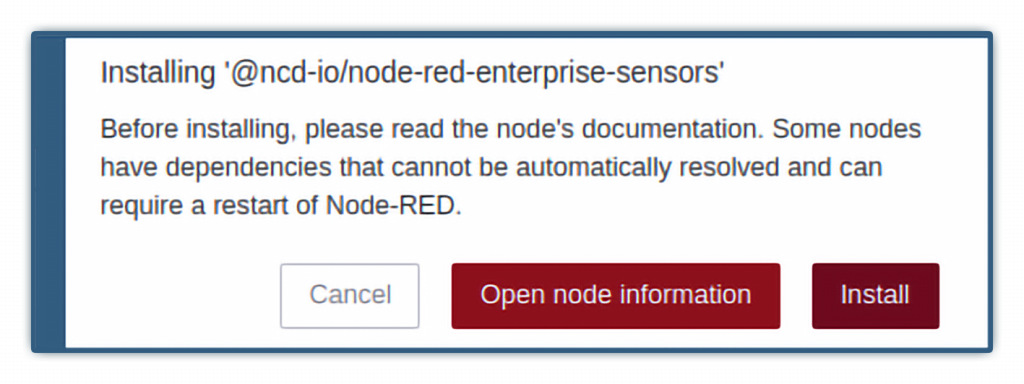
2.1.- A window will appear at the top of the screen, asking you to confirm the installation:
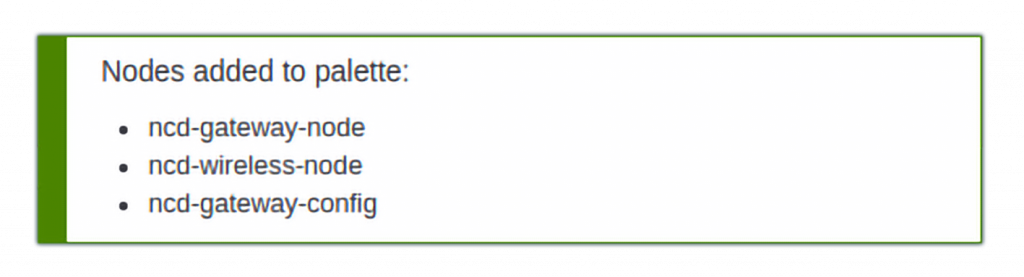
2.2.- Once the process is completed you will see the following window:
FlowFuse Dashboard 2.0
FlowFuse’s Node-RED Dashboard 2.0 is available in the Node-RED Palette Manager. To install it:
Open the menu in the top-right of Node-RED
Click “Manage Palette”
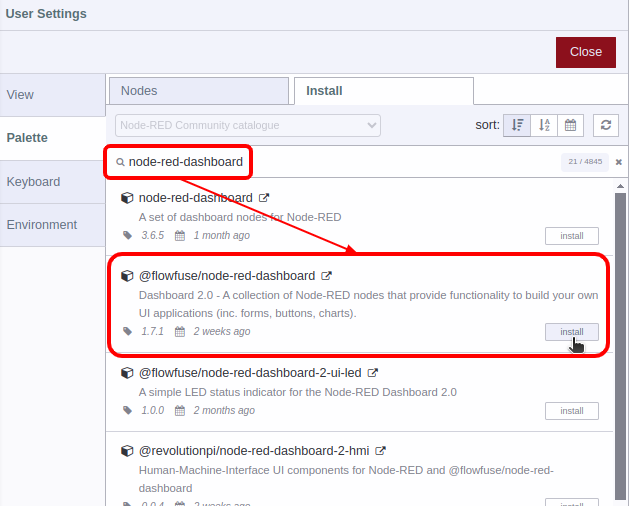
Switch to the “Install” tab
Search node-red-dashboard
Install the @flowfuse/node-red-dashboard package (not node-red/node-red-dashboard)
The nodes will then be available in your editor for you to get started.
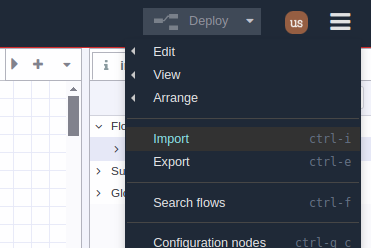
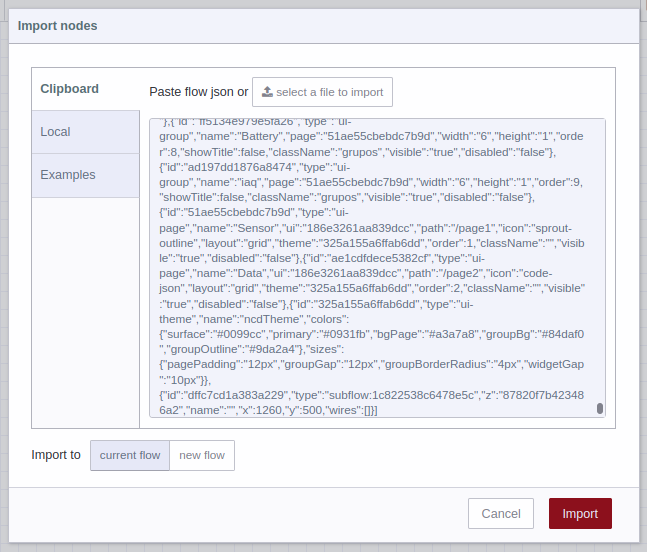
Go to main menu, select “Import” option or use “Ctrl-i” shortcut:
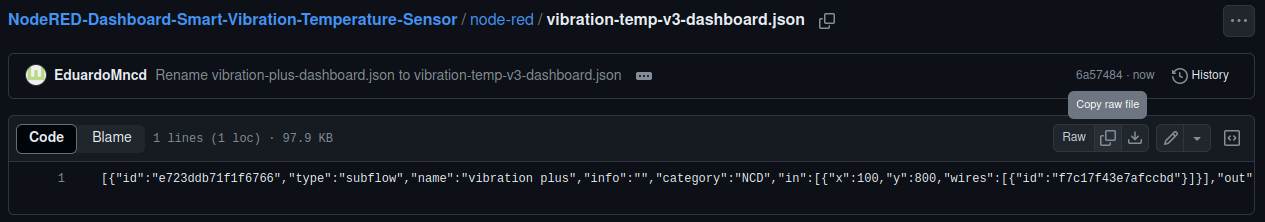
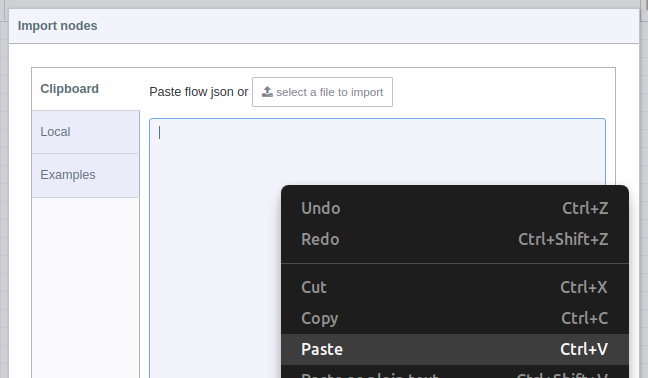
A text-box will be opened. Right click and paste the JSON code you just copied from GitHub:
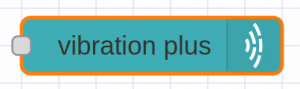
In the top of the Node-RED editor, you will see information of the subflow you just imported, and automatically you will have the subflow (node) available inside the node editor, now you can position it inside the editor or workspace by left clicking:
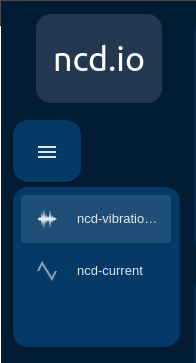
You may also notice that the subflownode has been added to the NCD node group.
Once you have the Smart Industrial IoT Wireless Vibration Temperature Sensor node configured, the next step is to connect the sensor output (node) to the vibration plus (node) input:
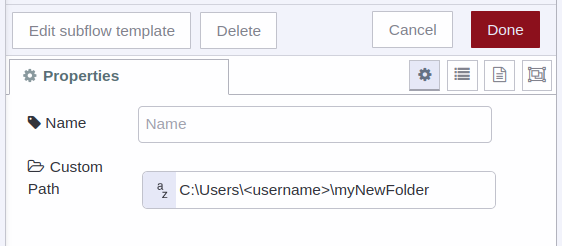
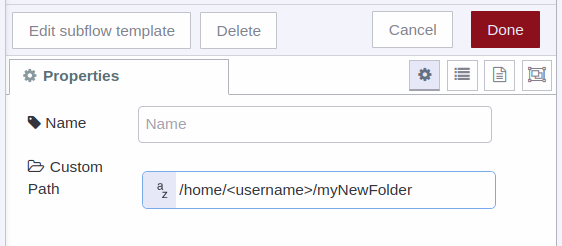
If you double left click on the subflow (current-ncd-dashboard) you can open the settings:
Name: You can assign an identifier to the subflow, and this will only serve to identify your specific flow within the node editor (to differentiate it from other nodes).
Custom Path: This property by default is static, that is, the subflow takes the data coming from your AC Current Monitor Sensor and will store it in a local location inside Node-RED:
Automatically the subflow stores the generated csv files of the sensor(s) inside the Node-RED folder.
Note: So by default it is not necessary to assign a value to this property, but, if for some reason you need the data generated by the sensor to be stored in another local location, then you can assign this property to that new location and the stream will now take that path to store the data:
1) For Linux
2) For Windows
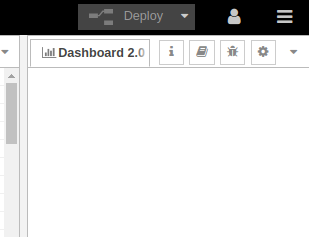
Click on the Deploy button , in order to apply the changes to our flow, it is located at the top right of the Node-RED flow editor:
Node Status
1.- If the path you enter is correct or you leave the default path (leaving the property text field blank), then when new data arrives through the sensor at the subflow input you should be able to see that the data is being stored correctly (Saving data message).
2.- You must be careful to assign a valid route because if the subflow (node) detects that it is not a valid route it will display Path error message.
3.- If you connect other ncd-sensor type, you will see the “Type error message“.
Multiple Inputs
It is possible to connect two or more “Industrial IoT Wireless Vibration Temperature Sensor V3” to the input of this ncd-dashboard node, in order to visualize all the data from a single ncd-dashboard.
When you select any of the devices in the list (in case you have two or more sensors connected to the input of this node) the data from the local csv files will be automatically loaded, and the last 20 values stored in the graphs will be displayed.
Note: The data storage is per day, in order to have a better data management.
Dashboard
The next step is to access your NCD dashboard to view the real-time data coming from the sensor. Click on the “Dashboard 2.0” option in the sidebar.
Then Click on the “Open Dashboard” option:
Note: In case you have deployed and cannot see the “Dashboard 2.0” content, you should reload the current page of the web browser with the “F5” key or “Reload page”.
Your ncd dashboard will automatically open in a new window, displaying the following:
ncd-dashboard
Main Menu
You can navigate between the ui-pages (this menu allows you to navigate between two or more ncd-dashboards, in case you have configured different ncd-dashboards):
Note:For example if you have configured an AC-Current-ncd-dashboard and you import an IIoT-vibration-temperature-ncd-dashboard you will be able to navigate between the ncd-dashboards from the main menu:
Main Charts
The ncd dashboard displays:
RMS 3-axis velocity vibration
Displacement
Maximum g vibration (MAX g)
Peak vibration frequency
Show/Hide Chart Lines
The user can selectively show or hide each line on the chart of interest. This allows you to focus on specific signals as needed. Simply click on the identifier next to the color line, as shown in the image below.
Additional Gauges & Charts
Indicator displaying the configured ODR parameter in real time
Gauge display Real-Time value and Chart displays the historical values of the sensor’s Temperature and dynamically updates based on the selected sensor MAC.
Gauge display Real-Time value and Chart displays the historical values of the sensor’s Battery Percentage and dynamically updates based on the selected sensor MAC.
Date Picker & Download Button
The ncd dashboard allows you to conveniently download the historical data provided by the 3-Axis Smart Vibration Temperature Sensor. These files are stored locally in CSV format and can be downloaded directly from the dashboard.
You can see the box at the bottom left, where we have two fields:
Date: Corresponds to a date entry.
Download CSV button: Activates the download of the corresponding CSV file from the web browser.
Format must be used:
mm: for month.
dd: for day.
yyyy: for year.
Downloading a CSV file from the NCD dashboard is straightforward. Simply follow these steps:
Select a Date: Use the date picker to choose the specific date of interest for the data you want to download.
Verify Device Selection: Ensure the correct device is chosen using the MAC address drop-down menu (this step might be necessary depending on your setup).
Once you’ve selected the date and verified the device, proceed to download the CSV file click on “Download CSV” button.
IMPORTANT
Verify that the date of interest entered corresponds to a valid date, i.e. that the subflow has been storing data (that there is a csv file corresponding to that date).
Here’s an example: If you’ve confirmed that the NCD dashboard has stored data for April 23, 2024, and you want to download the CSV file generated on that specific date, follow these steps:
Note: To display the date picker you must click on the icon on the right side of the “Date:” box.
Then, click on the “Download CSV” button. If the NCD dashboard successfully locates the file for that date, you should see the download begin (indicated by your web browser’s download icon).
Note: In case you enter a date of interest, which there is no CSV file generated, and press the “Download CSV” button, you will see the following message:
IMPORTANT
CSV file download is currently only available for the default data storage option (local in the path “./node-red”).
MAC Address Dropdown
The ncd-dashboard offers a dropdown menu. This menu allows you to select the desired ncd sensor based on its MAC address. Once selected, the dashboard will load, display, and store the sensor’s variables.
When you connect a new NCD sensor (via the Wireless Device node) to the NCD dashboard node input, a pop-up window appears as soon as data is received from the sensor. This window informs you that a new device has been connected and automatically adds it to the MAC Address dropdown menu for easy selection.
See the following image for an example of this process:
When you connect multiple NCD sensors to the NCD dashboard node input, the dashboard can dynamically load the values based on the selected sensor’s MAC address. This allows you to easily switch between sensors and view their data. An example of this process is shown in the following image.
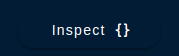
Inspect Button
The NCD dashboard allows you to inspect the detailed data of each sensor. Simply click the “Inspect” button next to the selected sensor. Clicking it again will return you to the data view.
Working With Two or More ncd-dashboards In Same Node-RED Project
These instructions refer to the scenario where you have previously installed and configured an ncd-dashboard and you want to import another ncd-dashboard to the same project.
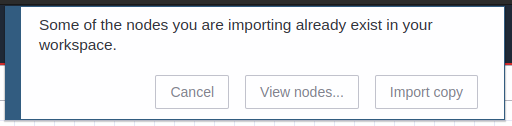
The procedure to import the new dashboard to the current project is the same as mentioned above, with the simple difference that as soon as you press the import button in the “Import nodes” window, you will see a message indicating that you are importing existing nodes. Click the ‘Import copy‘ button to proceed.
After connecting the nodes correctly, you will be able to navigate between the dashboards from the main menu as shown in the following example image:
Summary
This article introduces the customized and optimized dashboard for the ncd Industrial IoT Wireless Vibration Temperature Sensor V3, a novel industrial monitoring solution. The sensor continuously tracks two critical equipment health indicators – mechanical vibration and temperature – acting as a preventative safeguard against unforeseen malfunctions. By analyzing this vital data, the ncd sensor empowers users to proactively identify potential problems before they escalate into major issues. This proactive approach translates to significant cost savings in maintenance, increased production uptime, and ultimately, a more robust and efficient industrial operation. The article further details the ncd Smart Vibration Temperature Dashboard, a user-friendly visual tool that seamlessly integrates with existing Node-RED projects. This dashboard provides real-time and historical data visualization, enabling users to make informed decisions regarding equipment health and maintenance strategies.