Absolute and gauge pressure continuous measurement provides safe measurement of liquids and gases in various applications. The pressure is measured relative to a complete vacuum with absolute pressure sensors.
This means the measurements are not influenced by atmospheric pressure variations like air or altitude changes. These devices are commonly found in applications requiring the monitoring of Industrial performance-driven vacuum pumps. For instance, in the food industry, vacuum packing is used to prevent oxygen from degrading perishable foods, thus extending their shelf life and preserving their flavor.
NCD’s Industrial Wireless Pressure and Temperature Sensor boasts exceptional features for remote monitoring. This Industrial-Grade sensor transmits accurate pressure and temperature data over a 2-mile range using wireless mesh networking. With a long battery life of up to 10 years and compatibility with various liquid pressure measurements, it excels in diverse applications. Its affordability and superior accuracy make it a powerful choice exceeding most industrial and consumer market requirements.
• Operating Range 0 to 10,000psi, -40°C to +85°C (-40°F to 185°F) • Industry Standard 1/4 inch NPT Male Connector • Accuracy ±0.5%FS (pressure) ±1.5℃ (Temperature) • Sampling Frequency 1.5ms • Long Term Stability: ±0.3%FS/year • Compatible Media – Gas, Liquid or Vapor • 2 Mile Range with On-Board Antenna • IP65 Rated Enclosure • Improved reliability incorporating Retry feature in case of packet loss • Real Time Battery Status
If you want to know all the features and applications of this sensor you can click on the “See more” button.
This post pretends to introduce the main features of our pressure & temperature NCD-Dashboard and offer the instructions to setup this dashboard (import, config and connect) to your Node-RED Instance, this solution pretends to offer a visual tool to start working with the sensor in an easy and intuitive way.
Architecture
The next image is a visual representation of the ncd Absolute & Gauge Pressure – Temperature Dashboard Architecture. The sensor(s) collect the data of interest from the field elements, and then send the signal via Digi-Mesh to the Enterprise IIoT Gateway, where it is processed by Node-RED and then sent to the NCD-Dashboard for storage and intuitive visualization.
Dashboard Features
▪️Real-Time Data Display
Real-time display of the variables emitted by the sensor:
Absolute & Gauge Pressure.
Temperature (°C/°F).
Battery Percent.
▪️Historical Data Display
Historical data visualization of the values of the variables emitted by the sensor:
Absolute & Gauge Pressure.
Temperature (°C/°F).
Battery Percent.
▪️Unit Selector (Temperature)
Button to select the unit of measurement for the temperature variable (Celcious/Fahrenheit).
It identifies the MAC Addresses of the devices connected to the node, they are listed in a Dropdown and by selecting the device (MAC) the data is loaded to the Dashboard.
▪️Data Inspection (Object)
Function to inspect from the dashboard the objectdata coming from the sensor(s).
▪️Local Datalogger
Generation and storage in local (or user-defined) path of CSV file with data from the sensor(s).
▪️Dynamic Data Loading
Dynamic loading of data to graphs and gauges from local CSV files.
▪️CSV Download
Function to download CSV files from web browser by user-defined date.
IMPORTANT
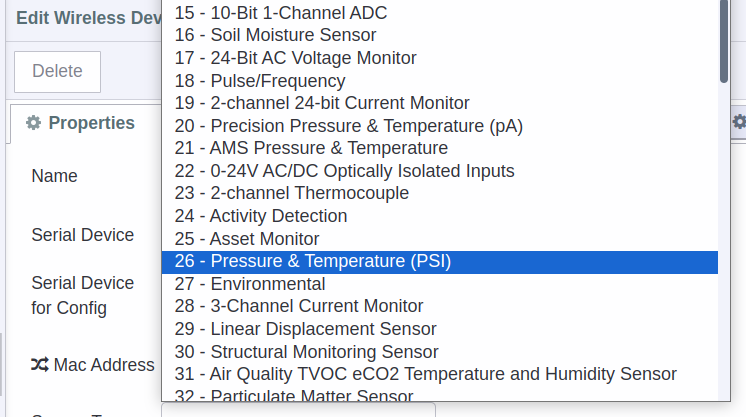
This NCD-Dashboard is designed to work exclusively with 26 type, which correspond to Industrial Wireless Absolute & Gauge Pressure Sensor With 1/4 NPT.
Requirements
To import this NCD-Dashboard it is necessary to have previously installed:
Node-RED
NCD Library.
FlowFuse Dashboard 2
Node-RED Instance
Node-RED is a programming tool for wiring together hardware devices, APIs and online services, created by IBM’s Emerging Technology Services group. Contrary to what it may seem, it is quite simple to use software.
Every ncd-sensor packet creates a message (object) which flows down the connected nodes which can alter that message to suit your application, package it into a new protocol such as MQTT, Modbus or OPC-UA, or send it directly to your Cloud (Azure, AWS, Ubidots, Losant, direct injection into an SQL or NoSQL database, IgnitionSCADA and many other options).
Node-Red is pre-installed and running as a service in Enterprise IIoT Gatewayand Enterprise IIoT Gateway Lite. Here you can find a complete getting started guide for accessing Node-RED from the Enterprise IIoT Gateway:
This library handles communication to, and configuration of, the NCD Wireless Sensor Line. It can be used in conjunction with Node-RED to create and manage a Wireless Sensor Network using the Node-RED flow-based development tool on any platform.
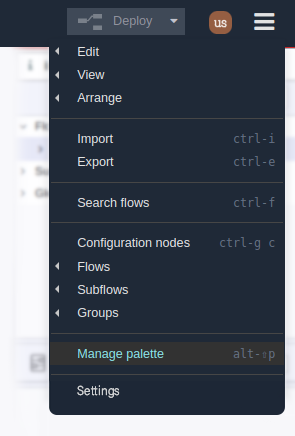
1.- To install this library, the first thing to do is to access Node-RED which runs as a service on the Enterprise IIoT Gateway. Then, inside the Node-RED flow editor you must go to the main menu (top right) and select the “Manage Palette” Option as shown in the following Image:
2.- The “User Settings” window will be displayed, inside “Palette” you must select click on the “Install” tab.
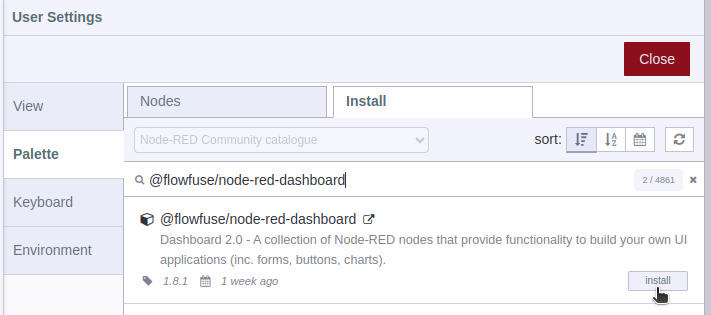
3.- In Search Field enter “@ncd-io/node-red-enterprise-sensors”, you will see the following:
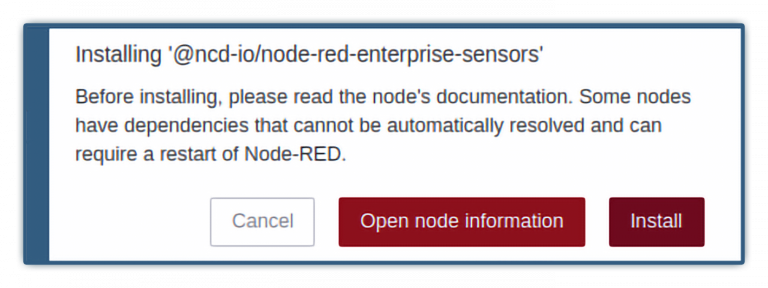
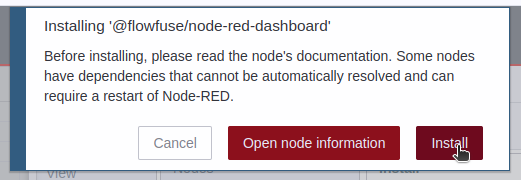
4.- Click the “Install” button to start the installation process, a window will appear at the top of the screen, asking you to confirm the installation:
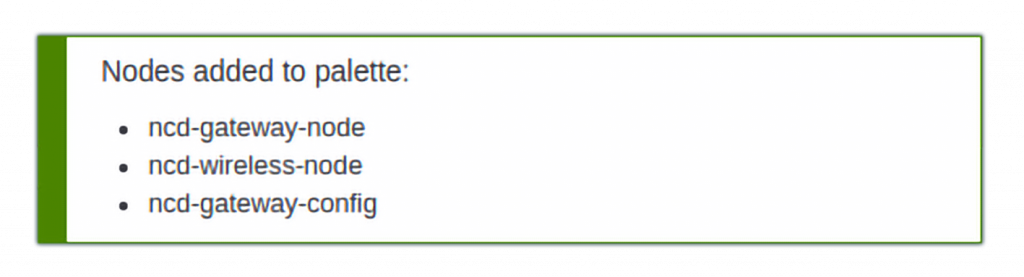
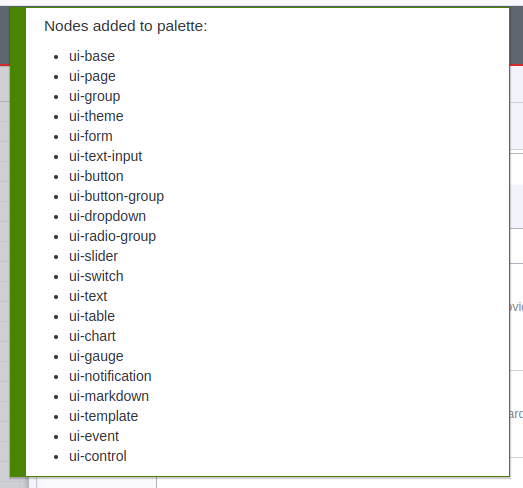
5.- Once the process is completed you will see the following window:
Note: you can find the Enterprise Sensor Library Documentation here:
An easy to use collection of nodes for Node-RED that allows you to create data-driven dashboards & data visualisations. Installation procedure is similar to the previous one, FlowFuse’s Node-RED Dashboard 2.0 is also available in the Node-RED Palette Manager.
Go to the Dashboard repository in the following link, once opened, select the button to copy the RAW code of the dashboar, as shown in the following image:
(Optional) – You could add a new flow in the node editor of Node-RED, click on Add Flow icon, upper right corner of the workspace.
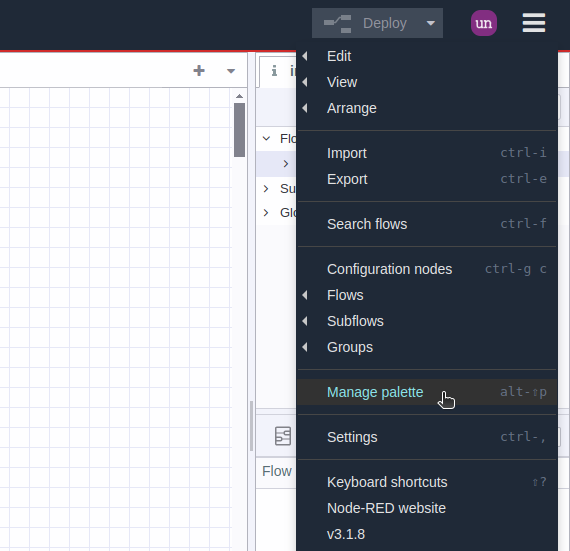
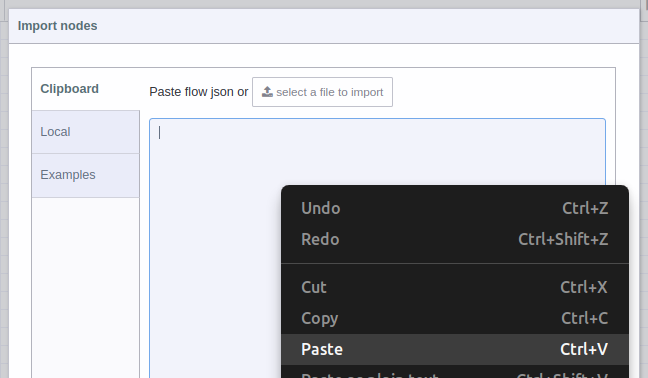
1.- Go to the Main Menu (amburger icon in the upper right corner) then click on “Import” option, as shown in picture.
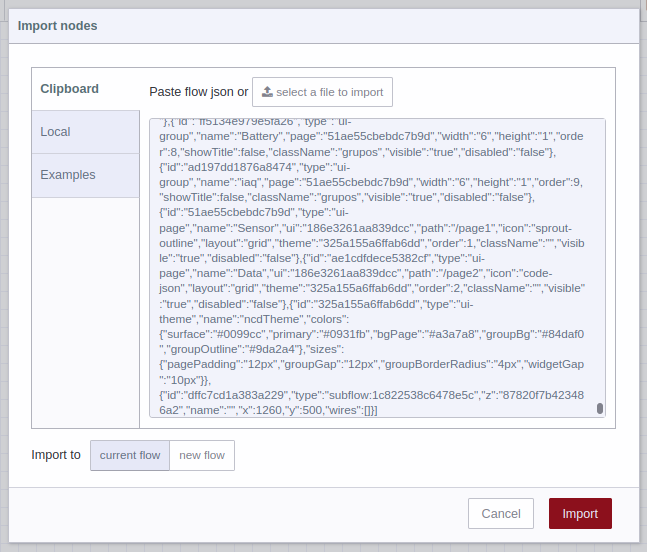
2.- A text-box will be opened. Right click and paste the JSON code you just copied from GitHub, as shown in picture:
3.- You should see the JSON code in text-box, now you can press the red “Import” button at the bottom right (by default the “current flow” option is selected):
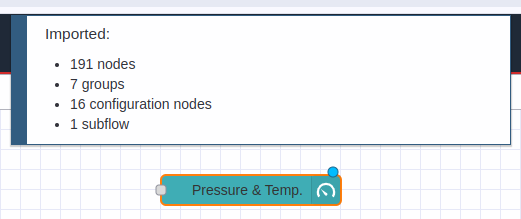
4.- In the top of the Node-RED editor, you will see information of the NCD-Dashboard you just imported, and automatically you will have the node available inside the node editor, now you can position it inside the editor or workspace by left clicking:
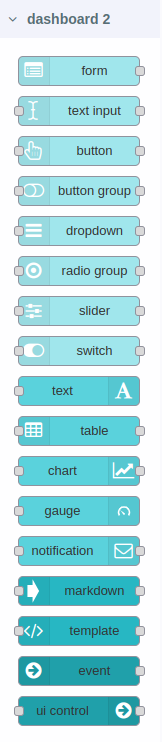
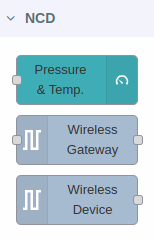
5.- You may also notice that the NCD-Dashboardnode has been added to the NCD node group in nodes palette.
NCD node Configuration
The next step is to configure your ncd nodes (you may have already configured your nodes), but it is important to remember that this NCD-Dashboard only works for the Industrial Wireless Absolute & Gauge Pressure Sensor With 1/4 NPT type:
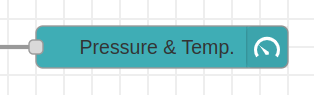
Once you have the Industrial Wireless Absolute & Gauge Pressure Sensor (with 1/4 NPT) node configured, the next step is to connect the sensor output (node) to the NCD-Dashboard node input:
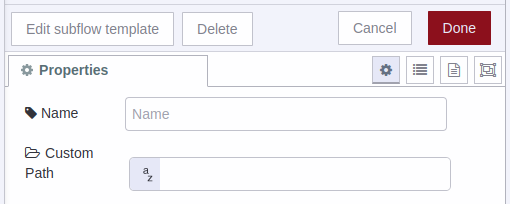
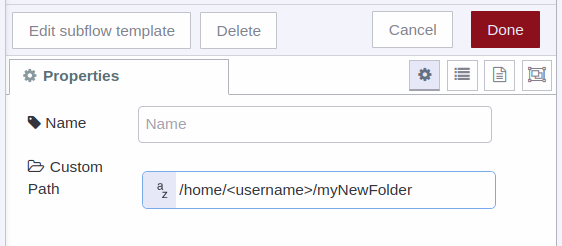
If you double left click on the dashboard node (Pressure & Temp) you can open the Properties.
Name: You can assign an identifier to the NCD-Dashboard node. This name only helps distinguish your specific node within the node editor (from other nodes).
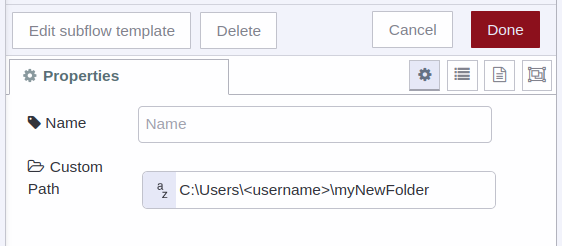
Custom Path: By default, this property is set to a fixed location. The NCD-Dashboard retrieves data from your sensor and stores it locally within Node-RED.
Data Storage: The NCD-Dashboard automatically saves the generated CSV files from the sensor(s) within the Node-RED folder.
Note: By default, it is not necessary to assign a value to this property. However, if you need the sensor data stored in another local location, you can assign this property to that new location. The NCD-Dashboard will then use that path to store the data.
Click on the Deploy button, located in the top right corner of the Node-RED flow editor, to apply the changes to your flow
Node Status
1.- If the path you enter is correct, or if you leave the property field blank (using the default path), you should see a “Saving data” status when new sensor data arrives at the node input, indicating successful storage.
2.- It’s important to assign a valid route. If the NCD-Dashboard detects an invalid route, it will display a “Path error” message:
3.- If you connect a different type of NCD sensor, you will see the “Type error message.”
Check Dashboard
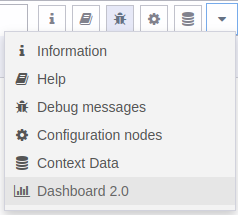
1.- The next step is to go to your NCD-Dashboard to see the real-time data coming from the sensor by clicking on the “Dashboard 2.0” option in the sidebar:
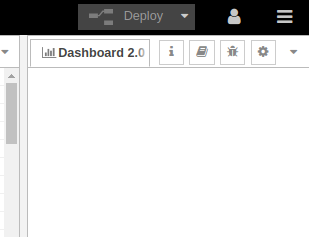
2.- Then click on the “Open Dashboard” option:
Note: In case you have deployed and cannot see the “Dashboard 2.0” content, you should reload the current page of the web browser with the “F5” key or “Reload page”.
3.- Your NCD-Dashboard will automatically open in a new window, where you can see the following:
NCD Dashboard
Gauges
Gauge indicating the pressure value in PSI, accompanied by a numerical display at the bottom for the specific value (Range: 0 – 10000 PSI).
Gauge indicating battery percentage, accompanied by a numerical display at the middle for the specific value (Range: 0 – 100%).
Dynamic Gauge indicating Temperature value in °C and °F, accompanied by a button to switch between units (Range: -40°C to +85°C / -40°F to +185°F ).
The following image illustrates the above concept.
Charts
Chart Displaying the Last 20 Historical Pressure Readings (PSI)
Dynamic Chart Displaying the Last 20 Historical Temperature Readings (°C)
Dynamic Chart Displaying the Last 20 Historical Temperature Readings (°F)
Chart Displaying the Last 20 Historical Battery Percentage Readings (%)
Main menu
You can navigate between the ui-pages (this menu allows you to navigate between two or more NCD-Dashboards, in case you have configured different NCD-Dashboards).
Note:For example if you have configured an Pressure&Temp-ncd-dashboard and you import an ncd-Ultrasound-Vibration-ncd-dashboard you will be able to navigate between the NCD-Dashboards from the main menu:
Date Picker & Download CSV
You can directly download the locally stored CSV files containing historical data from the Industrial Wireless Absolute & Gauge Pressure Sensor(s) through your web browser using the NCD Dashboard.
You can see the box at the bottom left, where we have two fields:
Date: Corresponds to a date entry.
Download CSV button: Activates the download of the corresponding CSV file from the web browser.
Format must be used:
mm: for month.
dd: for day.
yyyy: for year.
To download a CSV file from the NCD-Dashboard, the first thing to do is to select or enter a date of interest using the date picker, i.e. (with the current device selected using the MAC drop-down) the date of the stored data you are interested in downloading.
IMPORTANT
Verify that the date of interest entered corresponds to a valid date, i.e. that the subflow has been storing data (that there is a csv file corresponding to that date).
For example, assuming you have verified that the NCD-Dashboard has been storing data on the date “May 6, 2024”, and you need to download the CSV file generated on that date, then you would enter:
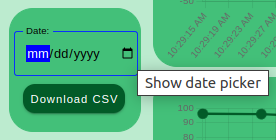
1.- To display the date picker you must click on the icon on the right side of the “Date:” box:
2.- Then select the date of interest:
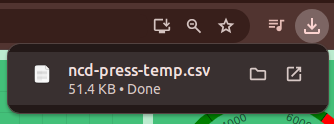
3.- Then click on the “Download CSV” button. If the NCD-Dashboard finds the file for that date, you should be able to see the download begin (indicated by your web browser’s download icon) as shown in the following image:
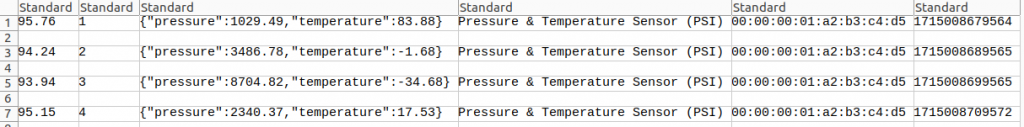
4.- You can open the downloaded CSV file. The content will be similar to the following:
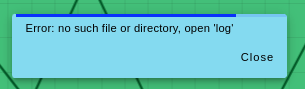
Note: In case you enter a date of interest, which there is no CSV file generated, and press the “Download CSV” button, you will see the following message:
IMPORTANT
CSV file download is currently only available for the default data storage option (local in the path “./node-red”).
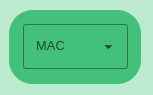
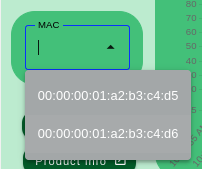
MAC Address Dropdown
The NCD-Dashboard provides a dropdown menu that allows you to select the ncd sensor of interest for loading, displaying, and storing its variables based on its MAC address.
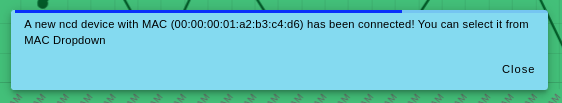
When you connect a new NCD sensor to the NCD-Dashboard node, a pop-up window appears indicating a new device connection. This sensor will automatically be available for selection in the MAC Address dropdown.
An example of this process is shown in the following image:
Inspect
You can access the object data of each sensor using the “Inspect” button on the NCD-Dashboard. Click the button once to view the selected sensor’s inspection window, and click it again to return to the data view.
You can see an example in the following image:
Product Info
The “Product Info” button directs you to information about the corresponding sensor on our website.”
Summary
Automated and remote monitoring of absolute and gauge pressure in industrial equipment presents a significant opportunity to streamline maintenance schedules across various industries.
Our pressure sensors fulfill the aforementioned requirements and features, offering a comprehensive solution that’s free of monthly fees, customizable, and ready for deployment.
Our development philosophy for these dashboards prioritizes user-friendliness. We achieve this through the versatility of Node-RED. While we leverage some core JavaScript functions, we strive to build the workflow using more user-friendly nodes, allowing you to effortlessly modify or personalize the dashboard.