

Site Survey User Guide
Commission a gateway on site: every sensor’s mesh link, and the radio noise it competes with, in one list.
01Overview
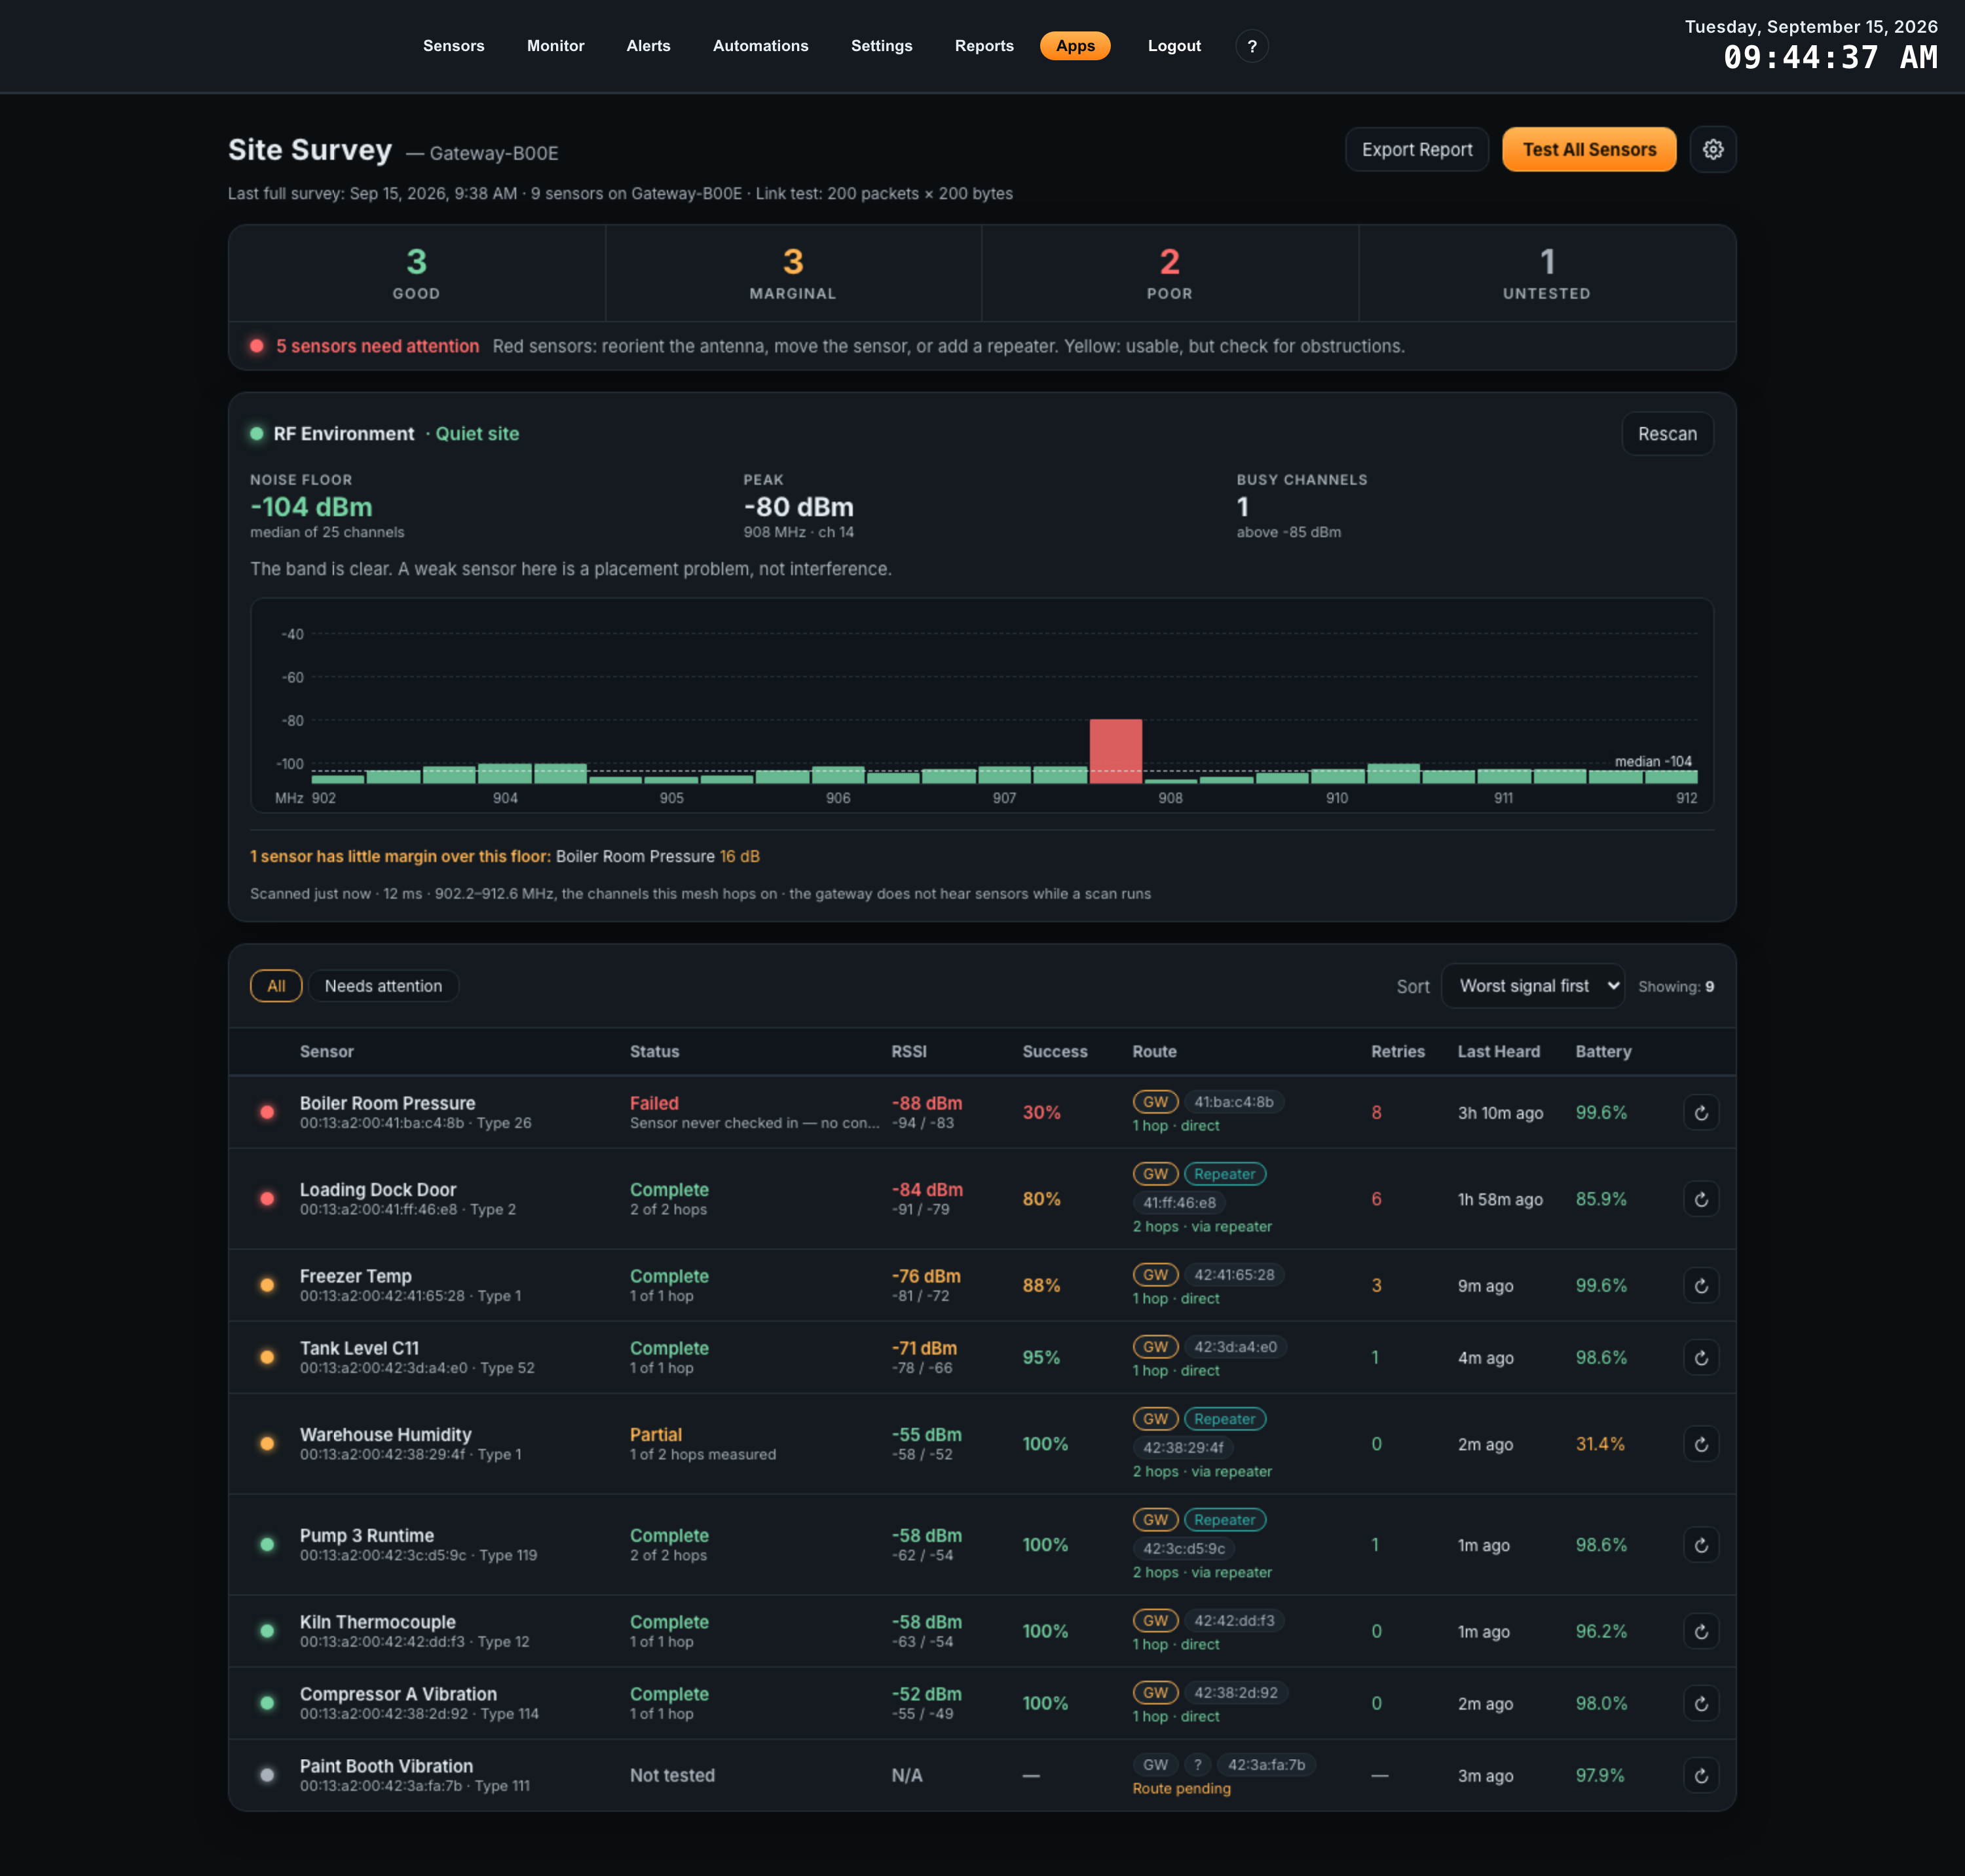
Site Survey answers one question for an installer standing in a building: is this installation finished, and if not, which sensors need attention?
Checking mesh connectivity without it means visiting each sensor in turn — open its dashboard, view its map, refresh the mesh map, read the numbers, go back, repeat. On a twenty-sensor site that is twenty round trips, and nothing compares one sensor against another.
Site Survey puts every whitelisted sensor in a single list, colour-coded green, yellow or red against thresholds you control. One button tests all of them. When the whole list is green, the installation is done. Red rows tell you which sensors need the antenna reoriented, the sensor moved, or a repeater added.
02Requirements
What the app needs before it will do anything useful.
| Requirement | Detail |
|---|---|
| Atrium platform | 2.6.0 or newer. The Apps page refuses to install on anything older. |
| Gateway model | Any Atrium gateway. |
| Sensors | Any NCD wireless sensor the gateway has whitelisted. Non-whitelisted devices are not listed and cannot be tested. |
| License | None. The app is free. |
| Browser | Tablet or laptop, about 900 px wide or more. Narrower screens scroll the list sideways rather than compressing the columns. |
What the gateway must provide
Two platform services do the radio work. Both arrive with Atrium 2.6.0:
- Mesh testing — runs the route trace and link test behind Test All Sensors and the per-row retest button.
- Radio scanning — runs the noise-floor sweep behind Scan Noise Floor.
Where a gateway does not offer one of these, the app hides or disables that feature and everything else keeps working. You do not need to uninstall anything.
03Installing
Site Survey installs like any other Atrium app.
-
1
Open the Apps pageLog in to the gateway dashboard and select Apps in the top navigation.
-
2
Install Site SurveyFind Site Survey in the App Center and install it. If you were sent a package file instead, use the upload control on the same page.
-
3
Wait for the gateway to reloadInstalling an app restarts the gateway’s services. This takes a few seconds and interrupts nothing permanently; the page reconnects on its own.
-
4
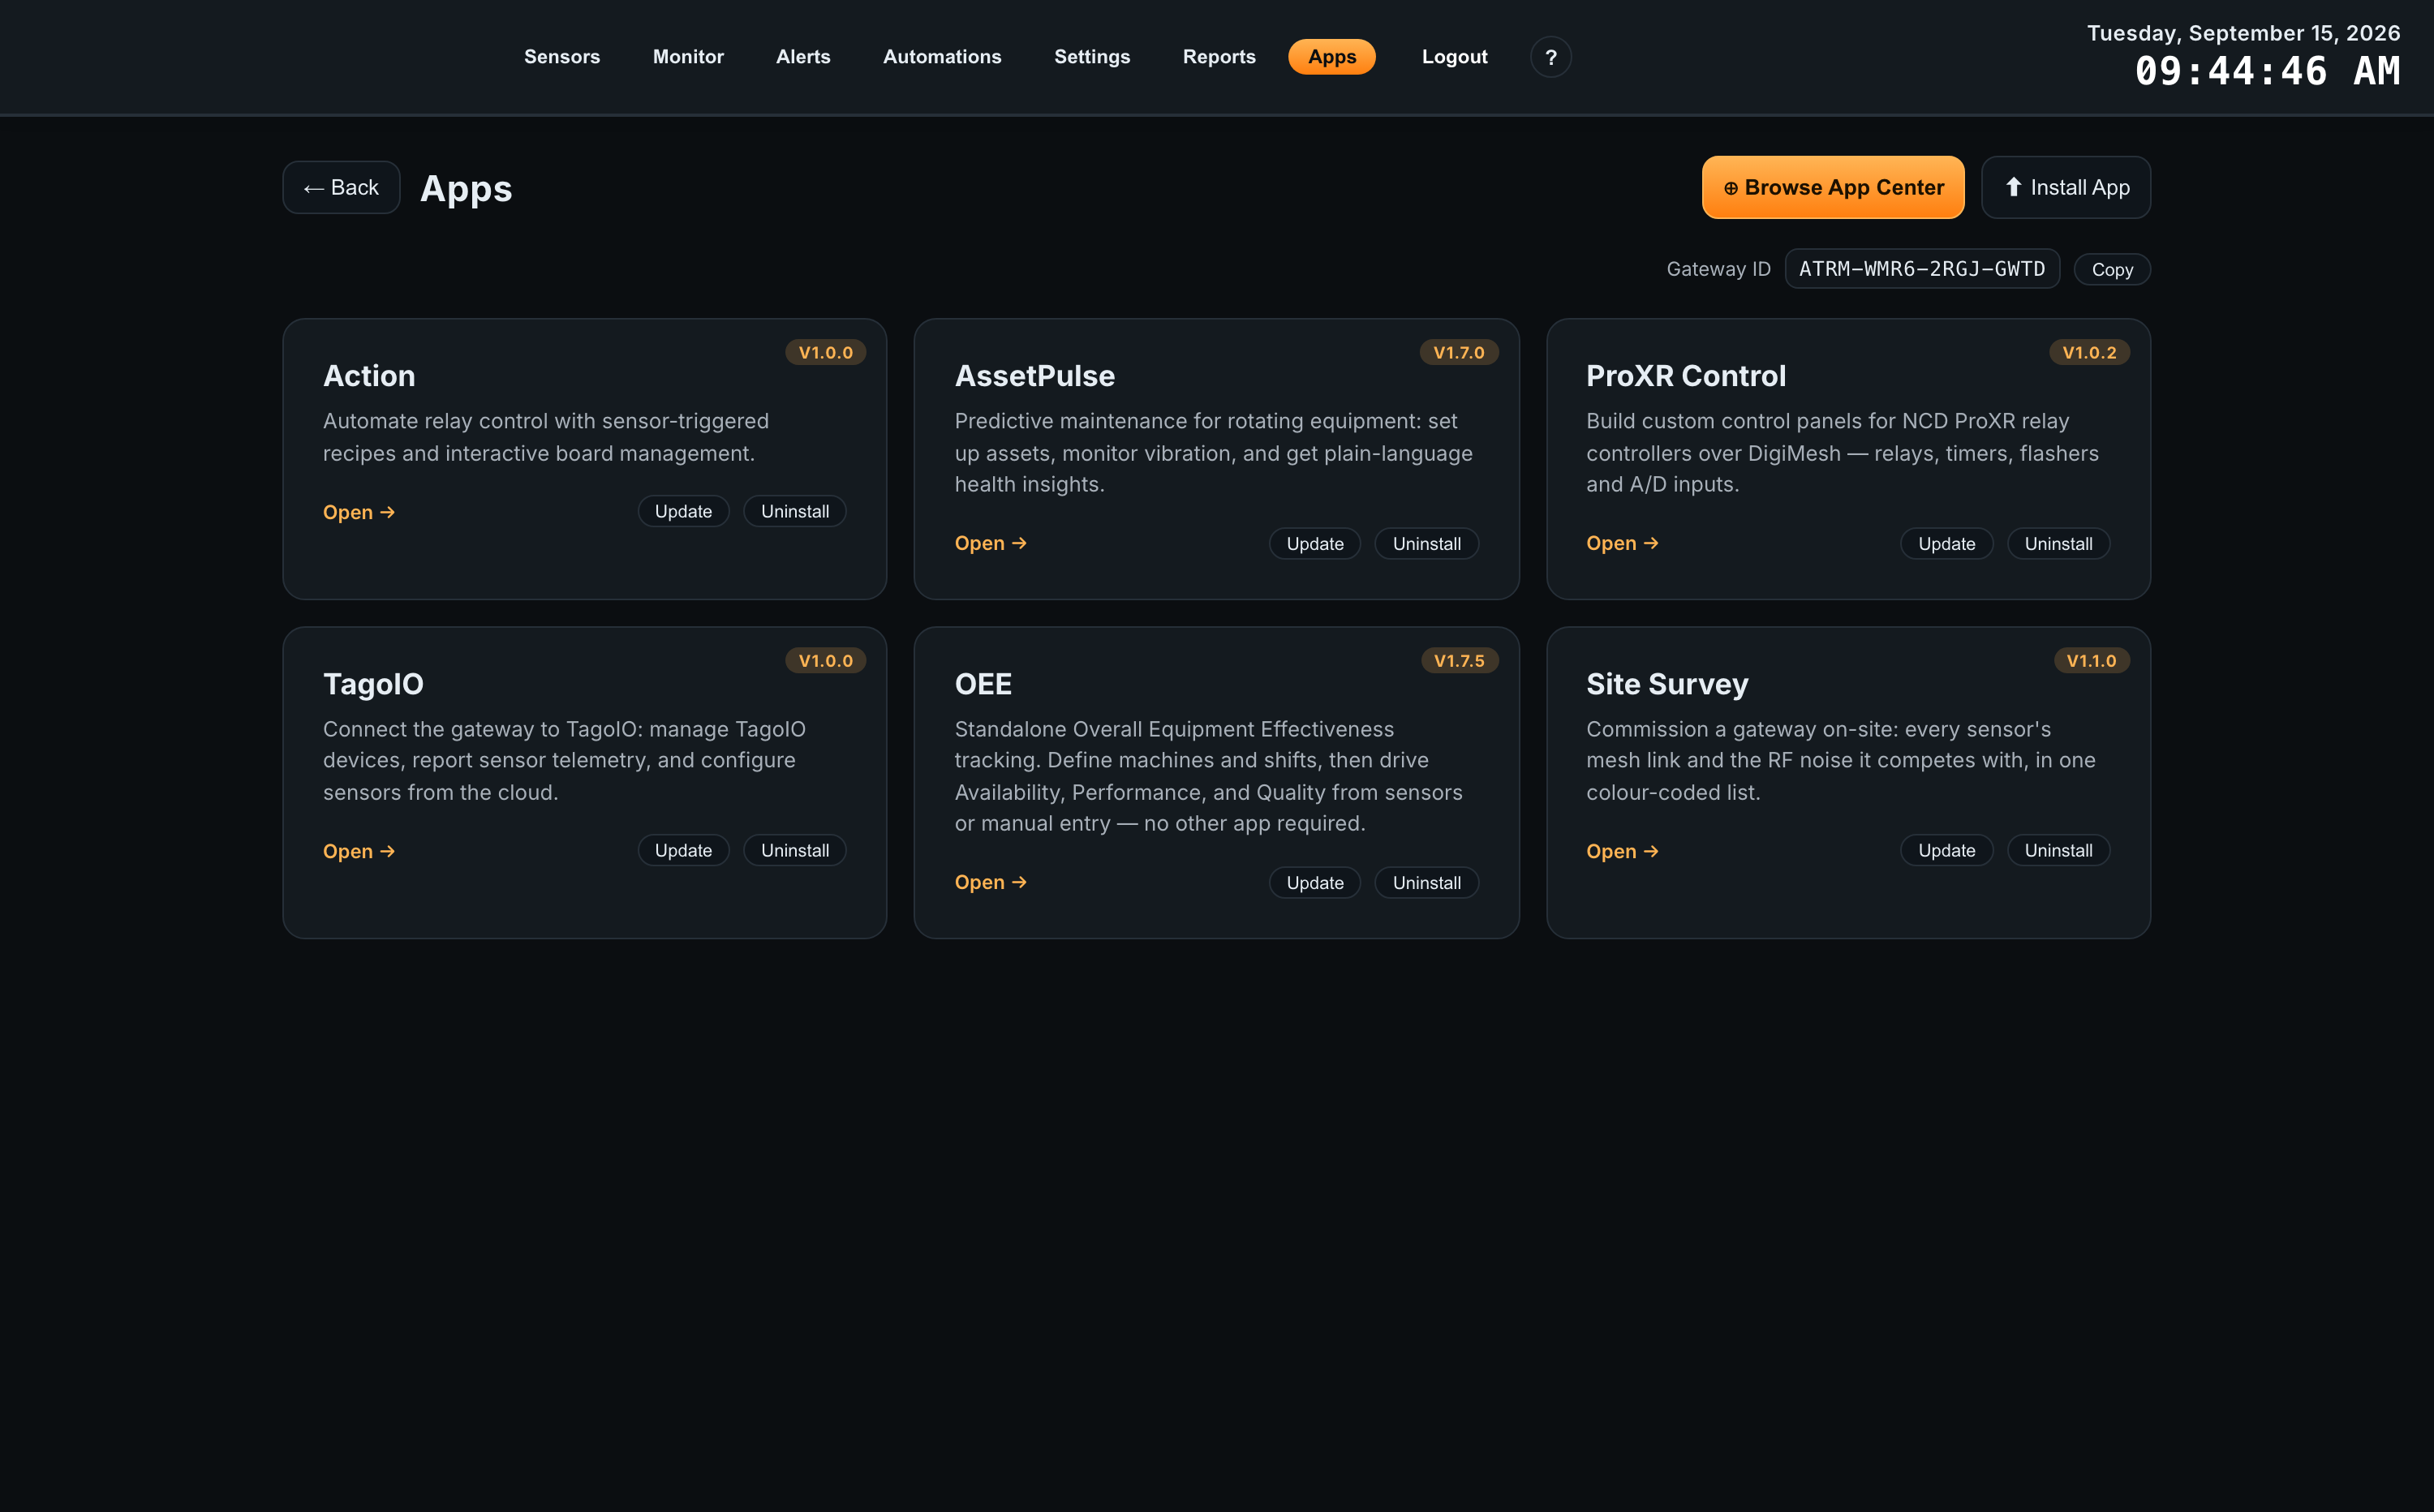
Open the appSite Survey now appears as a card on the Apps page. Select it to open.
04First-Time Setup
The shortest path from a fresh install to a graded site.
1. Open the app
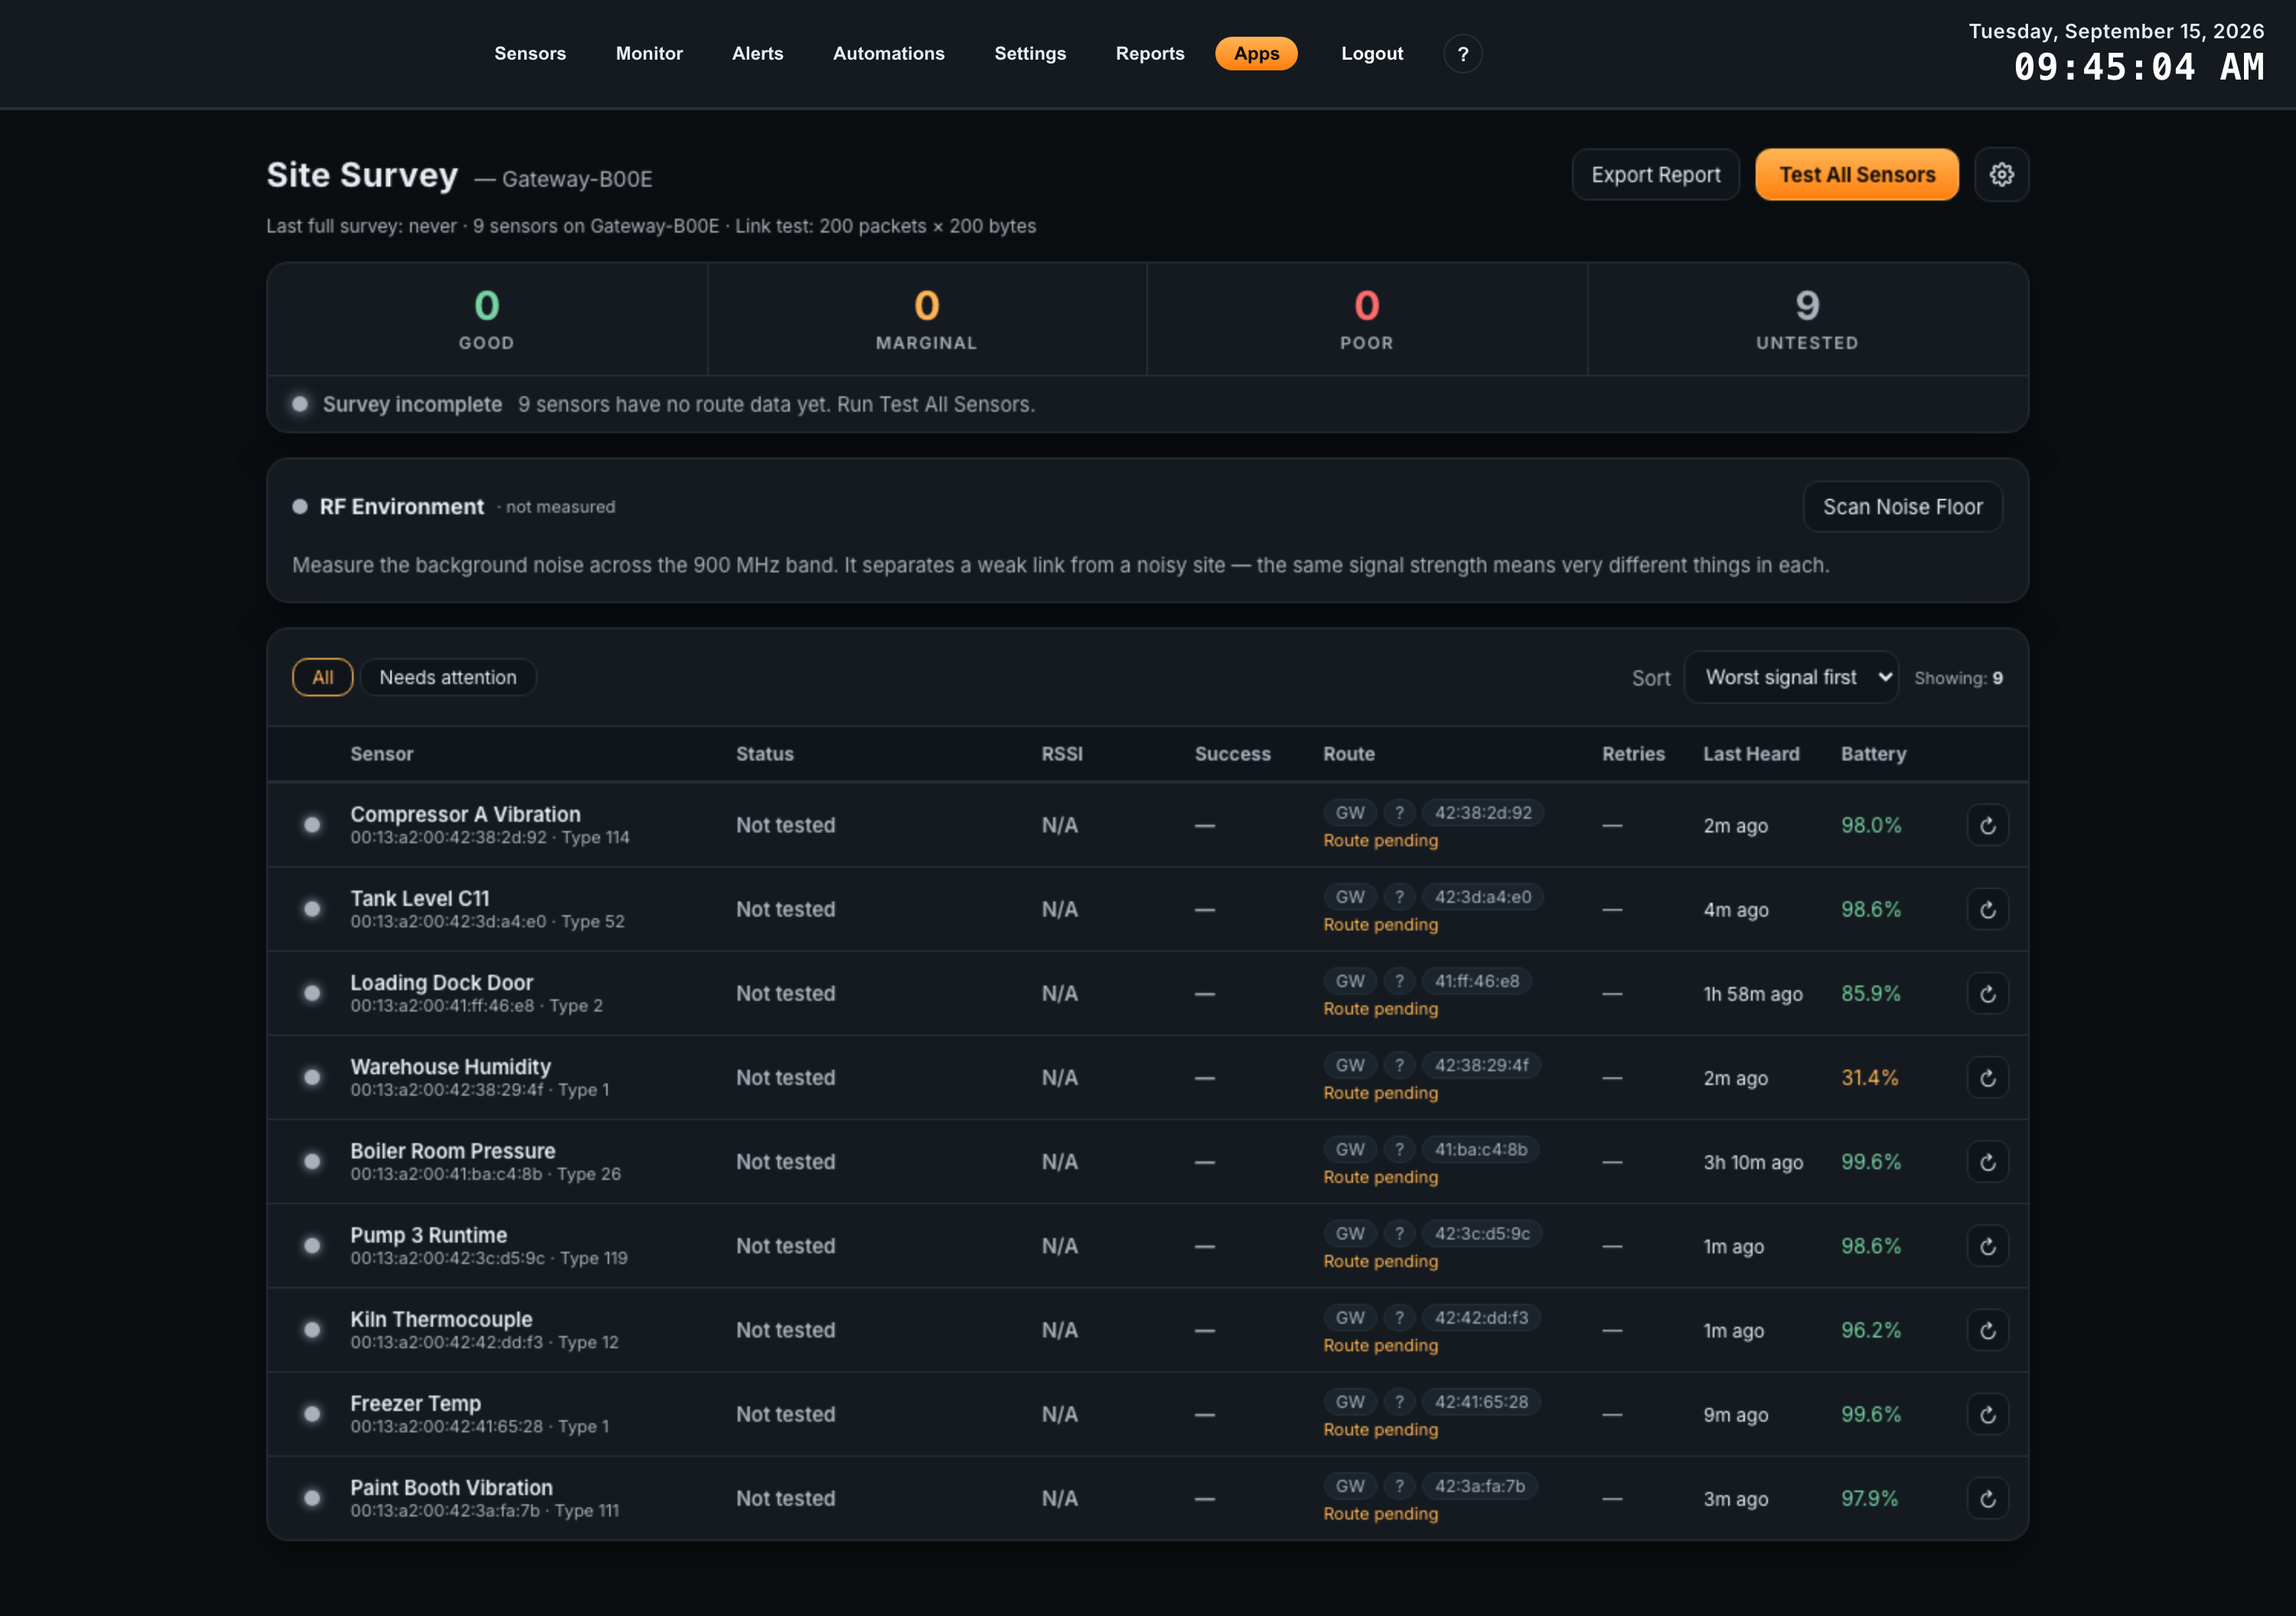
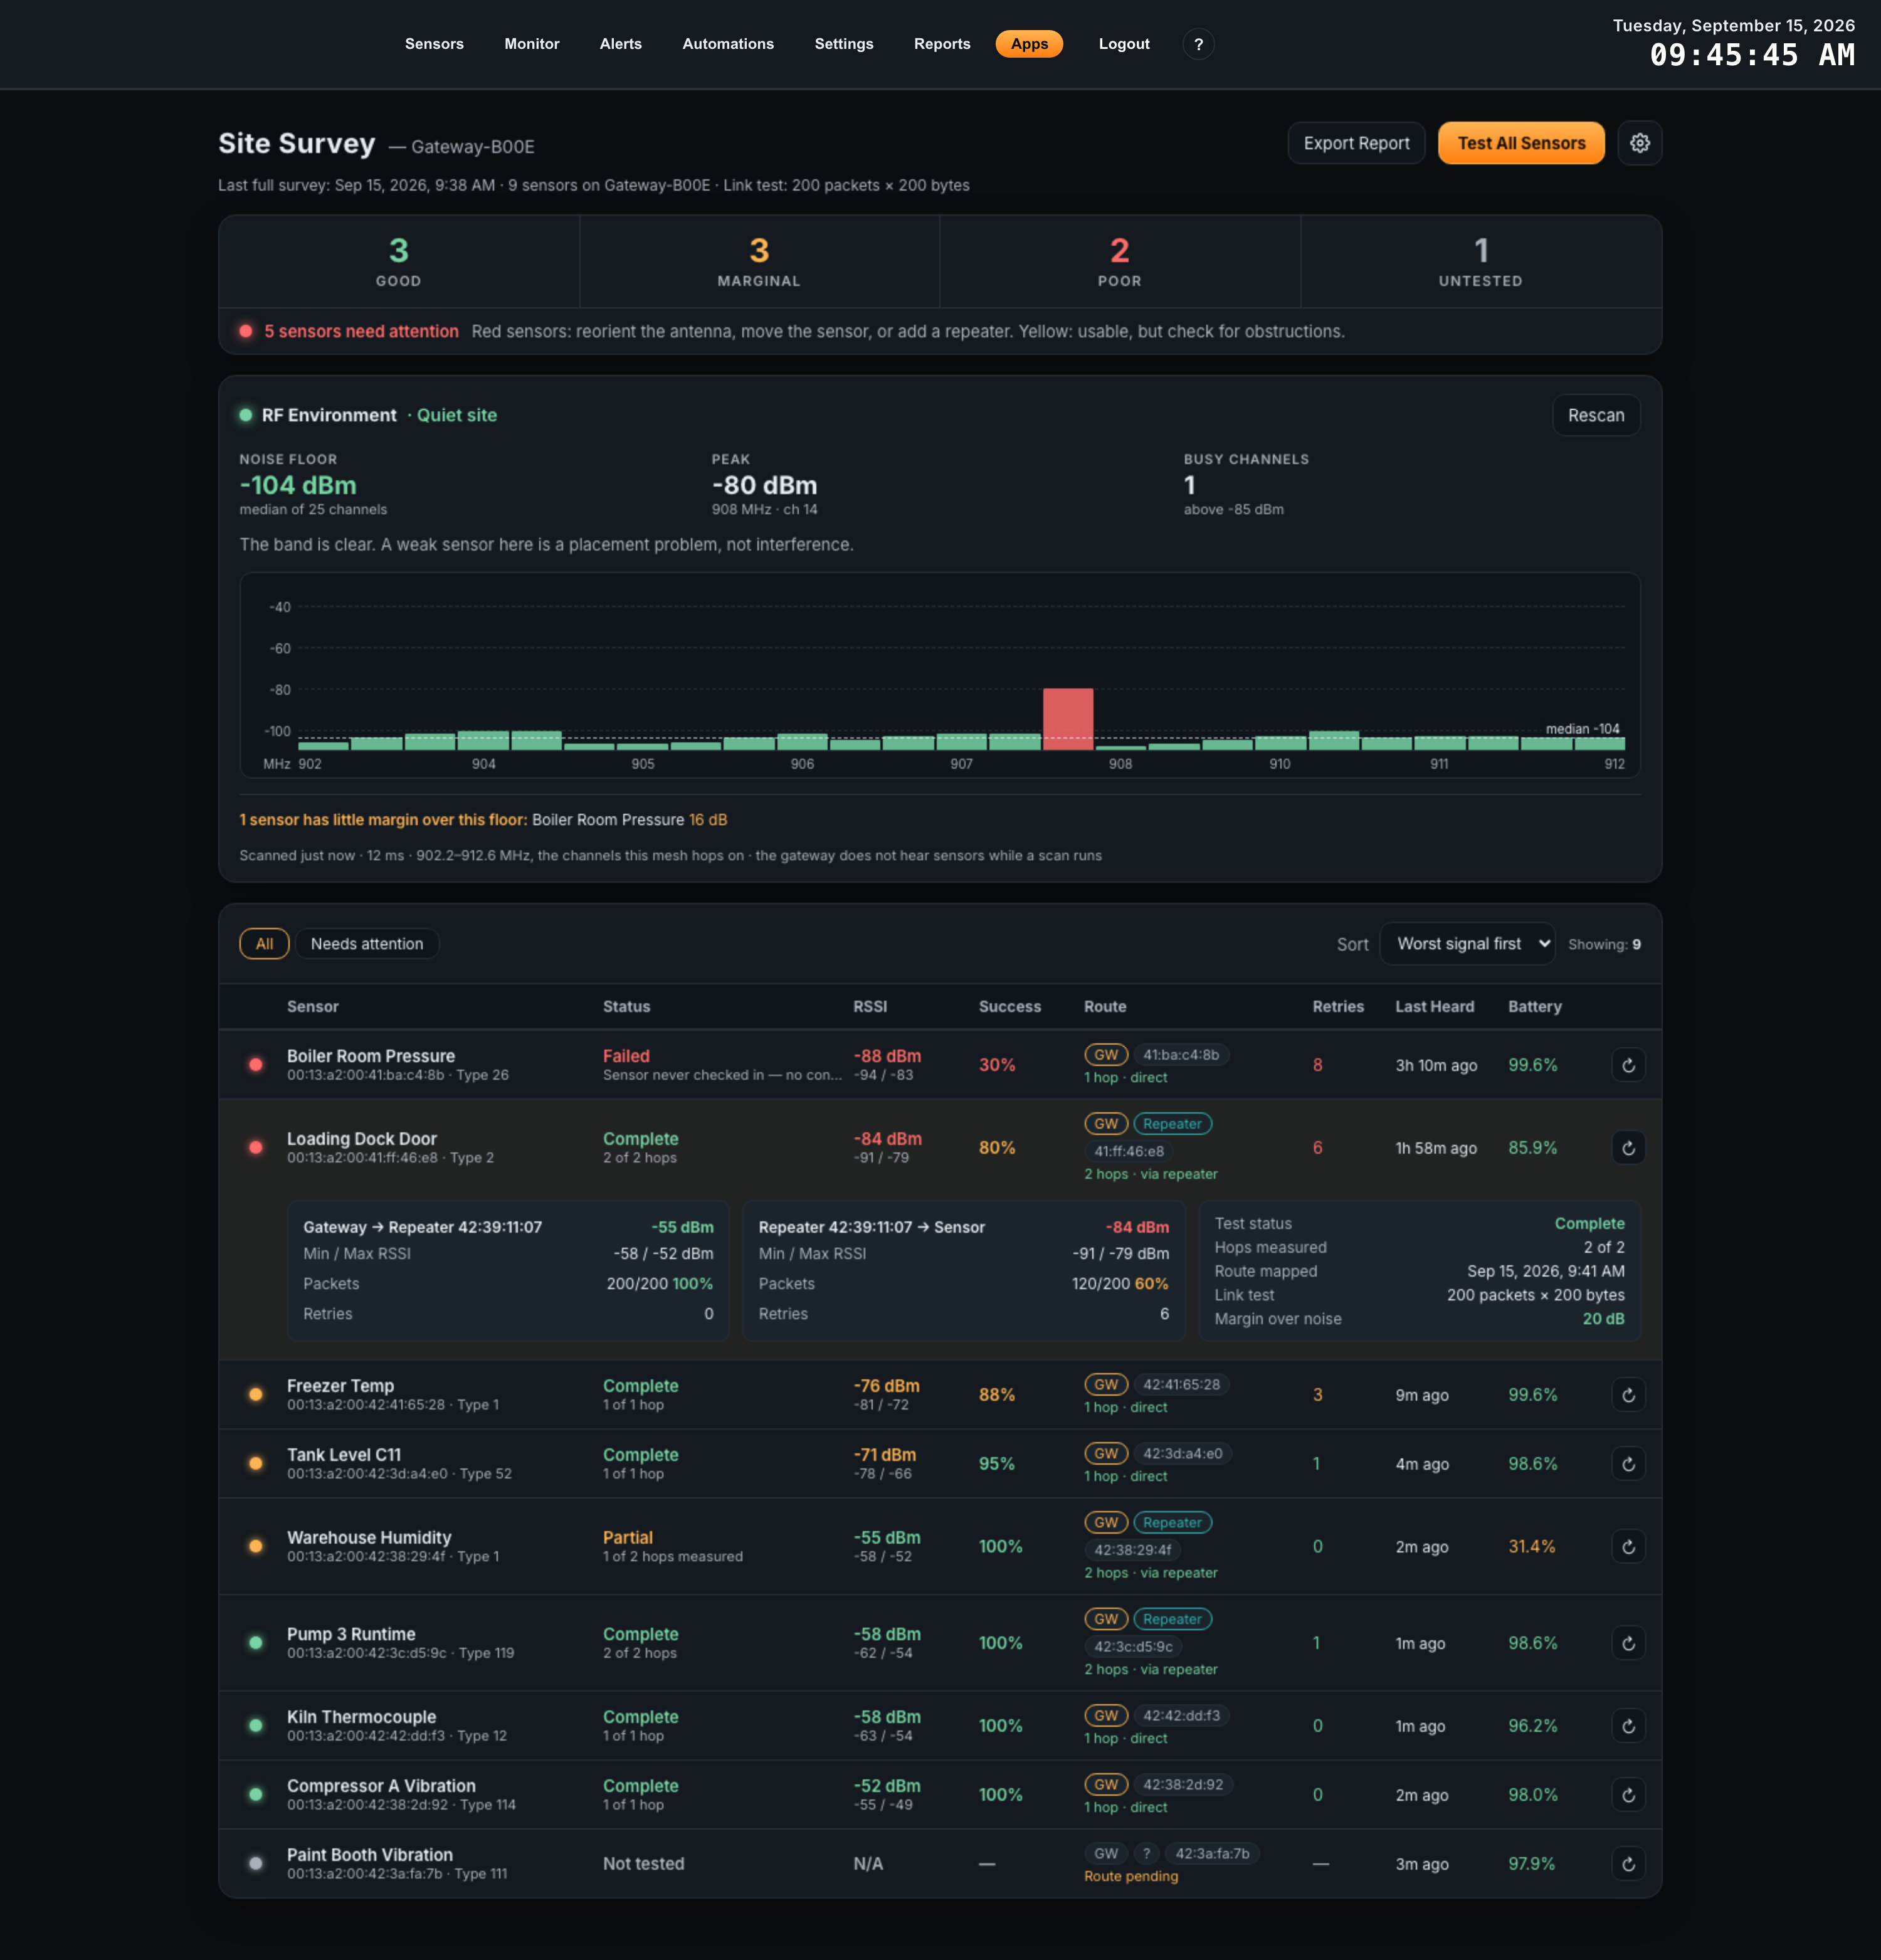
Select Site Survey on the Apps page. The header names the gateway you are surveying, and the line beneath it reports when the last full survey ran, how many sensors are on this gateway, and the link-test parameters currently set.
Before any test has run, every sensor shows Not tested. That is expected; the app does not test anything until you ask it to.
2. Check the thresholds
Select the gear button at the top right to open Survey Settings. The defaults suit most industrial sites, but they decide what the colours mean, so it is worth a look before you grade anything. Full detail is in Survey Settings.
If you change anything, select Save. Colours update immediately — no retest is needed, because thresholds are applied to the numbers already measured.
3. Test every sensor
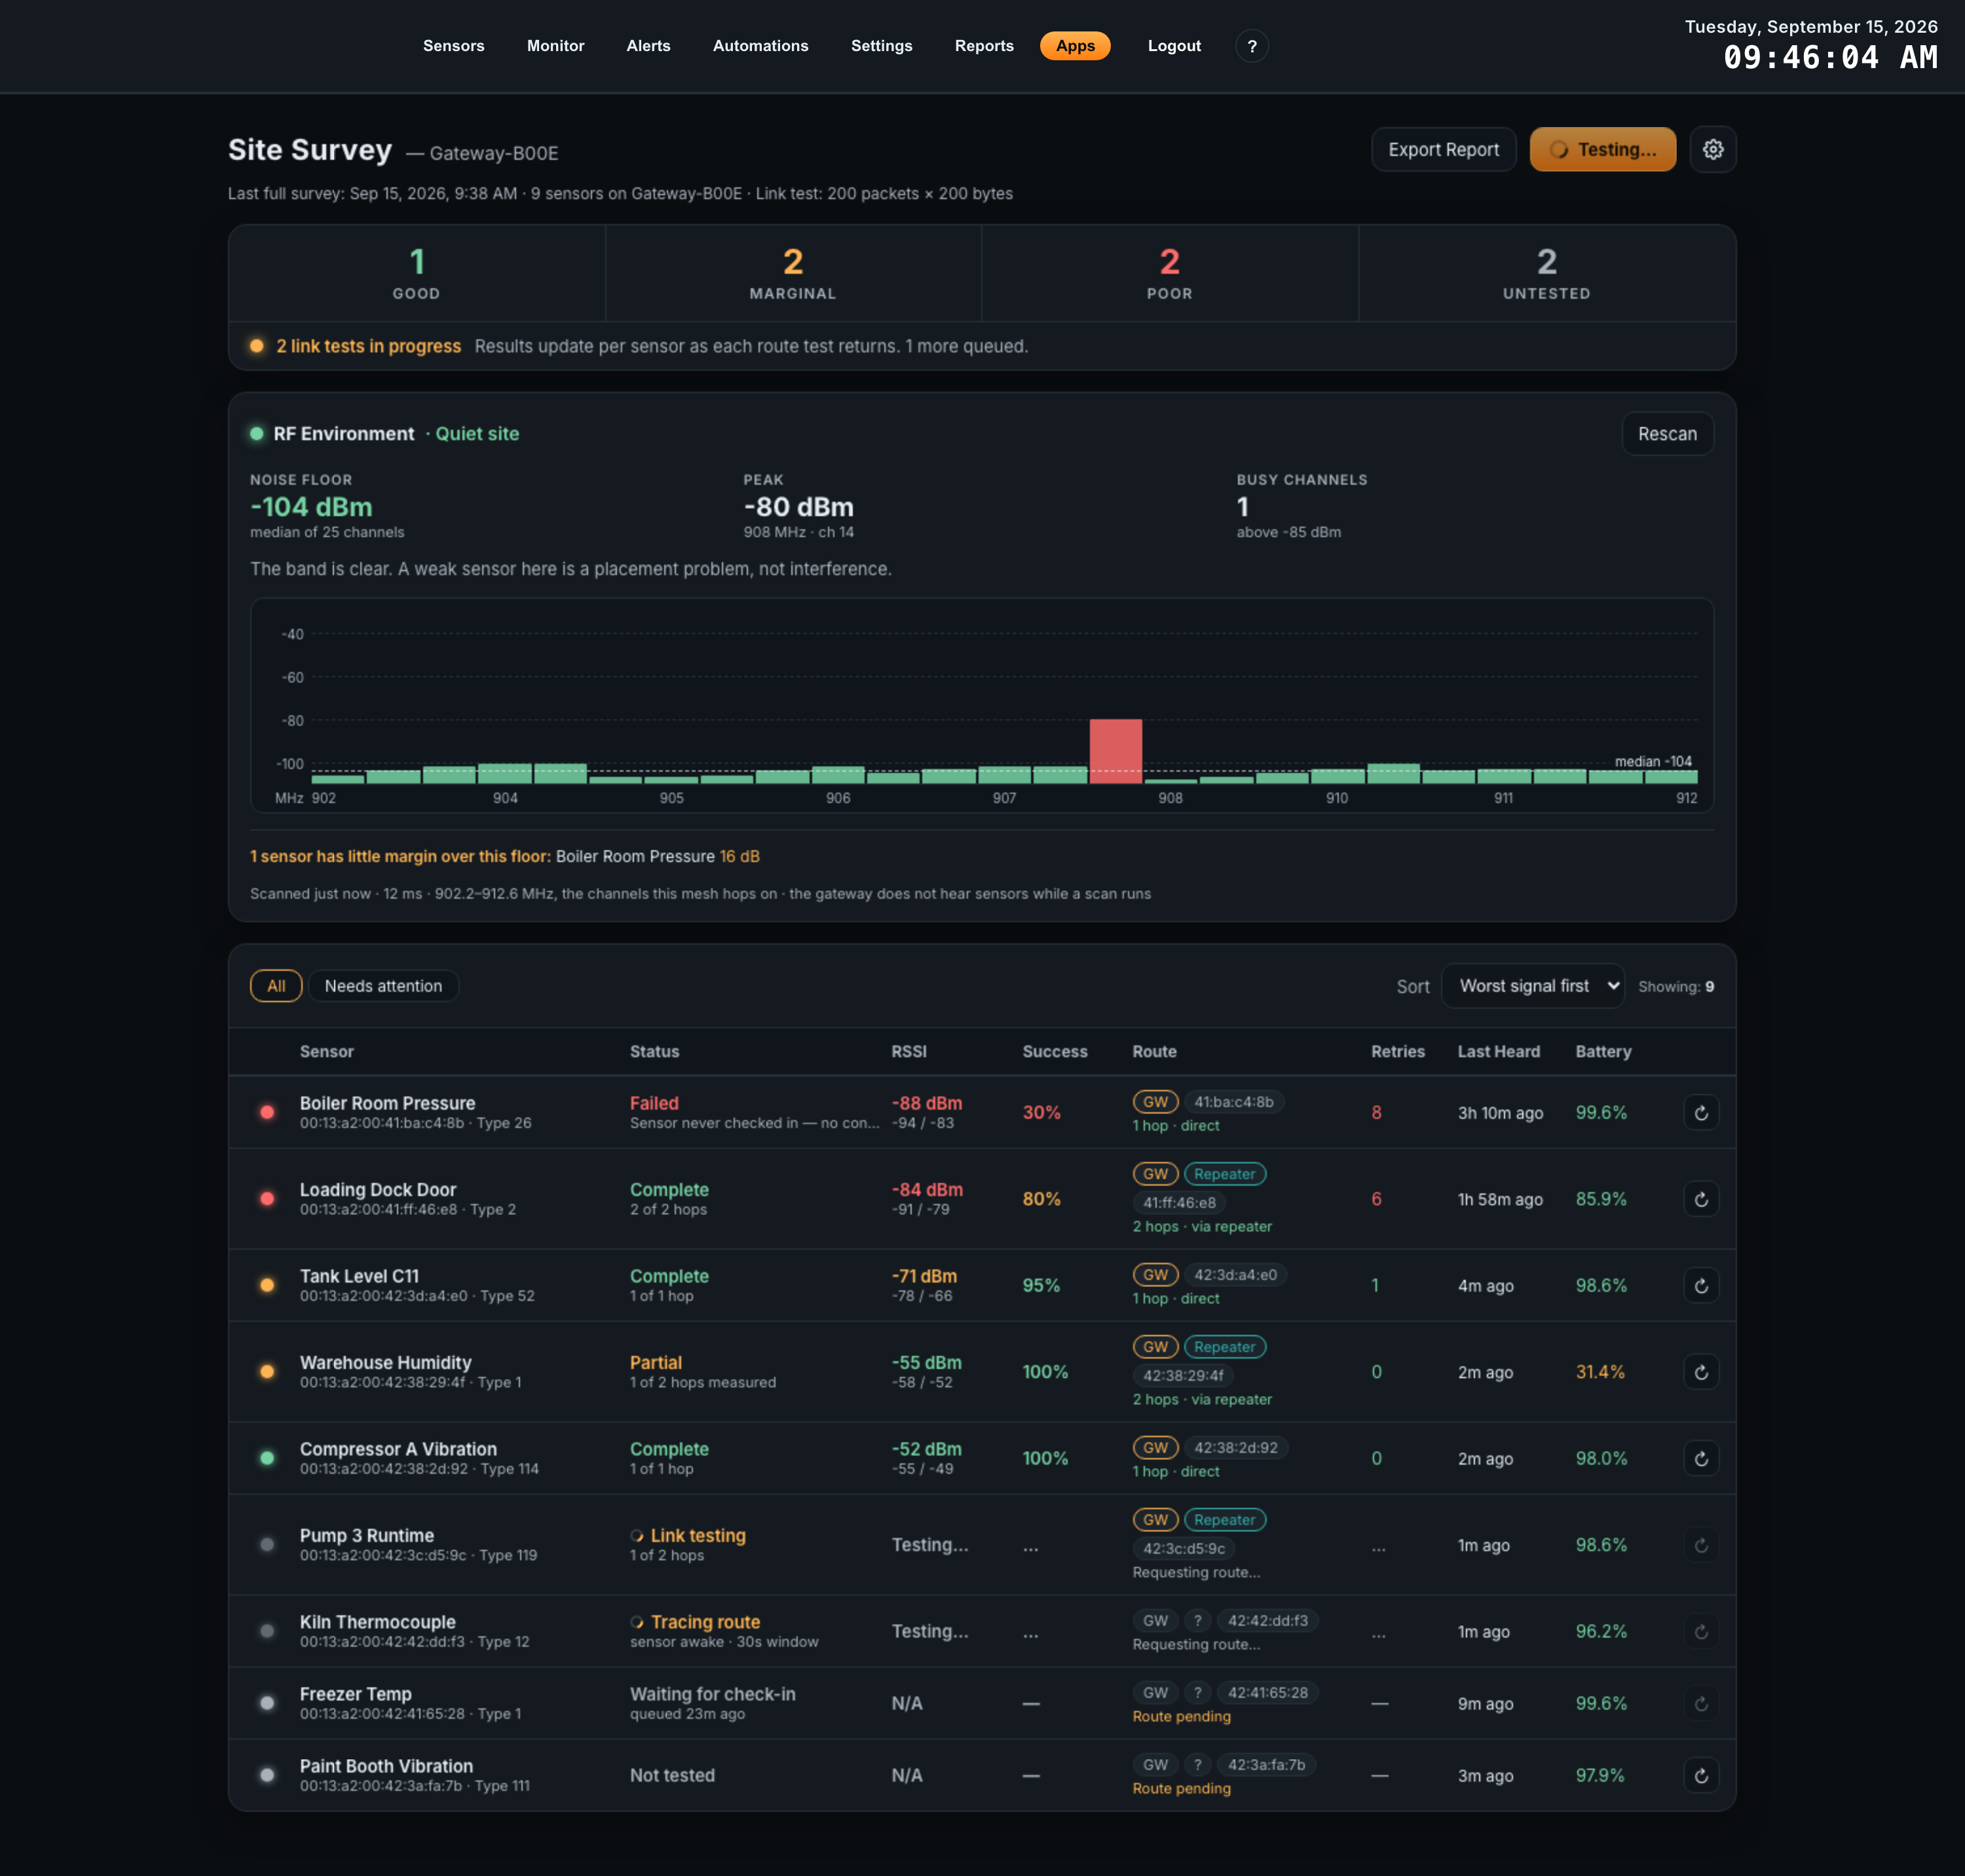
Select Test All Sensors. The button reports progress as the sweep drains, and each row’s Status column tracks its own sensor.
This is not instant. NCD sensors are battery powered and only listen during a periodic check-in, so a queued test waits for that window before anything reaches the air. See Why it takes so long.
4. Read the result
When the sweep settles, the summary strip counts each grade and the line beneath gives a plain verdict. Work the red rows first, then the yellow. A green list means the installation is done.
If several sensors look weak at once, run Scan Noise Floor before moving any hardware — a noisy site and a badly placed sensor look identical in a signal reading, and they have different fixes. See RF Environment.
05The Sensor List
The main screen. Every whitelisted sensor, one row each.
Summary strip
Four counts across the top, each one a button that filters the list to that grade. Select it again to clear the filter.
| Count | Meaning |
|---|---|
| GOOD | Every measured value meets its Good threshold. |
| MARGINAL | At least one value fell to the Ok band. Usable, with little headroom. |
| POOR | At least one value missed the Ok threshold. Needs attention. |
| UNTESTED | No link measurements exist for this sensor yet. |
Beneath the counts, one line states the worst grade present and what to do about it. While the radio is busy it reports the tests in progress instead; while tests are merely queued it says so, and explains that nothing is on the air yet.
Columns
| Column | What it shows |
|---|---|
| (dot) | The row’s overall grade as a colour. It pulses while that sensor’s radio work is actually on the air. |
| Sensor | The sensor’s name, with its radio address and sensor type beneath. Rename sensors on the gateway’s Sensors page; the new name appears here. |
| Status | Where this sensor’s test is. See What the Status column means. |
| RSSI | Signal strength of the weakest leg on the route, in dBm, with that leg’s minimum and maximum beneath. Less negative is stronger. |
| Success | Share of test packets that arrived, across every leg. |
| Route | The path from the gateway to the sensor as chips, with the hop count beneath. GW is the gateway; a Repeater chip is a mains-powered sensor relaying traffic. |
| Retries | Radio-level retransmissions summed across the route. Lower is better. |
| Last Heard | How long since the gateway last received telemetry from this sensor. Not graded, and independent of link testing. |
| Battery | Last reported battery level. |
| (retest) | Tests this one sensor. Disabled while that sensor already has a test outstanding. |
Filtering and sorting
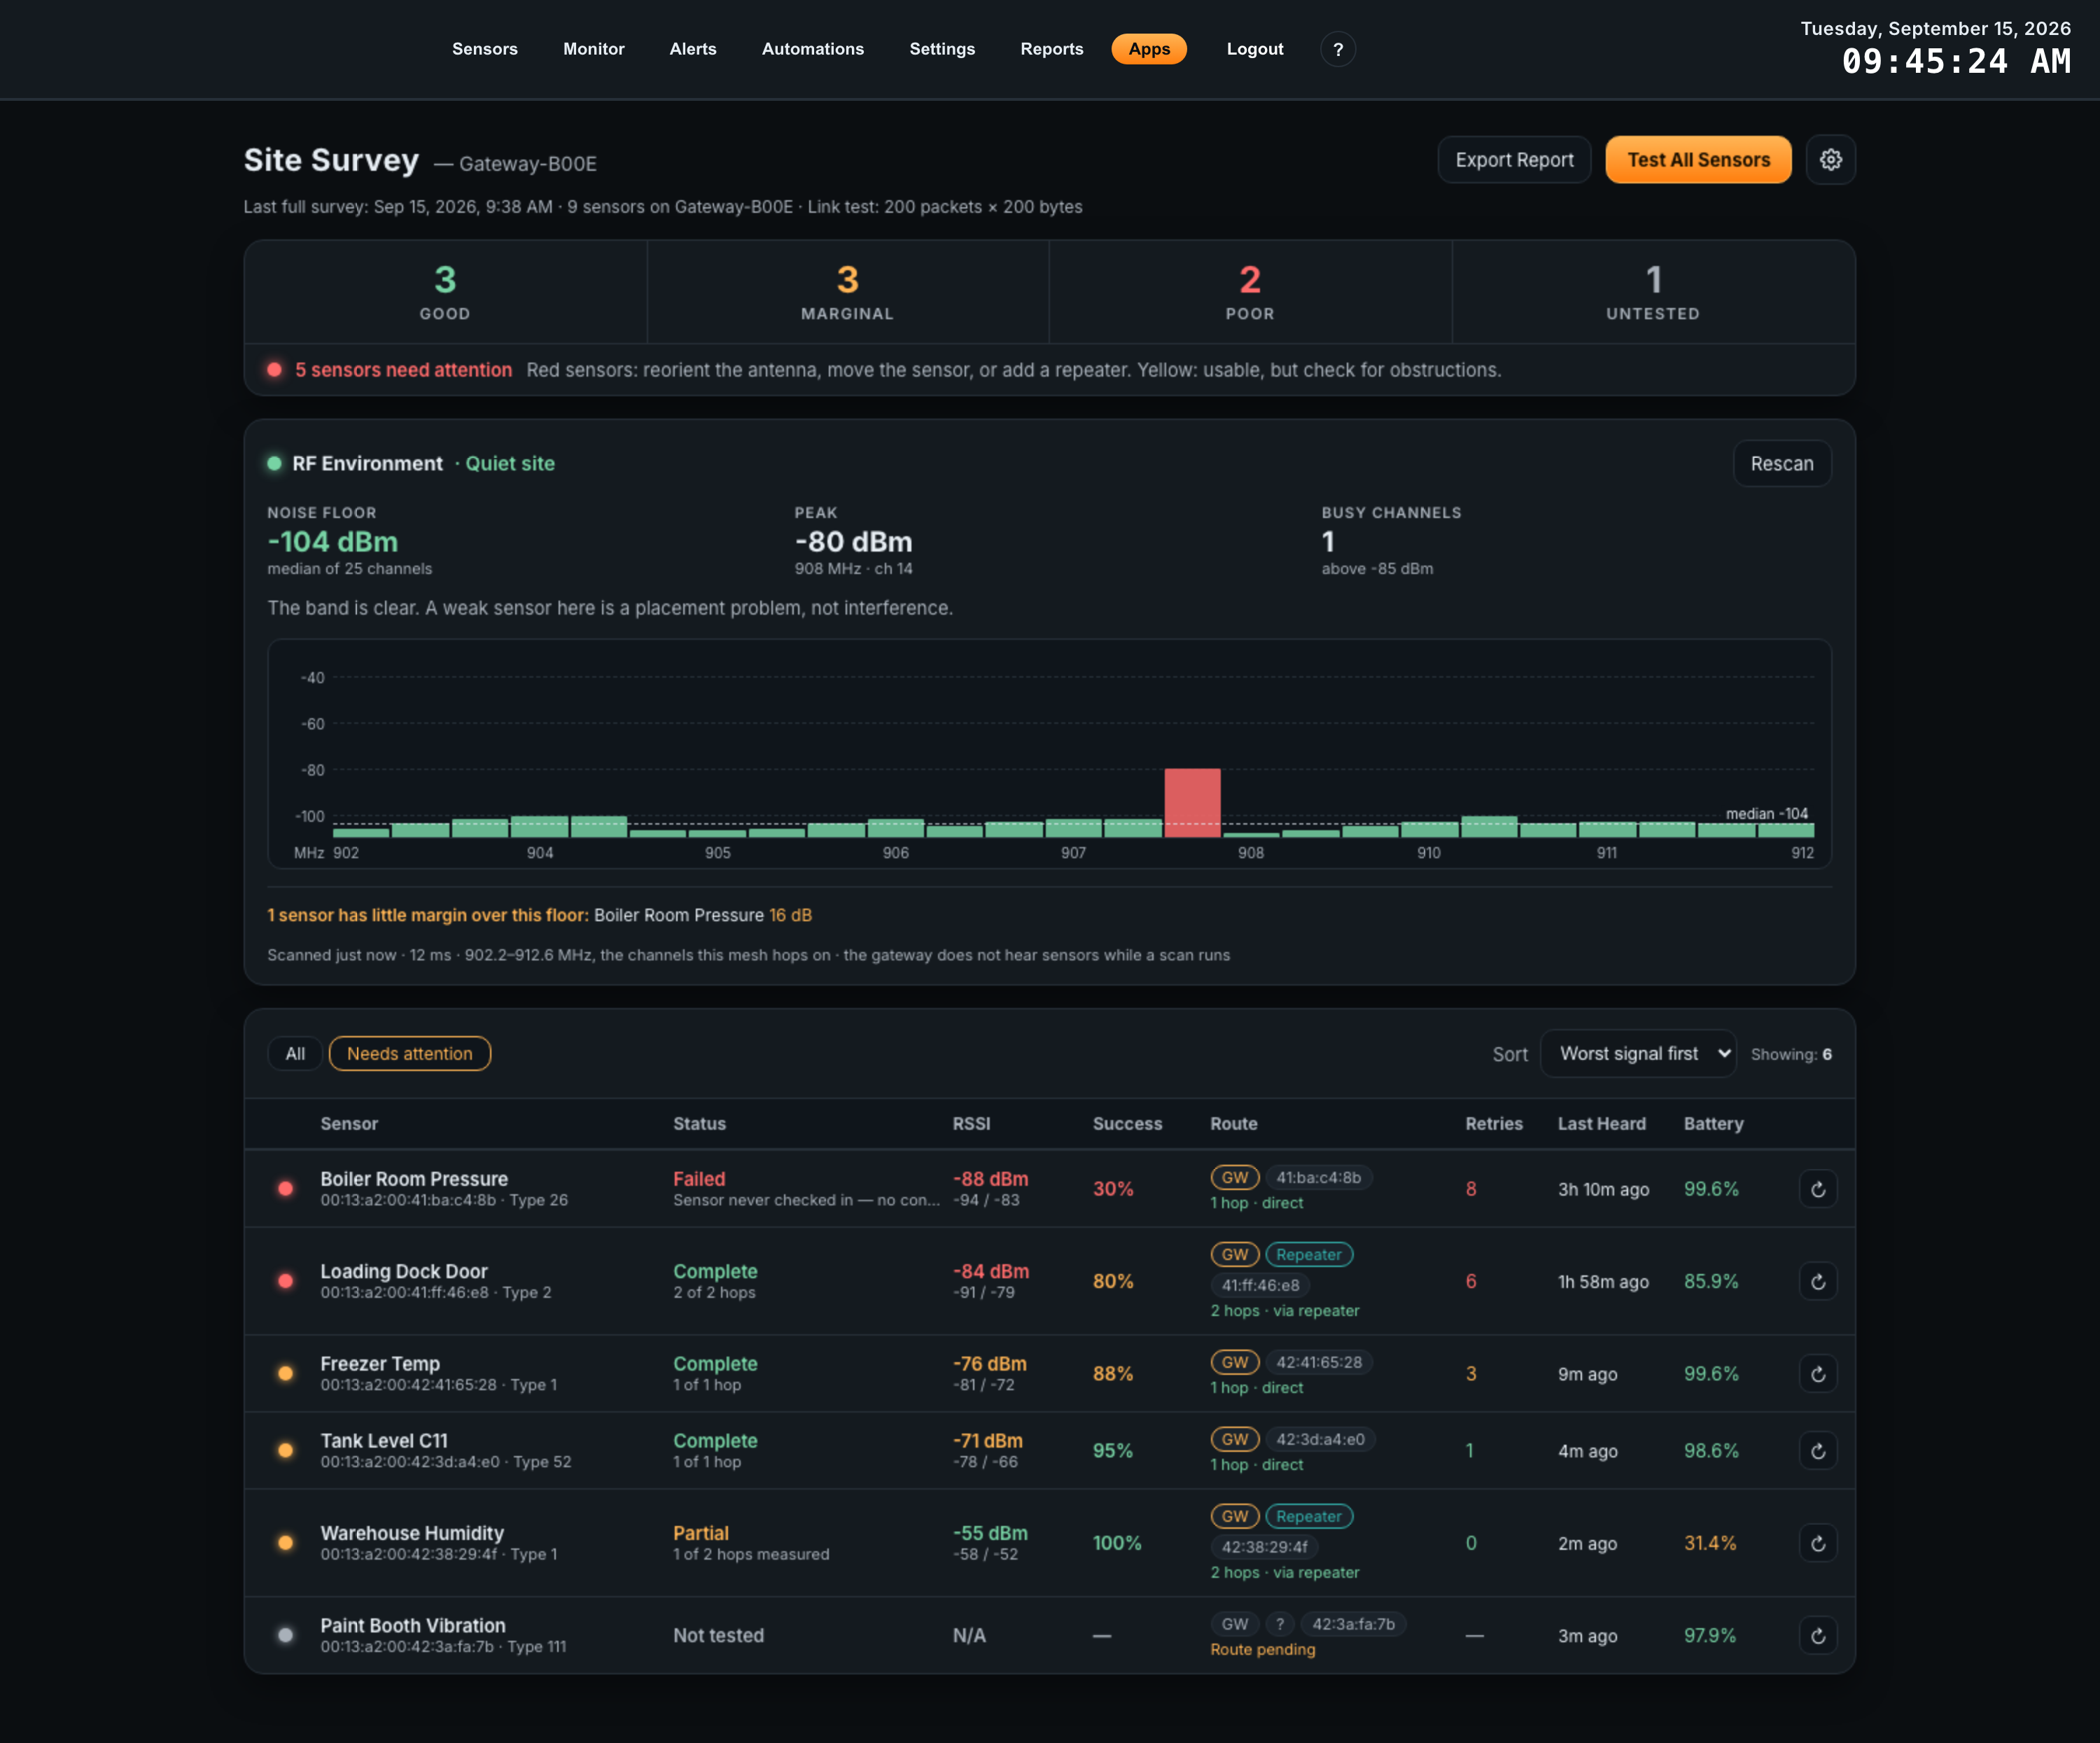
Two pills sit above the list. All shows everything. Needs attention narrows to the rows that are not green — poor, marginal and untested together.
The Sort menu offers three orders:
| Order | Behaviour |
|---|---|
| Worst signal first (default) | Poor, then marginal, then good, then untested; weakest signal first within each grade. |
| Most hops first | Longest route first. Useful for finding sensors leaning on a repeater. |
| Name | Alphabetical. |
Untested sensors sort last rather than worst. A sensor nobody has tested is not evidence of a bad installation, and burying the genuinely red rows beneath it would defeat the list.
Expanding a row
Select any row to open its detail. You get one card per leg of the route, plus a card summarising the test itself.
Each leg card names its two ends and reports the average signal for that leg, the minimum and maximum seen, how many test packets arrived out of how many were sent, and the retries for that leg. A two-hop route produces two leg cards, so you can see which half of the path is the weak one.
The test card reports the status, how many hops were measured, when the route was last mapped, the packet count and size the test used, and the margin over the noise floor if a scan has been run. Where a test failed or finished only partly, the gateway’s own explanation appears here in full.
06Testing Sensors
What happens when you press the button, and why it takes as long as it does.
Starting a test
Test All Sensors queues a test for every sensor in the list. The retest button at the end of a row queues one for that sensor alone. Both do the same work; only the scope differs.
A test has two parts. First a route trace establishes the path from the gateway to the sensor. Then a link test measures each hop on that path by sending a burst of packets and counting what arrives.
The gateway refuses a second test for the same sensor within 30 seconds, and reports how long is left. That floor exists because a test is real airtime on a shared radio.
What the Status column means
| Status | What is happening |
|---|---|
| Not tested | No test has ever been requested for this sensor. |
| Waiting for check-in | Queued. Nothing is on the radio yet. The gateway is waiting for the sensor to wake up, which can take up to an hour. The line beneath reports how long it has been queued. |
| Tracing route | The sensor woke, acknowledged the command that holds it awake, and the gateway is discovering the path to it. It has about 30 seconds. |
| Link testing | The path is known and the gateway is measuring each hop. The line beneath counts hops measured out of hops on the route. |
| Complete | Every hop on the route was measured. The row’s numbers are current. |
| Partial | The sensor went back to sleep before its own hop could be measured, but the other hops were. The data shown is real; retest to catch the rest. |
| Failed | The test did not produce a measurement. The reason appears beneath, and in full when you expand the row. |
Why it takes so long
A battery-powered sensor is not listening most of the time. It reports on its own schedule and opens a window for the gateway to talk to it only periodically. Nothing the gateway wants to ask can happen until that window opens.
So a queued test may sit for a long time doing nothing at all, then finish in seconds once the sensor wakes. That is why the app distinguishes Waiting for check-in from the stages that are actually transmitting: a queued test is not a stalled one, and standing next to the gateway will not make it happen sooner.
Two further effects worth knowing:
- A weak link is the slow one. Every test packet the sensor misses is retried by the radio, so a bad hop takes far longer to measure than a good one. A sensor that is taking a long time is itself a signal.
- A sweep drains in order. The gateway works through queued tests rather than running them all at once, so a large site finishes gradually rather than all together.
Failure messages
Each message points at a different physical cause, so they are worth reading rather than treating as one generic error.
| Message | What it means | What to do |
|---|---|---|
| Sensor never checked in | The sensor never opened a window in about two hours. | Confirm it is powered and in range. This is not a link problem. |
| Sensor did not respond to the Extend OTF command | It checked in but did not acknowledge the command that holds it awake, so nothing was tested. | Retest. If it repeats, the link is too weak to hold a conversation. |
| Route trace did not complete within the sensor’s window | It acknowledged, then did not answer the trace in time. | Retest. Repeated failures suggest a marginal link or interference. |
| Sensor returned to sleep before its own hop could be tested | Reported as Partial. The remaining hops were measured. | Retest to capture the sensor’s own hop. |
| Link test timed out on a hop | A mains-powered hop accepted the test and never reported. The message names the hop. | Look at the named hop, usually a repeater. |
| Link test refused | The radio refused the command repeatedly. | The near end of the named hop is unreachable. |
07RF Environment
What the installation is competing with.
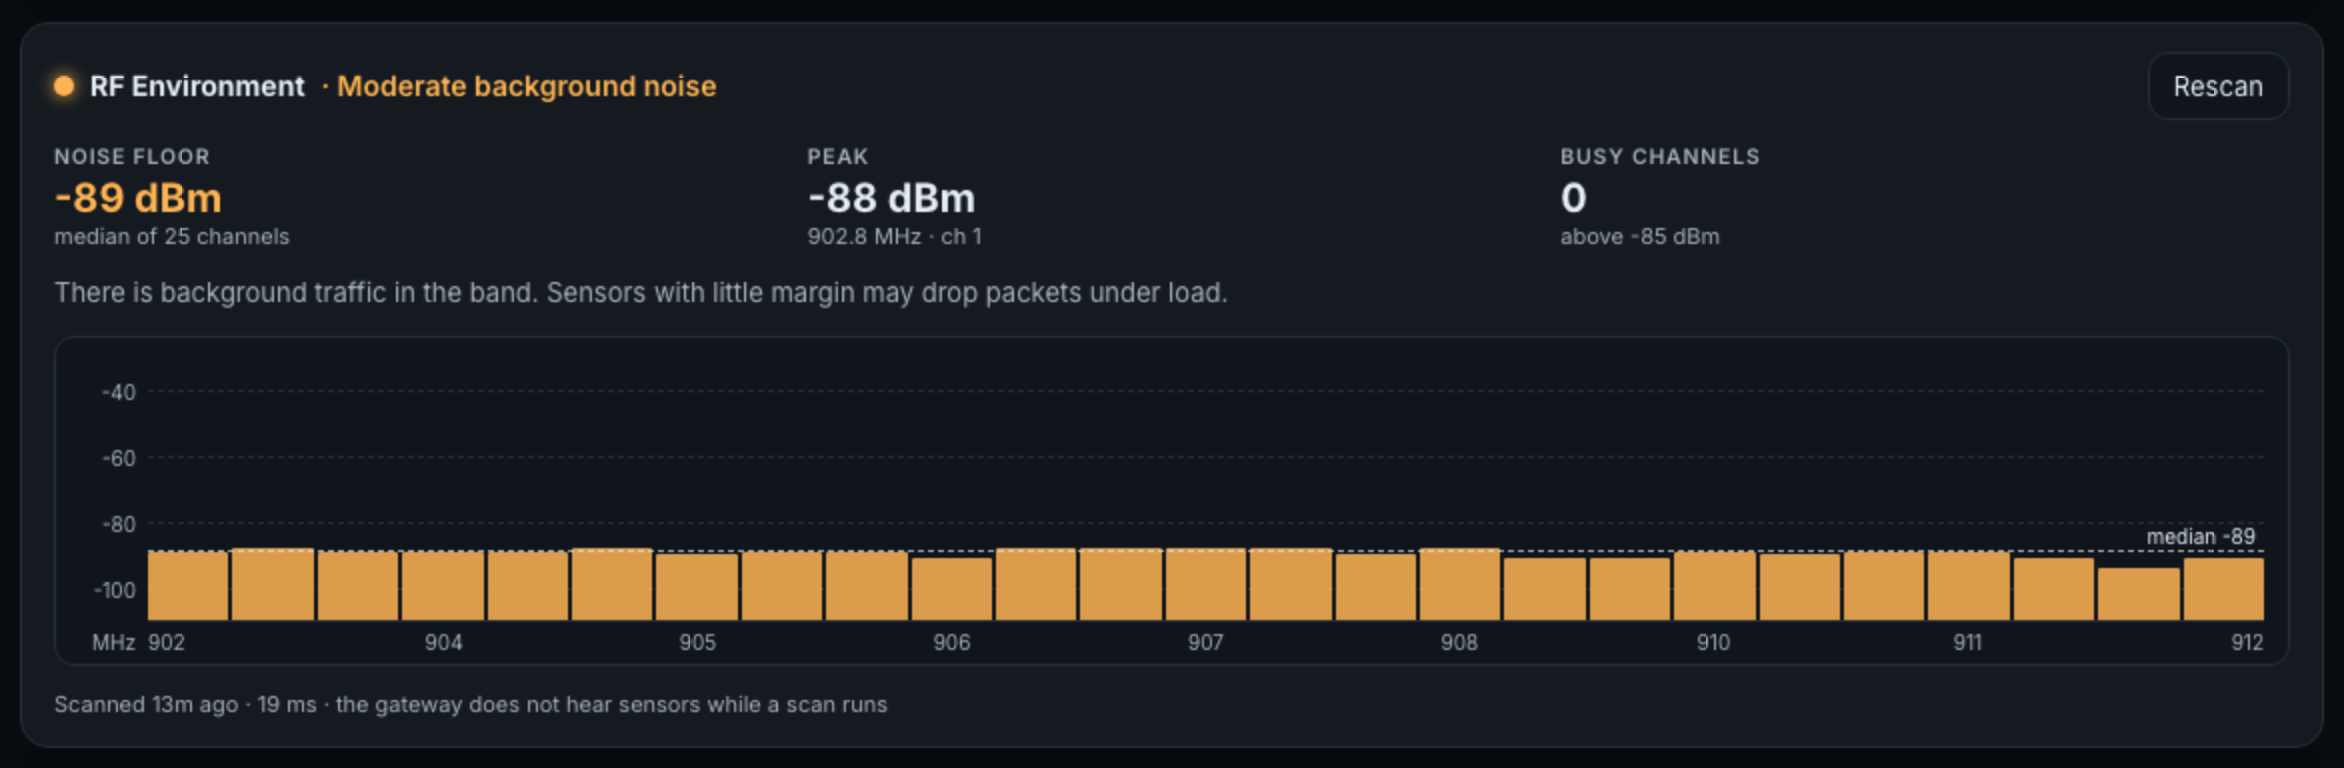
A signal strength on its own does not say whether a link will work. A -80 dBm link against a -105 dBm noise floor has 25 dB of headroom and is healthy. The same -80 dBm against a -85 dBm floor will drop packets no matter how the antenna is turned. Those two look identical in the RSSI column, and they have completely different fixes.
Select Scan Noise Floor to measure it. The scan takes a fraction of a second. Once it has run, the button reads Rescan.
What the panel reports
| Field | Meaning |
|---|---|
| NOISE FLOOR | The median channel reading. This is the number graded against your Noise floor threshold. |
| PEAK | The loudest single channel, with its frequency. |
| BUSY CHANNELS | How many channels sit above your Noise floor Ok threshold. |
The floor is reported as the median channel rather than an average. The radio hops across the band, so a link competes with the typical channel; an average would be dragged around by one loud interferer, and the lowest reading would flatter a genuinely busy site. The peak is reported separately because a single hot channel is a different problem — and often a fixable one — from a raised floor.
Margin over noise
Once a scan exists, each sensor’s expanded row gains a Margin over noise figure: its weakest leg’s signal minus the noise floor, in dB. The panel also names the sensors with the least margin, so you do not have to do the subtraction across every row.
Margin deliberately does not change a row’s colour. A sensor’s grade would otherwise shift the moment somebody ran an unrelated measurement, and a link that has not changed should not appear to have.
08How Results Are Graded
Where the colours come from.
Four measurements are graded for every sensor. Each is compared against its Good threshold, then its Ok threshold:
| Measurement | Taken from |
|---|---|
| RSSI | The average signal of the weakest leg on the route. |
| Success rate | Test packets that arrived, as a share of those sent, across every leg. |
| Retries | Radio retransmissions summed across every leg. |
| Battery | The sensor’s last reported battery level. |
The row takes the worst of the four. One measurement in the red band makes the row red, however good the other three are. A sensor with a strong signal and a flat battery is still a sensor that will stop working.
RSSI comes from the weakest leg rather than an average of the route, because a strong gateway-to-repeater hop must not mask a marginal repeater-to-sensor one. The chain is only as good as its weakest link.
A sensor with no link measurements at all is untested rather than graded. The app never infers a grade from telemetry signal strength — that is the strength of the last data packet, which says nothing about the tested quality of the link.
09Survey Settings
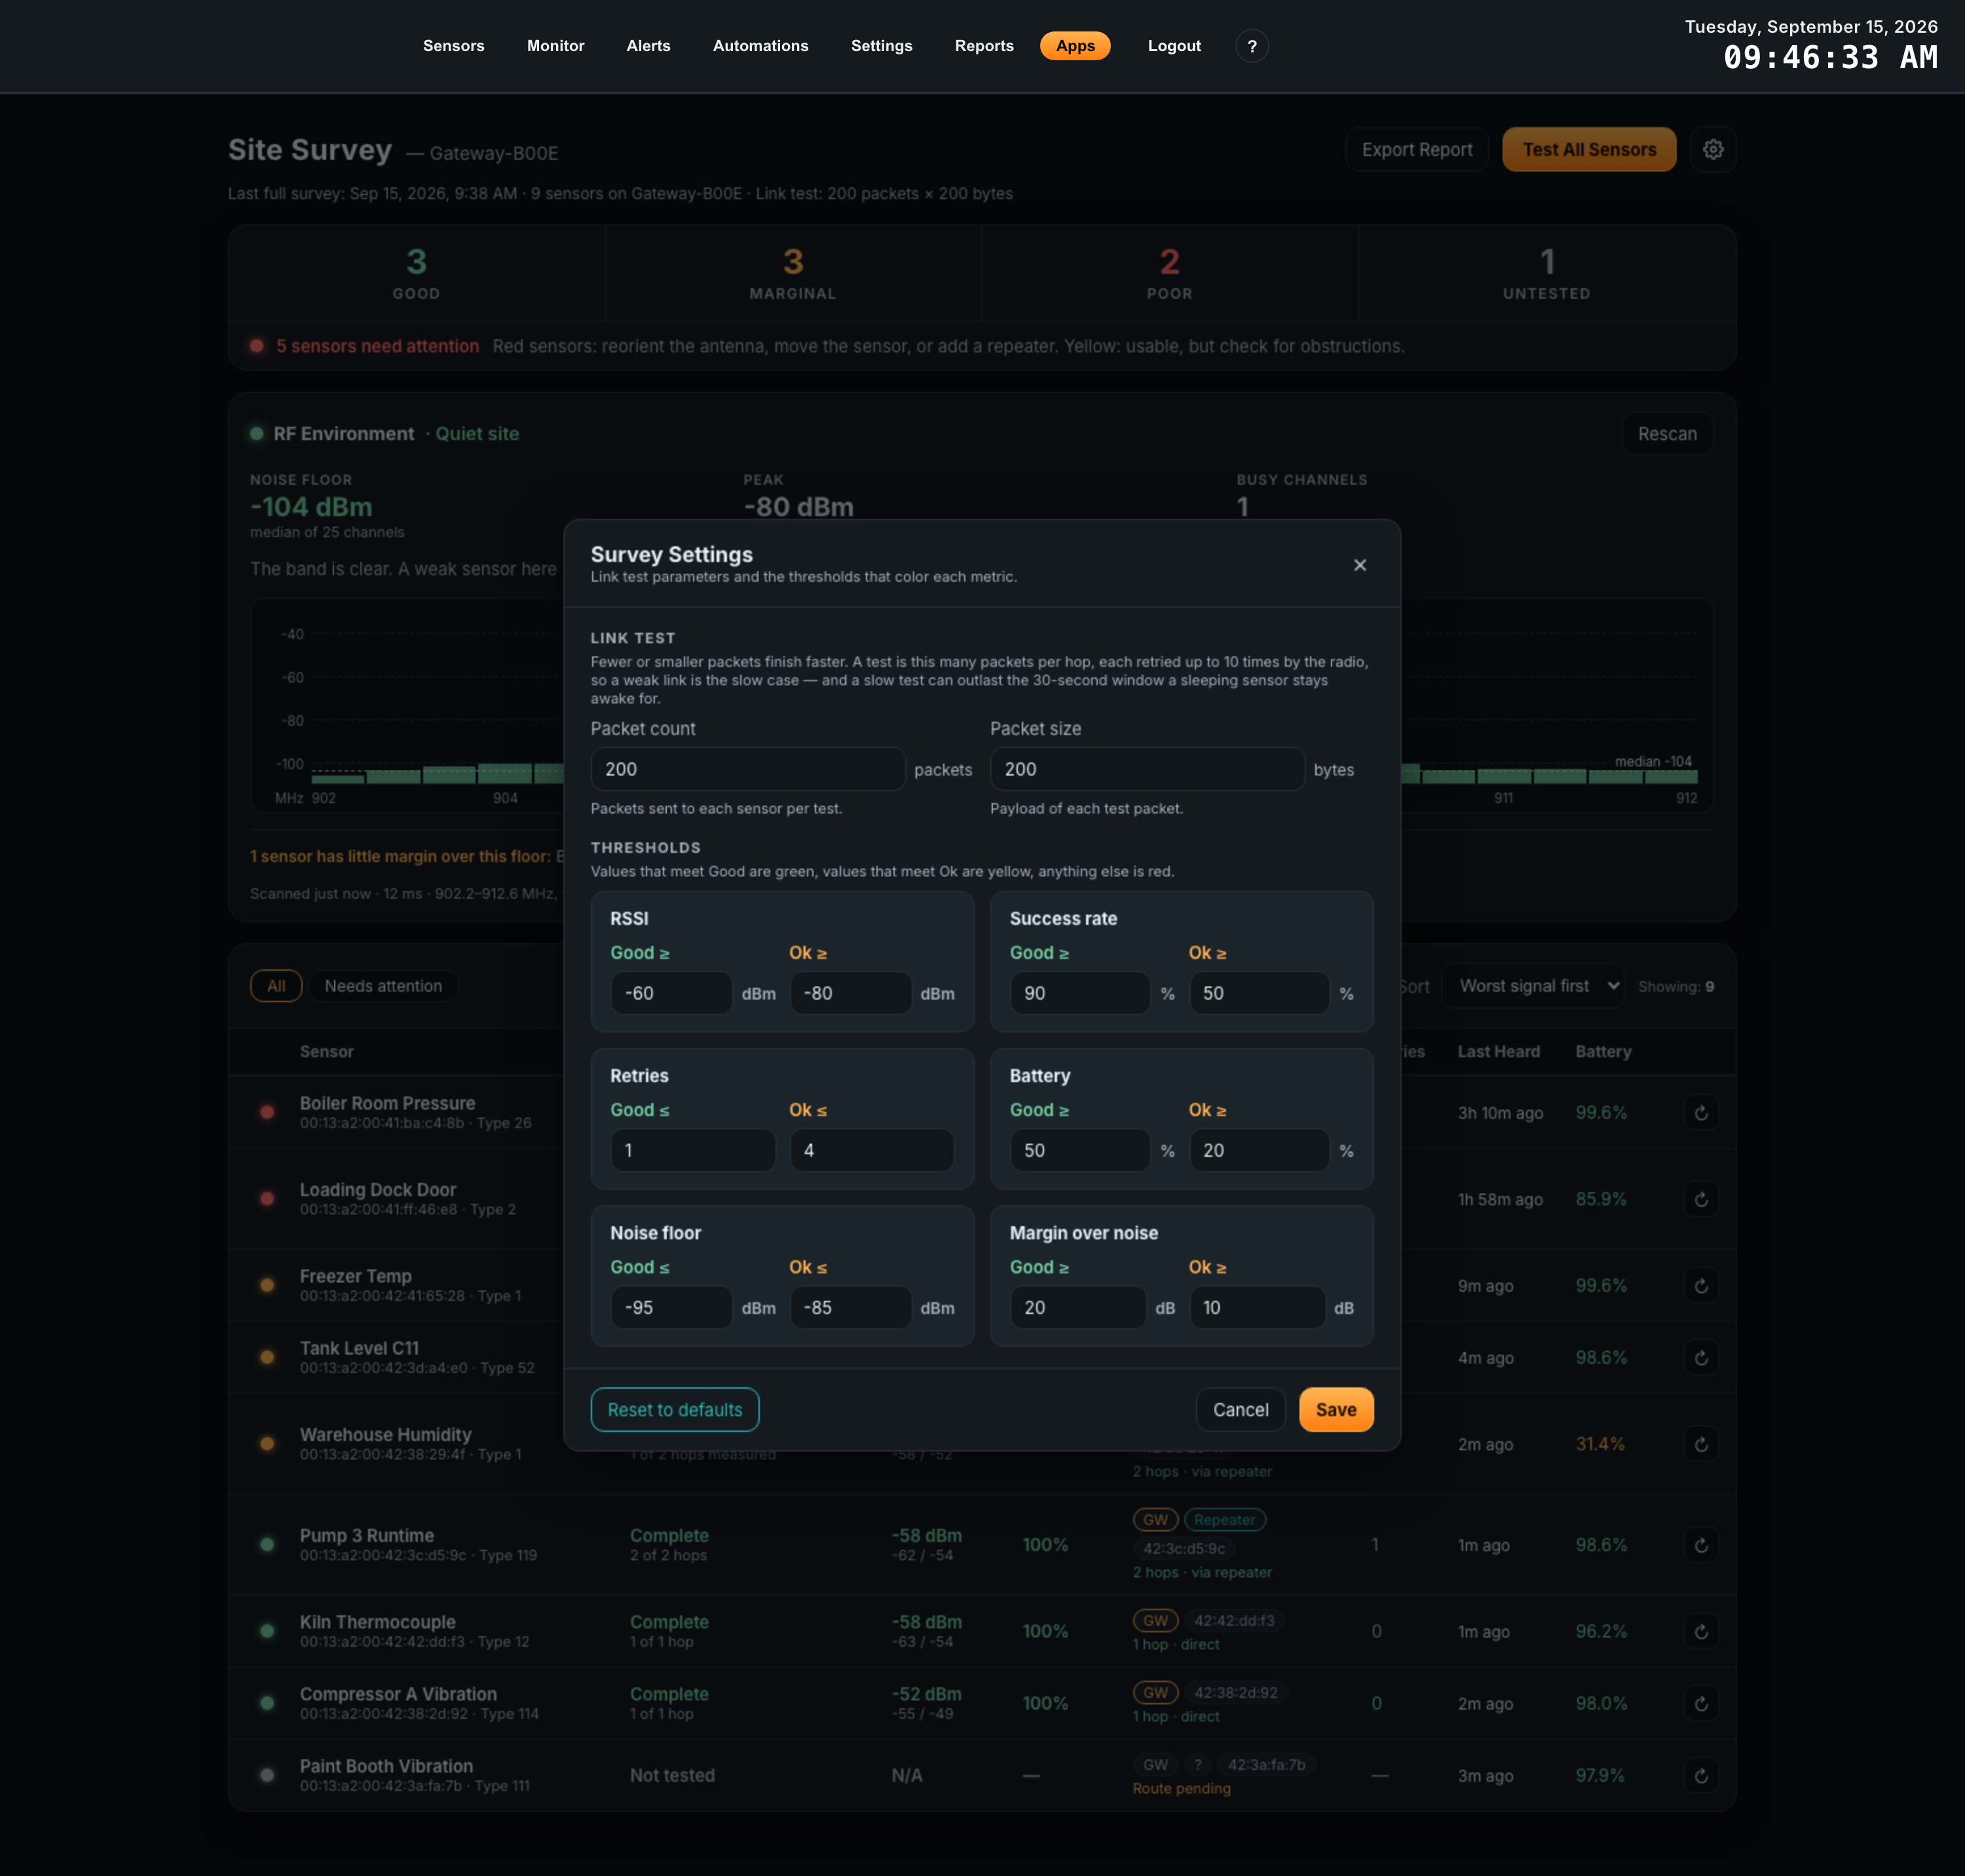
The gear button at the top right. Link-test parameters, and the thresholds that colour every metric.
Link test
These two control how thorough each hop measurement is.
| Field | Default | Effect |
|---|---|---|
| Packet count | 200 packets | Packets sent to each sensor per test. More packets give a more reliable success rate; fewer finish faster. |
| Packet size | 200 bytes | Payload of each test packet. |
This setting is not cosmetic. Each test packet the sensor misses is retried by the radio, so the cost of a large test grows sharply on a weak link — and a slow test can outlast the short window a sleeping sensor stays awake for, which is what produces a Partial result. On a site where sensors keep coming back partial, lowering the packet count is often the fix.
Thresholds
Six pairs. Values meeting Good are green, values meeting Ok are yellow, anything else is red.
| Threshold | Good | Ok | Why |
|---|---|---|---|
| RSSI | -60 dBm or stronger | -80 dBm or stronger | Below about -80 dBm a link has little headroom for a door closing or a pallet being moved. |
| Success rate | 90% or higher | 50% or higher | Sensors retry, so a link can work below 90% — but it is spending battery to do it. |
| Retries | 1 or fewer | 4 or fewer | Retries are the early warning: they climb before the success rate falls. |
| Battery | 50% or higher | 20% or higher | Below 20% a sensor should be scheduled for replacement regardless of its link. |
| Noise floor | -95 dBm or quieter | -85 dBm or quieter | The one pair where lower is better. Above about -85 dBm the band is busy enough to cost packets on its own. |
| Margin over noise | 20 dB or more | 10 dB or more | Headroom between a sensor’s weakest leg and the noise floor. |
Each pair must be internally consistent — Good has to be at least as demanding as Ok. Where it is not, the dialog explains the problem under that card and Save is unavailable until it is fixed. Packet count and size must be at least 1.
Reset to defaults restores every value in the table above. Cancel, the close control, clicking outside the dialog, and the Escape key all discard changes.
10Exporting the Report
A commissioning record you can hand over.
Select Export Report to download the current survey as a CSV file, named for the gateway and the date. It opens in any spreadsheet.
One row per sensor, carrying the name, address and type; the worst-leg signal, success rate and retries; the hop count and the full route; when the sensor was last heard; the battery level; the margin over noise; the test status; how many hops were measured; and any error message. Comment lines at the end record the gateway name, the export time, the link-test parameters, and the noise floor and peak if a scan has been run.
11Automations and Data
How Site Survey relates to the rest of the gateway.
Automations
Site Survey does not appear on the Automations page. It publishes no events for other apps to react to, and offers no actions that can be triggered by one. This is deliberate: every action it performs puts traffic on the shared radio, and a noise scan stops the gateway hearing sensors entirely. Neither belongs on a timer.
A survey is something an installer runs deliberately, reads, and acts on.
What it reads
Everything the app shows comes from data the gateway already holds:
- The whitelisted sensor list, with each sensor’s name, type, battery level and last-seen time.
- The mesh routes and per-hop link measurements the gateway stores when a test runs.
- The gateway’s own name, for the header and the exported report.
It writes nothing to your telemetry history, and it never changes a sensor’s configuration. Its own storage holds only your thresholds, a record of each full survey, and the noise scans.
Other pages
The gateway’s own Mesh Map page draws the same underlying route and link data as a diagram. Site Survey grades it and compares sensors; the Mesh Map visualises the topology. Running a test in Site Survey updates what the Mesh Map shows.
12Troubleshooting
Symptoms seen in the field, and what they usually mean.
| Symptom | Likely cause | Fix |
|---|---|---|
| A sensor sits on Waiting for check-in for a long time | Normal. The sensor is asleep and nothing is on the radio yet. | Wait. It can take up to an hour. If it passes about two hours it will fail with a message naming the cause. |
| Several sensors come back Partial | The link test is outlasting the short window the sensors stay awake for. | Lower Packet count in Survey Settings and retest. |
| Every sensor looks weak at once | Often the site, not the sensors. | Run Scan Noise Floor. A raised floor calls for a repeater or shorter links; reorienting antennas will not help. |
| The list is empty | No sensors are whitelisted on this gateway. | Whitelist them on the gateway’s Sensors page. Site Survey only lists whitelisted sensors. |
| Test All Sensors is unavailable | Either a test is already outstanding, or this gateway does not provide the mesh-testing service. | Hover the button for the reason. If the gateway lacks the service, update the gateway. |
| The RF Environment panel is missing entirely | This gateway does not provide the radio-scanning service. | Update the gateway. Everything else in the app continues to work. |
| A scan is refused as busy | A link test is on the air. The scan would interrupt it. | Wait for the test to finish and scan again. |
| A retest is refused | The same sensor was tested within the last 30 seconds. | Wait the stated number of seconds. |
| A row shows old measurements next to a failed status | The failed test produced nothing, so the previous successful measurements are still shown. | Expected. The test card reports how many hops were measured; zero means nothing on the row is new. |
13Reference
Values, ranges and units in one place.
Units and ranges
| Value | Unit | Notes |
|---|---|---|
| RSSI, noise floor, peak | dBm | Always negative. Closer to zero is stronger. |
| Margin over noise | dB | Signal minus noise floor. Can be negative if a link sits below the floor. |
| Success rate | % | Packets received divided by packets sent, across the whole route. |
| Retries | count | Summed across every leg of the route. |
| Battery | % | As last reported by the sensor. |
| Packet count, packet size | packets, bytes | Minimum 1 each. |
Test status values
Not tested, Waiting for check-in, Tracing route, Link testing, Complete, Partial, Failed. Described in What the Status column means.
Grades
Good, Marginal, Poor, Untested. A row takes the worst grade of its four measured values. These grades are defined by your own thresholds, not by any published standard.
Route chips
GW is the gateway’s own radio. A Repeater chip is a mains-powered sensor relaying traffic onward. The final chip is the sensor’s own address, shortened. A route with no repeater chip is a direct link.