ncd IoT Sensor Integration with OPC-UA Server and Node-RED

Table of Contents

Introduction

This article will guide you through the process of using Node-RED to deploy a basic OPC-UA Server inside Enterprise IIoT Gateway or Enterprise IIoT Gateway Lite for ncd sensors, by creating an Information Model for the ncd sensor’s data and publishing it. All based on the node-red-contrib-opcua library.

In the case of this article we worked on the design of a dedicated node (subflow) to make the process more intuitive and dynamic.

OPC-UA (OPC Unified Architecture) is an evolution of OPC that addresses the limitations of previous versions. It was developed to provide a unified architecture and open standards for communication in Industrial Automation and other environments.

Among its features are:

  • Platform Independent: OPC UA is not tied to a specific platform and can run on various operating systems.
  • Security: Provides a robust set of security features, including authentication, authorization, integrity, and confidentiality.
  • Scalability: OPC UA is highly scalable and can be used in small and large systems, from embedded devices to enterprise environments.
  • Unified Information Model: Offers a unified information model that facilitates interoperability between different systems and devices.

Note:  We recommend Install a client for OPC UA servers, this will help you to see the server structure, and the values that each node has. For example the OPC-UA client called UaExpert, which is free and cross-platform or Prosys OPC-UA Browser.

IMPORTANT This article does not cover the process of securing the server to make it production ready, it will be configured in anonymous mode for testing purposes. You will find all documentation of the opc-ua library: https://github.com/mikakaraila/node-red-contrib-opcua

Architecture Overview

A visual representation of our basic ncd Sensor Data to OPC-UA Server architecture is shown in the drawing below:

Consisting of 6 major parts:

  1. Setup the NCD Enterprise IIoT Gateway / Lite. (https://ncd.io/blog/quick-start-guide-for-the-ncd-enterprise-iiot-gateway/)
  2. Access to Node-RED Instance.
  3. Setup the ncd-gateway-node and ncd-wireless-node to read the sensor data.
  4. Add and configure the ncd-opc-ua node (subflow) to set up, add folders, add variables, and update variable values.
  5. Configure the OpcUa-Server node.
  6. Test the OPC-UA Server with an OPC-UA Client.

Requirements

1.- Node-RED

Node-Red is a browser based no code/low code tool to connect hardware devices to each other as well as to cloud and database infrastructures. Every sensor packet creates a message (object) which flows down the connected nodes which can alter that message to suit your application, package it into a new protocol such as MQTT, Modbus or OPC-UA (as in this article), or send it directly to your cloud. Node-Red is pre-installed and running as a service in Enterprise IIoT Gateway and Enterprise IIoT Gateway Lite.

2.- Install node-red-enterprise-sensors library

  • Using npm, to install through the command line navigate inside ~./node-red directory on a computer with Node-Red already installed:
				
					npm install @ncd-io/node-red-enterprise-sensors
				
			
  • Or you can install this library through the Palette Manager in Node-Red’s UI:
Noder Red install NCD

3.- Install node-red-contrib-opcua library

A Node-RED node to communicate via OPC UA based on the node-opcua library.

  • Using npm, run the following command in your Node-RED user directory – typically ~/.node-red:
				
					npm install node-red-contrib-opcua
				
			
  • Or you can install this library through the Palette Manager in Node-Red’s UI:

4.- Setup ncd-opc node (subflow)

Copy JSON

Go to our Community GitHub page using this link: https://github.com/ncdcommunity/node-red-ncd-opcua/blob/main/ncd-opcua.json

Then copy the JSON code from click on the “Copy raw file” button.

Import JSON to your workspace

In Enterprise IIot Gateway go to Node-RED Instance, then go to the main menu and select the “Import” option from the main menu:

A field will be opened. Right click and paste the JSON code you just copied:

Node RED pasting json code

You will see the JSON code, now you can press the red “Import” button at the bottom right (by default the “current flow” option is selected):

Node RED node import

In the upper part of the node editor, you will see information of the subflow you just imported, and automatically you will have the ncd-opcua (subflow) available inside the node editor, now you can position it inside the editor (workspace) by left clicking:

You may also notice that the ncd-opcua (subflow) has been added to the NCD node group.

Configure ncd sensors

Node RED NCD node types

The next step is to configure your ncd nodes, To obtain the data from the ncd sensors inside Node-RED it is necessary to configure the ncd-wireless-gateway and ncd-wireless-device nodes, depending on the type of sensor you have. (you may have already configured your nodes), but it is important to remember that this procedure could work for other types of ncd-sensors:

Once the nodes are configured, if you connect a debug node to the output of the ncd-wireless-device node, and it is configured as “complete msg object” in Output property:

You will see something like the following in the debug tab:

This is the structure or object that sends the sensor, which contains all the information of interest of the sensor, such as; nodeId, firmware version, battery (voltage), battery percent, sensor type, sensor name, sensor data, address, timestamp, among others.

We are going to focus on the part of this information to expose in our OPC-UA Server, which will be:

  • MAC address.
  • Payload (contains the main variables).

Connect ncd-opcua node

Once you have your ncd-sensor configured, the next step is to connect the sensor output (node) to the ncd-opcua (subflow) input:

Note: two sensors have been configured to show that it is possible to connect sensors of the same type to the input of the ncd-opcua node.

If you double left click on the ncd-opcua node (subflow) you can open the settings:

  • Name: you can assign an identifier to the ncd-opcua (subflow), and this will only serve to identify your specific node within the workspace (to differentiate it from other nodes).

Setup OPC-UA Server node

When installing the “node-red-contrib-opcua” library, the following nodes are automatically installed:

But we are going to focus on the “OpcUa-Server” node, which is the one that will allow you to configure an OPC-UA server through Node-RED, which has the following characteristics:

Creates OPC UA server with own variables, object structures and methods to endpoint: opc.tcp://localhost:PORT/ResourcePath/

Parameters PORT and ResourcePath can be given for the server.

File that contains username, password and role.

Register to local Discovery Server, if true => OPC UA Server will register itself to opc.tcp://localhost:4840

ConstructDefaultAddressSpace, if false then Server AddressSpace will be empty (no VendorName and sub objects)

Server active endpoints from security mode and policy:

Security mode: None Sign SignAndEncrypt

Security policy: Basic128-Rsa15 | Basic256 | Basic128-Sha256

maxSessions: Maximum number of sessions allowed by the server, default 20. Changing might impact performance.

This node has the following OPC UA server commands:

  • restartOPCUAServer
  • addEquipment
  • addPhysicalAsset
  • setFolder msg.topic = “folderName” // Example topic format ns=1;s=FolderName (note: uses this as parentFolder)
  • addFolder msg.topic = “ns=1;s=NewFolder” // Note parent folder is objects if not set by setFolder, newFolder is set to parentFolder
  • addVariable msg.topic = “ns=1;s=VariableName;datatype=Double” // parent folder is set above
  • installHistorian msg.topic = “ns=1;s=VariableName;datatype=Double
  • installDiscreteAlarm msg.topic = “ns=1;s=VariableName;datatype=Double” parentObject msg.alarmText for the alarm, msg.priority for alarm severity
  • installLimitAlarm msg.topic = “ns=1;s=VariableName;datatype=Double” parentObject msg.hh=highhighLimit, msg.h=highLimit, msg.l=lowLimit, msg.ll=lowlowLimit
  • addExtensionObject msg.topic = “ns=1;s=VariableName;datatype=ExtensionObject;TypeId=ns=3;i=1001
  • deleteNode msg.payload = “ns=1;s=VariableName”
  • registerNamespace msg.topic = “www.acme.com” output msg.payload = ns=index
  • getNamespaceIndex msg.topic = “www.acme.com” output msg.payload = ns=index
  • getNamespaces output msg.payload = { nsuri1: 1, nsuri2: 2, … }
  • setUsers msg.topic = “” msg.users JSON structure of users (username, password role)
  • addFile msg.topic = “ns=1;s=test.txt” // Note parent folder is objects if not set by setFolder/addFolder
  • saveAddressSpace msg.filename =”./test.xml” // Saves current AddressSpace into the given filename. If msg.topic used, it should contain namespace index that will be saved.
  • loadAddressSpace msg.filename =”./test.xml” // Load AddressSpace from the given filename.
  • bindVariables Bind same node.send(msg) callbacks to get/set methods as addVariable
  • bindMethod msg.topic = nodeId, msg.code can be given in function node that contains method function

Node: you can use the documentation of the “node-red-contrib-opcua” library to configure a custom OpcUa-Server node for your application.

Copy node example

For this article we have used the basic configurations to test the server, to use the example, you must copy the following JSON code with the copy button at the top right of the code box:

				
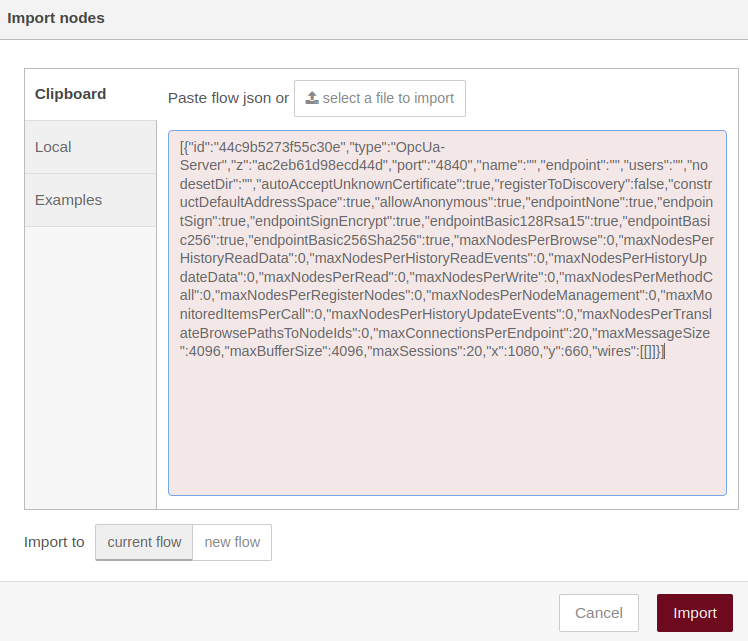
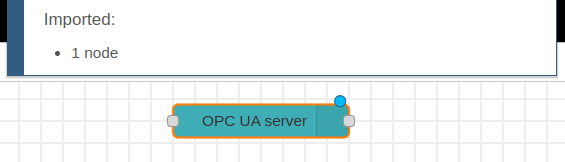
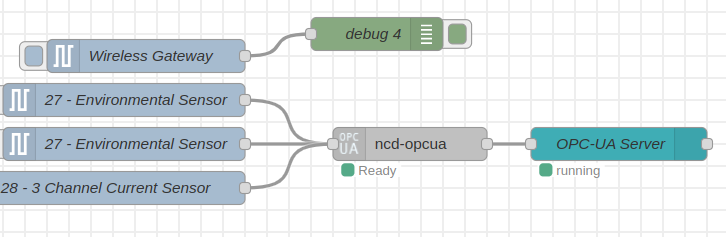
					[{"id":"337ec04899f1069d","type":"OpcUa-Server","z":"ac2eb61d98ecd44d","port":"4840","name":"OPC-UA Server","endpoint":"","users":"","nodesetDir":"","autoAcceptUnknownCertificate":true,"registerToDiscovery":false,"constructDefaultAddressSpace":true,"allowAnonymous":true,"endpointNone":true,"endpointSign":true,"endpointSignEncrypt":true,"endpointBasic128Rsa15":true,"endpointBasic256":true,"endpointBasic256Sha256":true,"maxNodesPerBrowse":0,"maxNodesPerHistoryReadData":0,"maxNodesPerHistoryReadEvents":0,"maxNodesPerHistoryUpdateData":0,"maxNodesPerRead":0,"maxNodesPerWrite":0,"maxNodesPerMethodCall":0,"maxNodesPerRegisterNodes":0,"maxNodesPerNodeManagement":0,"maxMonitoredItemsPerCall":0,"maxNodesPerHistoryUpdateEvents":0,"maxNodesPerTranslateBrowsePathsToNodeIds":0,"maxConnectionsPerEndpoint":20,"maxMessageSize":4096,"maxBufferSize":4096,"maxSessions":20,"x":1080,"y":660,"wires":[[]]}]


Then go back to the node-red instance and in the main menu, select the “Import” option (ctrl-i), next is to paste the JSON code in the main box and click the “Import” button:

You will see a dialog box showing the nodes that have just been imported into your workspace.

Some of the OpcUa-Server node configurations are:

  • Port: 4840: OPC UA port for UDP communication is 4840. This is the default and recommended port for broadcast, multicast and unicast communication. Alternative ports may be used.
  • Name: OPC-UA Server
  • Users file: blank, but you can add one that contains username, password and role.
  • Auto Accept Unknown Certificates: true.
  • Build default AddressSpace: true
  • Allow anonymous user: true
  • Security mode: None: true

Connect everything

The next step is to connect the output of the “ncd-opcua” node to the input of the “OPC-UA Server” node:

Then you need to make DEPLOY, in order to save and apply the changes made as well as to start the OPC-UA server locally on the Enterprise IIoT Gateway.

Status

As soon as the deploy is executed, you will be able to observe different statuses of each of the nodes (ncd-opcua and opcua-server), which represent the following:

  1. ncd-opcua: Waiting, is an initial waiting status, it indicates to the user that it is waiting for a programmed time for the OPC-UA server to start.
  2. ncd-opcua: Ready, is a status that indicates to the user that the node is ready to receive data from ncd sensors to process them and send them to the “Opc-Ua-Server” node.
  3. Opc-Ua-Server: Not running, is a status that indicates to the user that the server is not running, this could be because it is restarting and verifying the configurations.
  4. Opc-Ua-Server: running, is a status that indicates to the user that the server is running with the specified configurations.

The natural sequence of the status of each node when executing deploy is as follows:

Therefore, if everything is correct, at the end of the start sequence you should be able to see the “Ready” and “running” statuses respectively.

Testing with OPC-UA Client

At the end of the startup sequence, you can connect a client to the OPC-UA server to verify the “Address Space” that has been generated, in this case, as soon as the “ncd-opcua” node is started, a namespacencd.io” is registered and the NCD object or folder is created, which we can verify from an OPC-UA client.

To connect from an OPC-UA client to the server, we use as Endpoint Url parameter: opc.tcp://localhost:4840

When you start and connect the client you will see in the “Address Space” the “NCD” folder:

Inside this folder there is no data for the moment, this is because we must wait for data to be received from any of the sensors, as soon as a data is received, we will be able to observe the status “Sending” in the node “ncd-opcua” indicating that a data has been received from any of the sensors and that it is being structured and sent to the OPC-UA-Server node:

As soon as the data is structured and sent to the “OPC-UA Server” node, you will see the status of the “ncd-opcua” node in “Ready”:

Now if you go back to the optional client window and perform a “Refresh” or “Rebrowse”. You can see the “Address Space” structure that has been generated within the OPC-UA server, in this case the ncd sensor identifier, then within this the MAC address of the sensor, and finally the identifiers of the sensor variables that are part of the Payload:

If you wait until each of the data from the sensors connected to the “ncd-opcua” node is successfully received and return to the opcua client window, applying a “Rebrowse”, you will be able to see the complete “Address Space” of each ncd sensor:

You can access the “Data Access View” to observe each of the variables and characteristics that are received from the OPC-UA server:

Summary

In this article we presented how to deploy a basic OPC-UA server, but this time with the help of the ncd-opua node, which facilitates the creation of Address Space for an OPC-UA server, we use OPC-UA clients to verify the structure and data exposed in a local network. Again we emphasize to use the content of this article as a basis for the development of your own OPC-UA server, with your own requirements (that is why we provide the ncd-opcua subflow node available to be modified internally). All this always keeping in mind the importance of IT security before exposing your data.

With Node-RED pre-installed on the Enterprise IIoT Gateway and Enterprise IIoT Gateway Lite, it is possible to flexibly condition our data for use with IIoT protocols as in this case. We have worked on providing a basic, open and intuitive subflow to make it possible for you to dynamically adapt or condition the data provided by your ncd sensors received by the Enterprise IIoT Gateway and adapt it to your OPC-UA application.

Thanks,  Eduardo M.