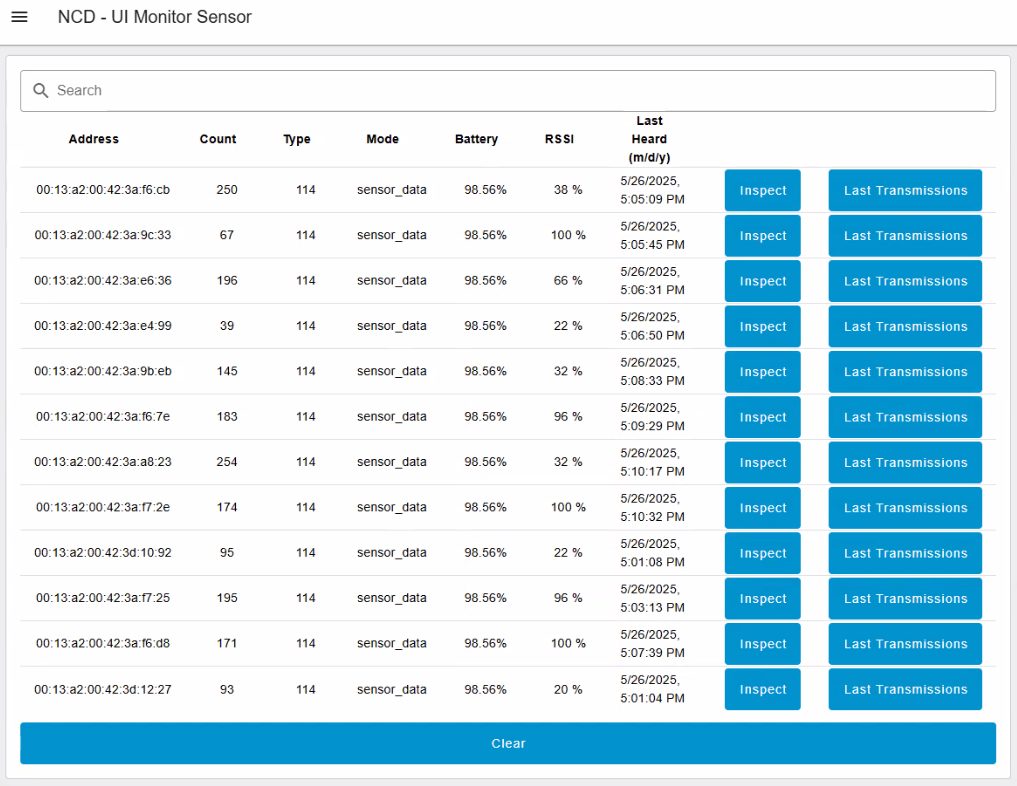
This Tool is a Node-RED node developed by the NCD IoT Team based on the Node-RED tool and the new Dashboard 2.0 framework. It allows you to visualize the data provided by NCD sensors in a DigiMesh network, including Address, Counter, Type, mode, Battery percentage, RSSI (DigiMesh), sensor data, and the date and time of the last incoming message in an intuitive way.
Requirements
Before you begin using the NCD-Dashboard, you’ll need to have the following software installed:
Node-RED
@ncd-io/node-red-enterprise-sensors Library
@flowfuse/node-red-dashboard
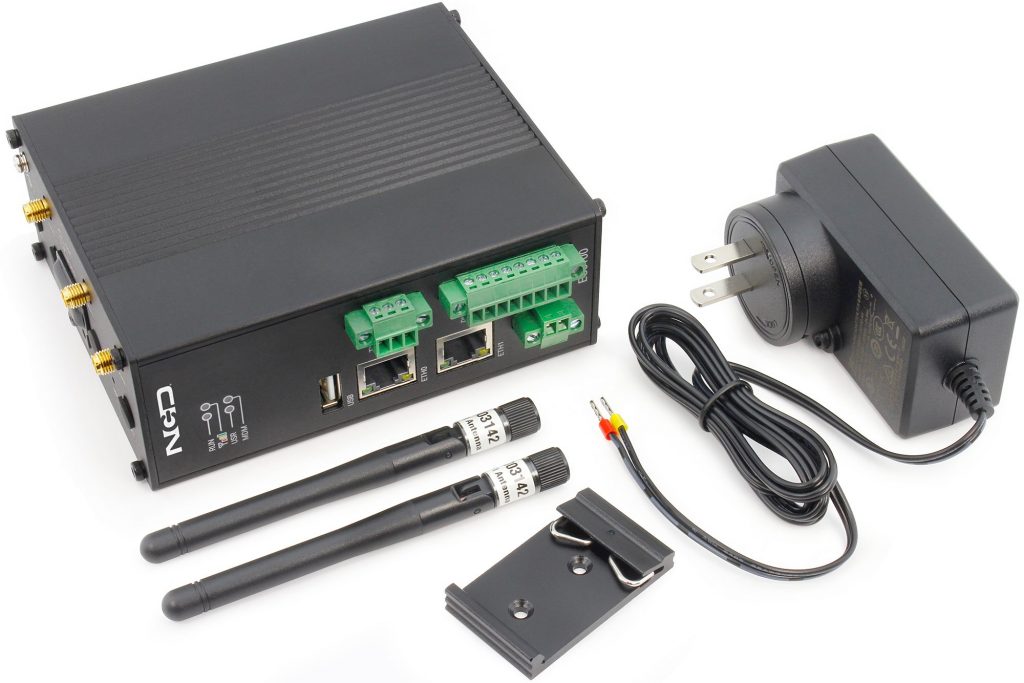
Note!The Enterpsrise IIoT Gateway and The Enterpsrise IIoT Gateway Lite come with Node-RED tool and NCD Enterprise Sensor Library pre-installed and ready to use.
Node-RED, is a visual programming tool, It provides a browser-based editor that allows creating applications by wiring predefined black box functions (nodes) . Despite its technical nature, Node-RED offers a user-friendly interface. Node-RED is an open-source project under the OpenJS Foundation. This means it’s free to use, without any monthly subscription fees. You can install and run Node-RED locally on your PC, or, in the case of our Enterprise IIoT Gateway, it comes pre-installed and runs as a service.
NCD Enterprise Sensor Library
This library handles communication to, and configuration of, the NCD Wireless Sensor Line. It can be used in conjunction with Node-RED to create and manage a Wireless Sensor Network using the Node-RED flow-based development tool on any platform.
NoteThis library is pre-installed on the Enterprise IIoT Gateway and ready to use.
FlowFuse Dashboard 2
FlowFuse Dashboard 2.0 is an easy to use collection of nodes for Node-RED that allows you to create data-driven Dashboards & data visualizations. Installation procedure is similar to the previous one, FlowFuse’s Node-RED Dashboard 2.0 is also available in the Node-RED Palette Manager.
Installation Procedure
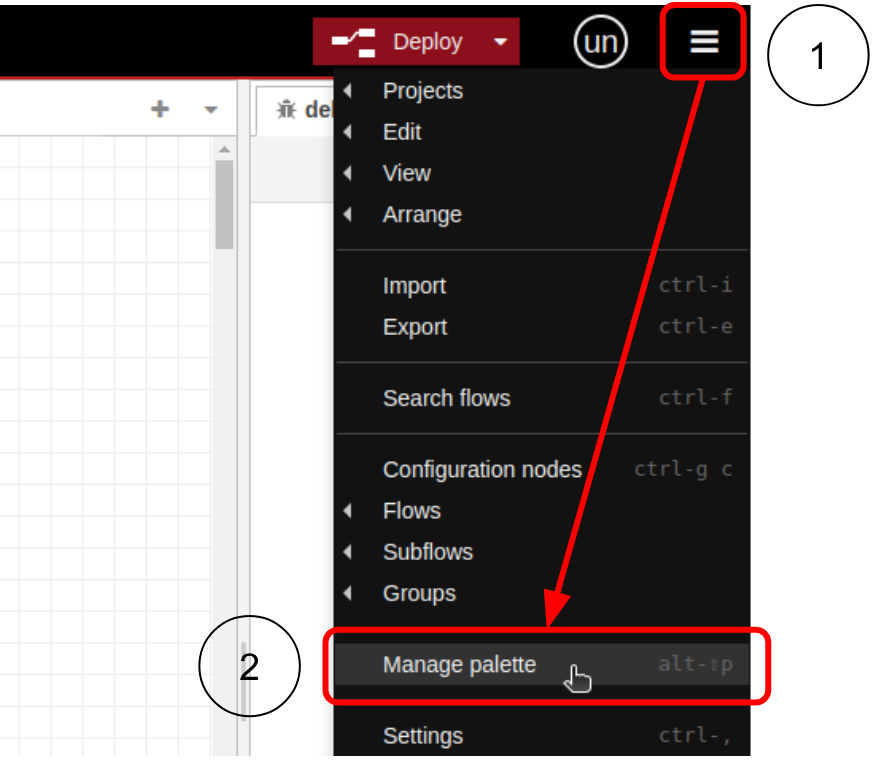
Step 1.- Open the menu in the top-right of Node-RED, then Click “Manage Palette”:
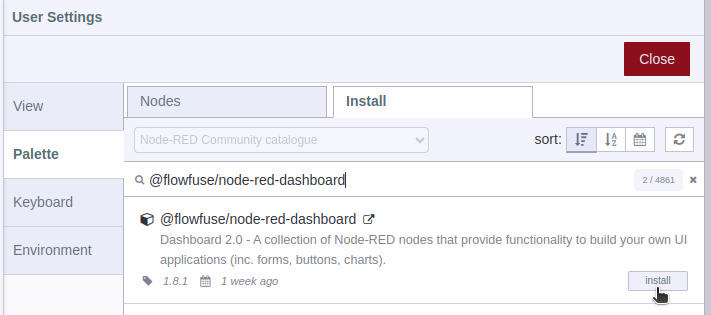
Step 2.- Switch to the “Install” tab, Search “@flowfuse/node-red-dashboard”, Install the package:
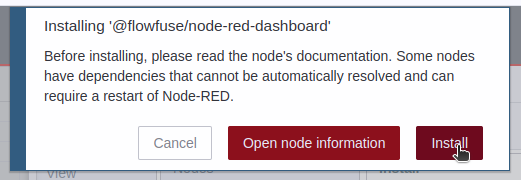
Step 3.- You must confirm the installation by clicking on the Install button in the pop-up window.
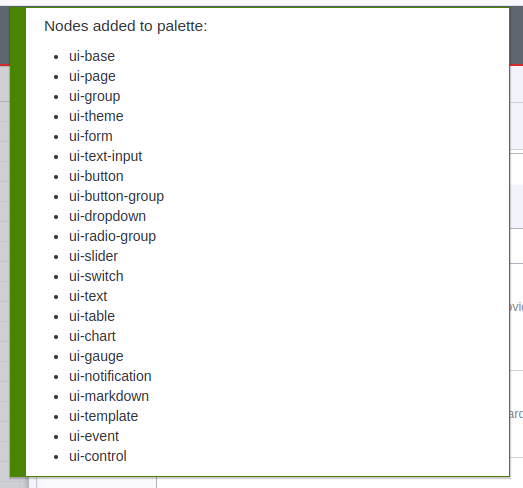
Step 4.- You will see a list of the dashboard 2 nodes that have been installed.
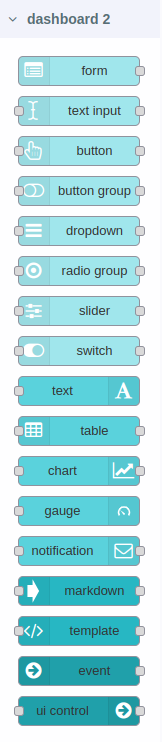
Step 5.- In workspace you can see the available nodes in the nodes palette, as shown in the following image:
See the following GIF for a visual demonstration of the installation process:
Importing Node
After successfully installing Dashboard 2.0, you’re ready to import the NCD UI Sensor Monitor. The process is straightforward, but be sure to follow these steps carefully:
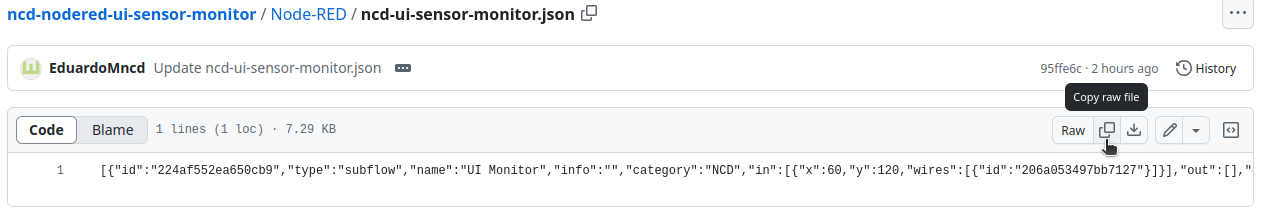
Copy the JSON: Locate the “ncd-ui-sensor-monitor” JSON file.
Import the JSON: Within Node-RED, use the import function to bring in the copied JSON file.
This will import the NCD Dashboard elements into your Node-RED workspace, allowing you to visualize and interact with your NCD sensor data.
With the NCD Dashboard source code copied, head back to the Node-RED node editor and follow these next steps carefully.
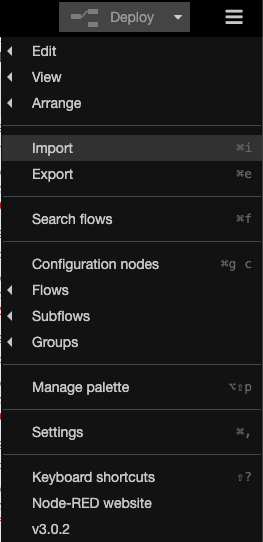
Go to the Main Menu (icon in the upper right corner) then click on “Import” option, as shown in picture:
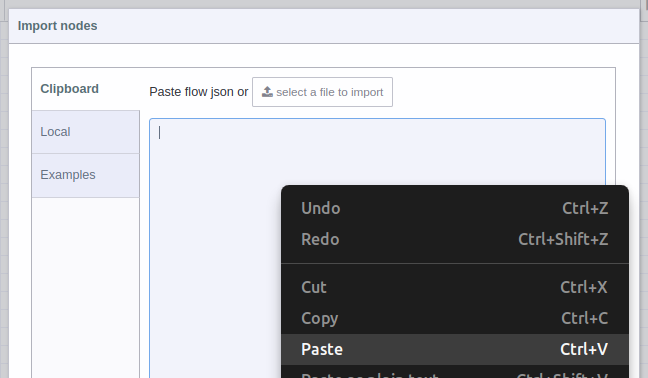
2. A text-box will be opened. Right click and paste the code you just copied from GitHub, as shown in picture:
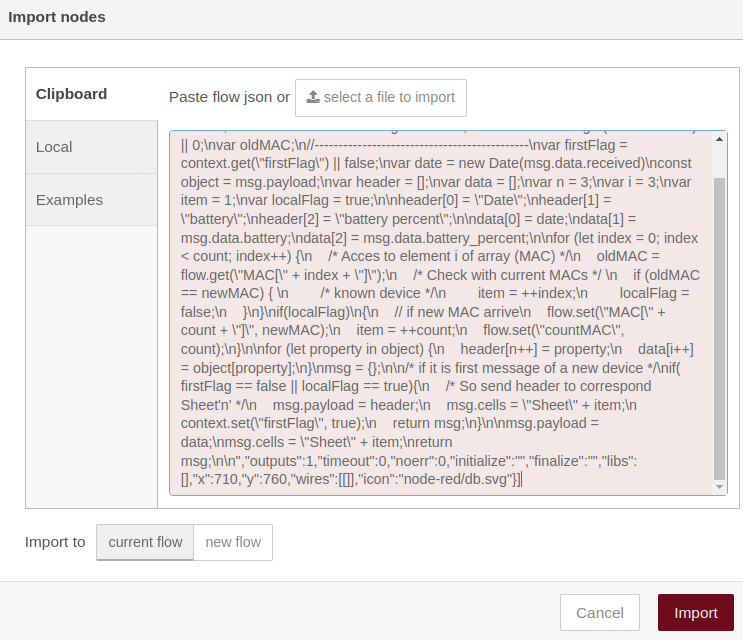
3. You should see the JSON code in text-box, now you can press the red “Import” button at the bottom right (by default the “current flow” option is selected):
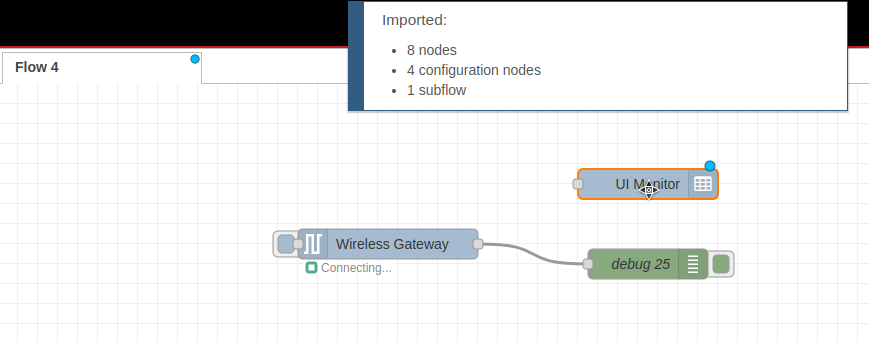
4. In the top of the Node-RED editor, you will see information of the NCD-UI-Monitor you just imported, and automatically you will have the node available inside the node editor, now you can position it inside the editor or workspace by left clicking:
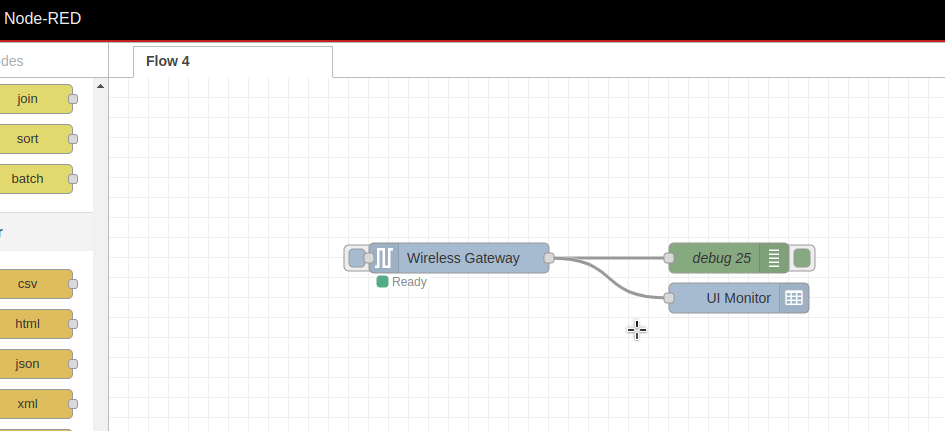
5. You will need to connect the output of the “Wireless Gateway” node to the input of the “UI Monitor” node.
NoteIn order to enable the RSSI for incoming packets, it is necessary to enable it in the 'Wireless Gateway' node. Please follow these instructions.
Click to Expand
First, double-click on your ‘Wireless Device’ node to open the node properties. Then click on the pencil icon to Edit ‘ncd-gateway-config config’ node.
Click to Expand
Then you will see the ‘ncd-gateway-config’ node properties.
Click to Expand
You should enable the ‘Add RSSI to incoming packets’ box, then click on ‘Update’ button, and ‘Done’ button.
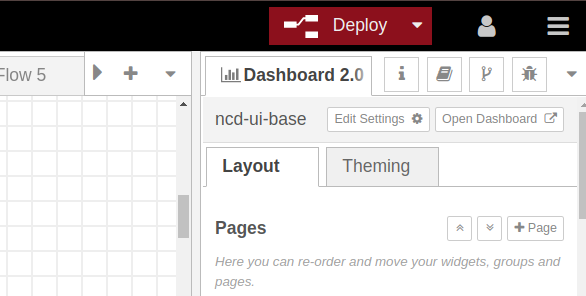
6. This flow includes a Wireless Gateway node pre-configured with the Enterprise IIoT Gateway port, you should click on “Deploy” button in order to save and apply the changes:
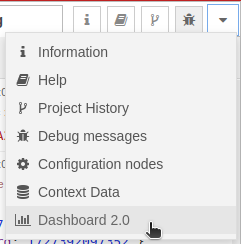
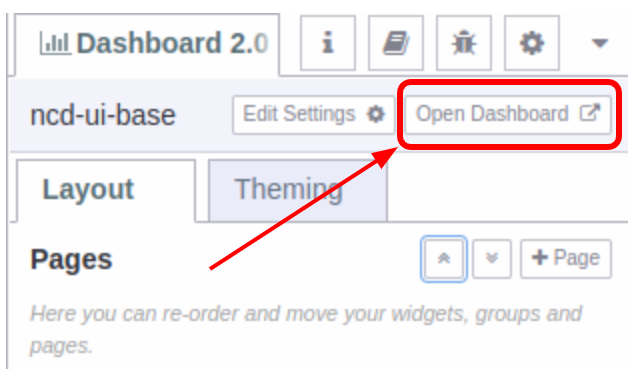
7. Then go to “Dashboard 2.0” tab:
8. And click on “Open Dashboard” button, in order to open the Dashboard in a new Web Explorer Tab:
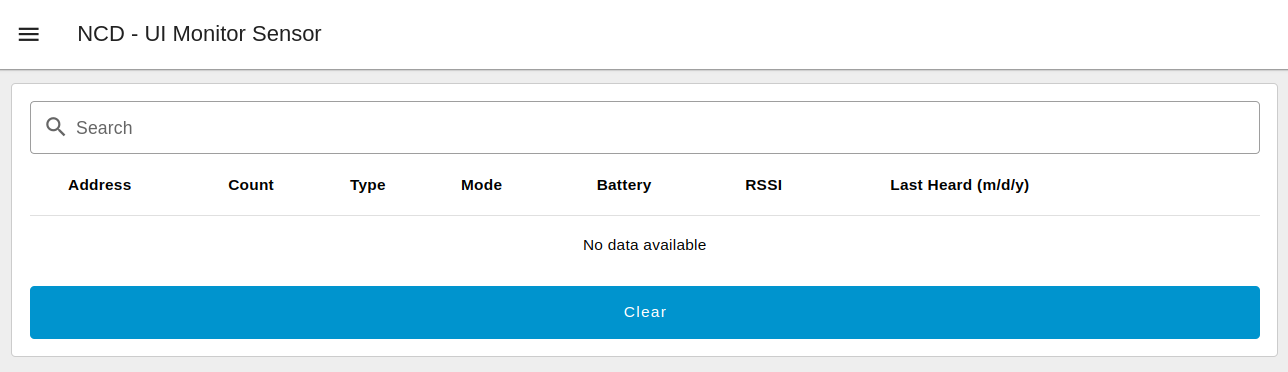
NCD UI Monitor Sensor
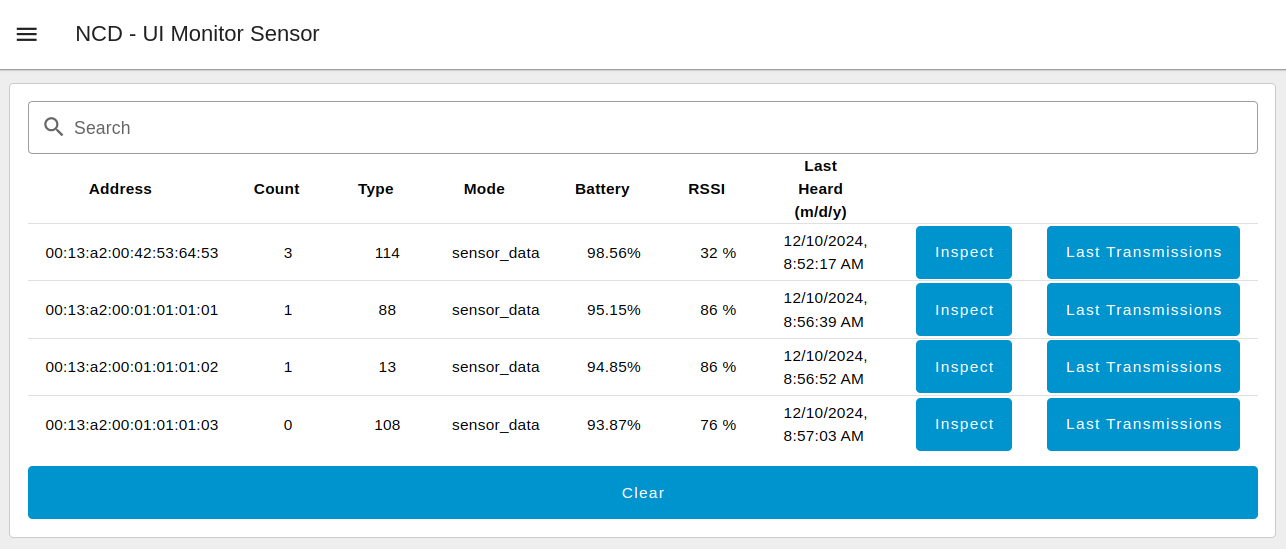
You should see something like this, and as soon as a new NCD Sensor data arrive, you should see the info:
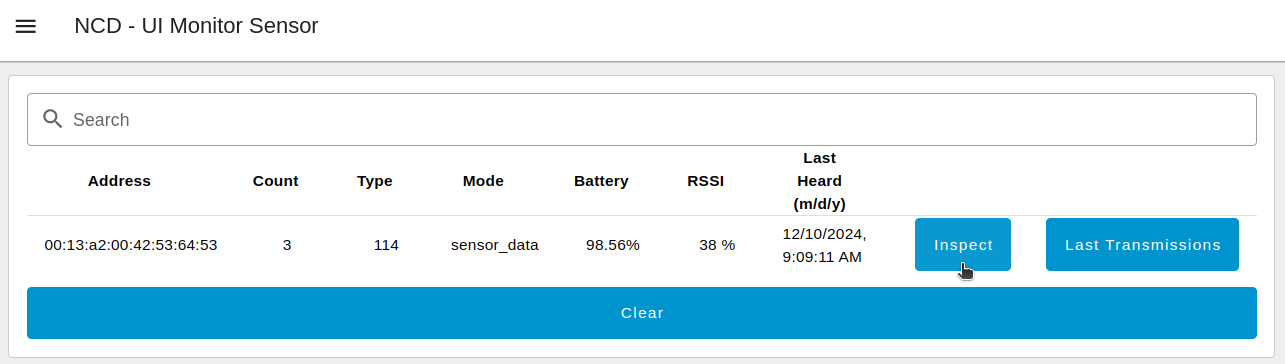
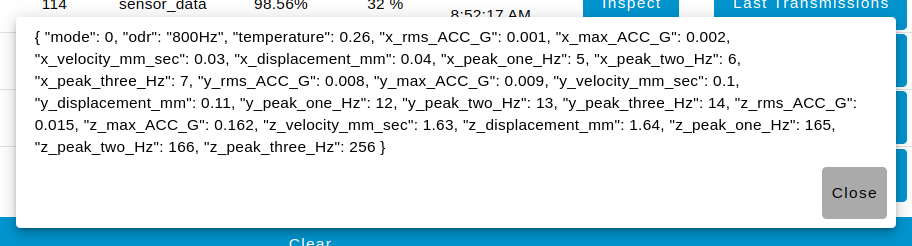
Inspect
Using the “Inspect” button you can display the NCD sensor data in JSON format. As long as the message mode is “sensor_data”.
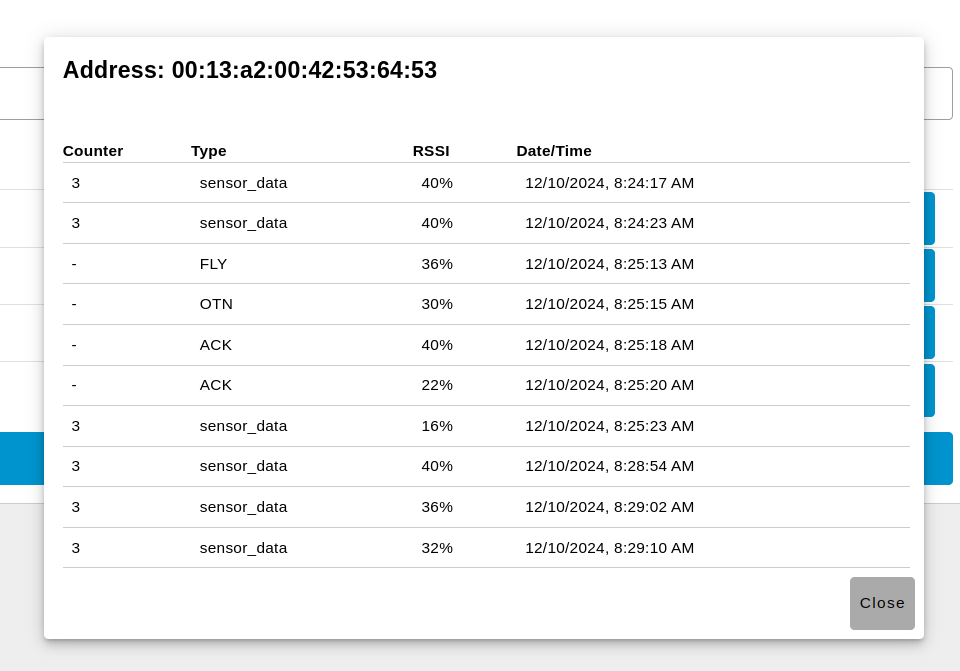
Last Transmissions
It is possible to view the last ten data points emitted by the sensor in a pop-up window. The stored data includes the counter, message type, RSSI, and the date and time. This feature allows users to visualize the most recent sensor messages in a clear, graphical format.
Clear
It is also possible to clear the message display using the ‘Clear’ button. This action will delete the sensor data from the dashboard.