Current and voltage monitoring of Industrial Electrical Equipment such as motors, transformers, generators, batteries, photovoltaicplants, windturbines, among others, is essential to ensure the proper functioning of these assets and help maintain the most efficient production flow, bringing more reliability to the industrial plant.
By using IIoT current and voltage monitoring devices to track the health of machinery, it is possible to identify early failures, plan maintenance actions and recognize windows of improvement. From these analyses, it is also possible to drastically reduce the costs of repairing or replacing electric motors, reduce the MTBF (mean time between failures) of the industrial plant’s electrical assets and increase the availability of the machinery.
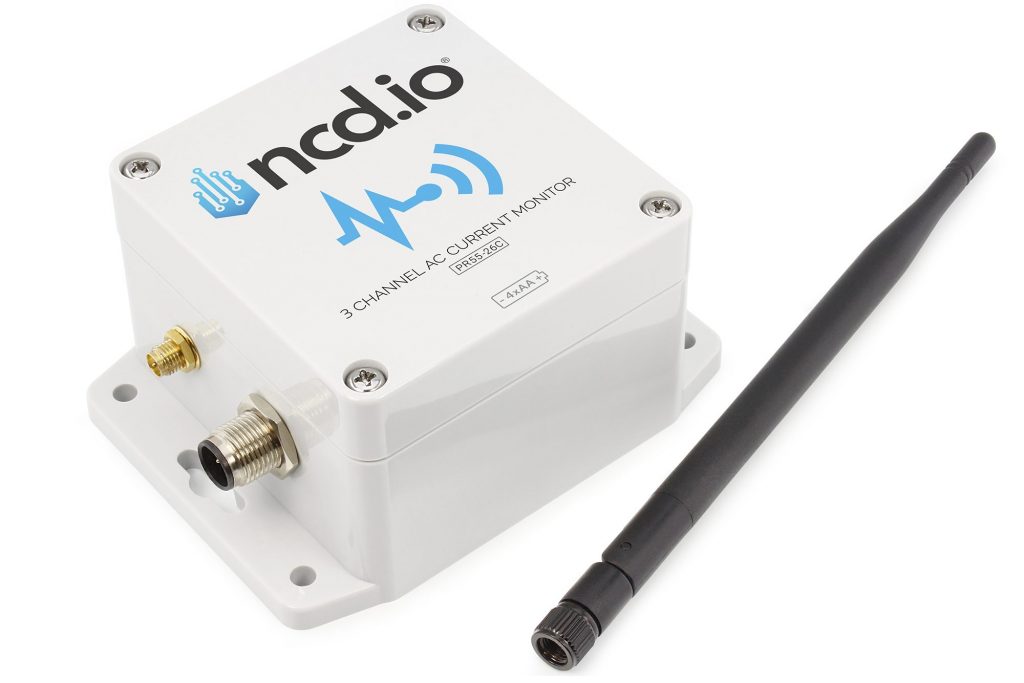
AC Current Monitor Sensor
With the rapid growth and adoption by the Industrial IoT, wireless long distance current monitoring equipment has been developed that integrates with any cloud service for analysis or visualization using Node-RED for example. These compact, low power consumption IIoT devices/sensors can be easily installed on equipment or power lines to monitor certain parameters such as current, voltage and power usage.
Are examples of an IoT sensors used to monitor current and calculate power. This transmitter sensor works in conjunction with split-core current sensors. It samples current at a high data rate, calculates the RMS value of the current and sends a wireless transmission.
If you’d like to learn more about the benefits of industrial IoT solutions based on AC current monitoring, we’ve written a comprehensive article that you might find interesting. Click the following link: AC Current Monitoring – Industrial IoT Solutions and Benefits
This post pretends to introduce the main features of our current ncd-dashboard and offer the instructions to setup this dashboard (import, config and connect) to your Node-RED Instance, this solution pretends to offer a visual tool to start working with the sensor in an easy and intuitive way.
Overview
The next image is a visual representation of the ncd AC Current Monitor Dashboard Architecture. The sensor(s) collect the data of interest from the field elements, and then send the signal via Digi-Mesh to the Enterprise IIoT Gateway, where it is processed by Node-RED and then sent to the ncd-dashboard for storage and intuitive visualization.
IMPORTANT
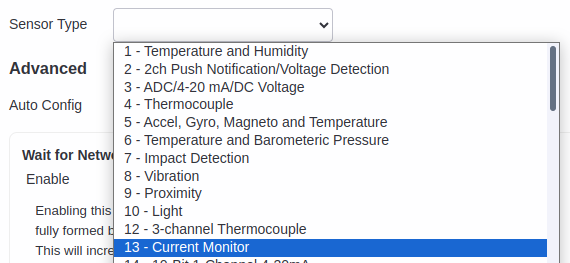
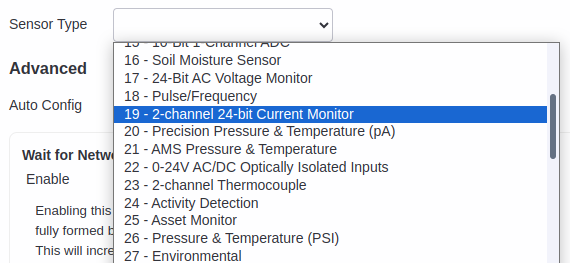
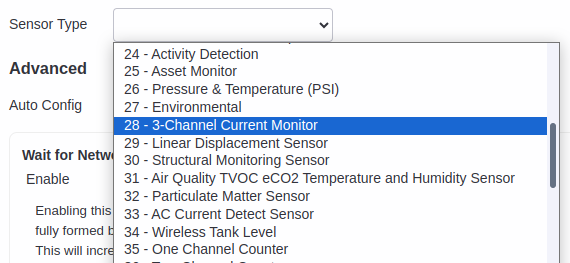
This ncd-dashboard is designed to work exclusively with 13, 19 and 28 type, which correspond to Industrial IoT Wireless AC Current Monitor Sensor (1, 2 and 3 Channels).
It identifies the MAC Addresses of the devices connected to the node, they are listed in a Dropdown and by selecting the device (MAC) the data is loaded to the Dashboard.
Data Inspection (Object)
Function to inspect from the dashboard the objectdata coming from the sensor(s).
Local Datalogger
Generation and storage in local (or user-defined) path of CSV file with data from the sensor(s).
Data loading
Dynamic loading of data to graphs and gauges from local CSV files.
CSV Download
Function to download CSV files from web browser by user-defined date.
Requirements
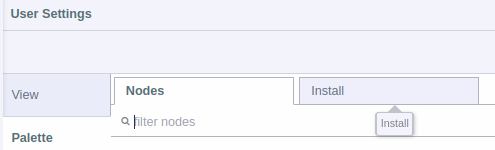
To import this subflow it is necessary to have previously installed:
Node-RED
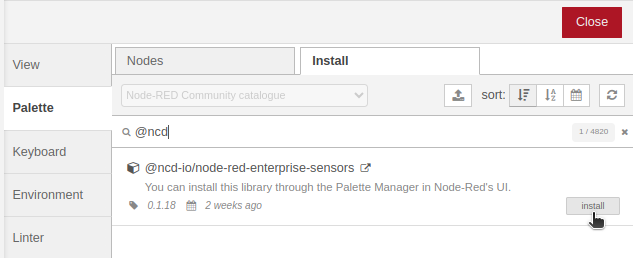
@ncd-io/node-red-enterprise-sensors
@flowfuse/node-red-dashboard
Node-RED Instance
Node-Red is a low code browser based tool to connect hardware devices to each other as well as to cloud and database infrastructures.
Every ncd-sensor packet creates a message (object) which flows down the connected nodes which can alter that message to suit your application, package it into a new protocol such as MQTT, Modbus or OPC-UA, or send it directly to your Cloud (Azure, AWS, Ubidots, Losant, direct injection into an SQL or NoSQL database, IgnitionSCADA and many other options).
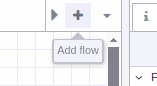
(Optional) – Go to Node-RED, you can add a new flow in the node editor of node-red.
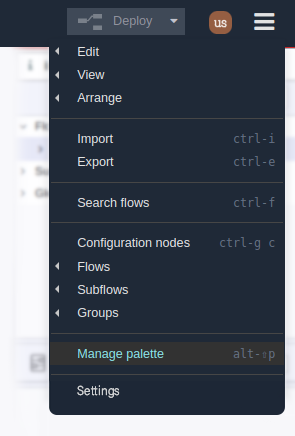
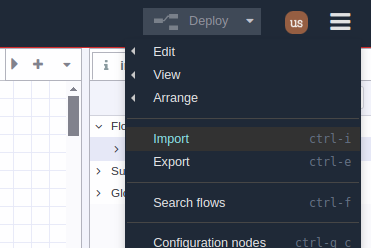
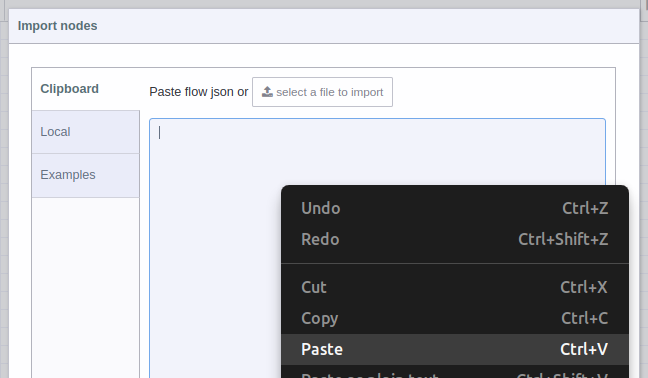
Then, go to the main menu, select the “Import” option:
A text-box will be opened. Right click and paste the JSON code you just copied from GitHub:
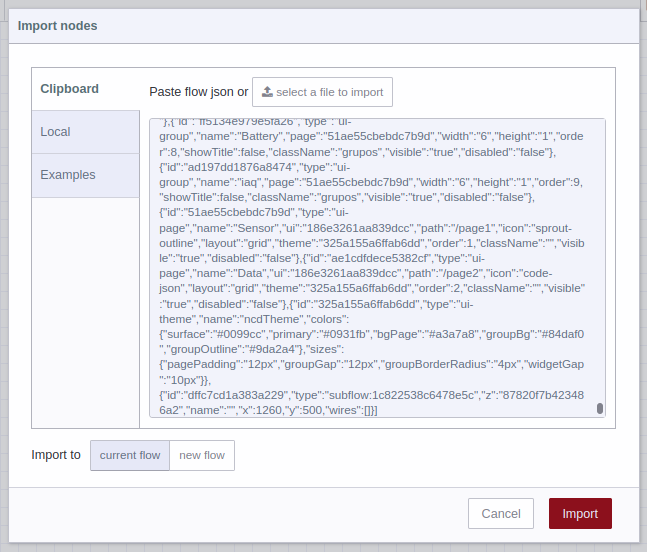
You should see the JSON code in text-box, now you can press the red “Import” button at the bottom right (by default the “current flow” option is selected):
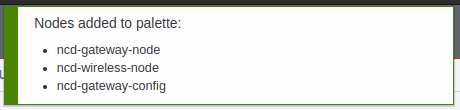
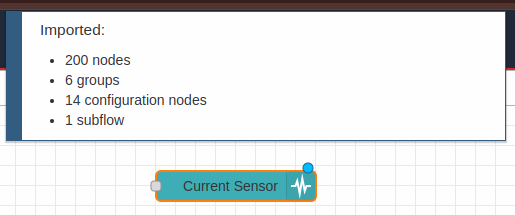
In the top of the Node-RED editor, you will see information of the subflow you just imported, and automatically you will have the subflow (node) available inside the node editor, now you can position it inside the editor or workspace by left clicking:
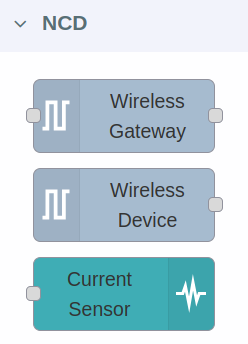
You may also notice that the subflownode has been added to the NCD node group.
NCD node Configuration
The next step is to configure your ncd nodes (you may have already configured your nodes), but it is important to remember that this ncd-dashboard only works for the Industrial IoT Long Range Wireless AC Current Monitor Sensor 1, 2 and 3 Channels type:
1) For Type 13 Current Monitor
2) For Type 19 Current Monitor
3) For Type 28 Current Monitor
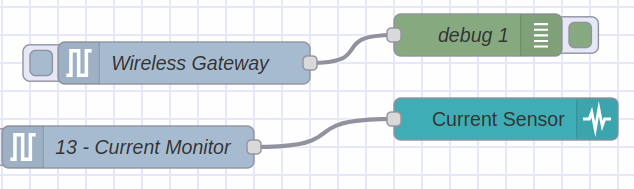
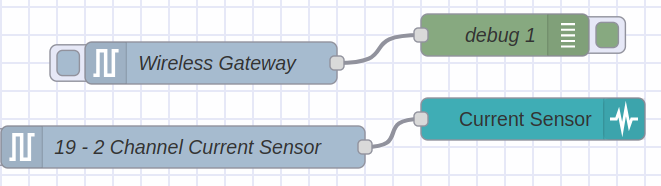
Once you have the Industrial IoT Long Range Wireless AC Current Monitor Sensor node configured, the next step is to connect the sensor output (node) to the subflow (node) input:
1) For Type 13 Current Monitor
2) For Type 19 Current Monitor
3) For Type 28 Current Monitor
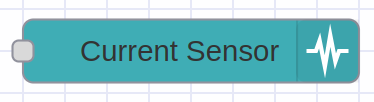
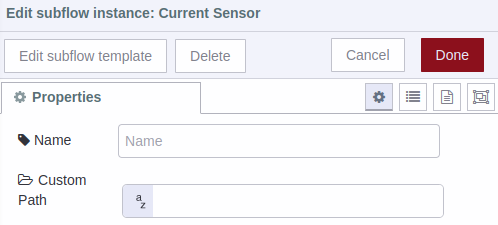
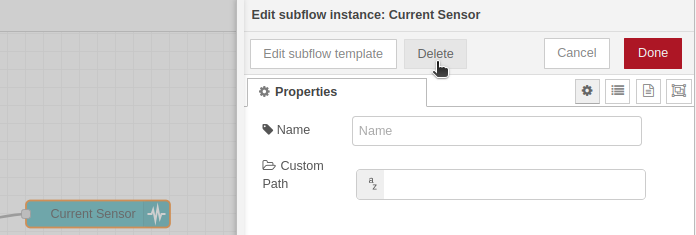
If you double left click on the subflow (current-ncd-dashboard) you can open the settings:
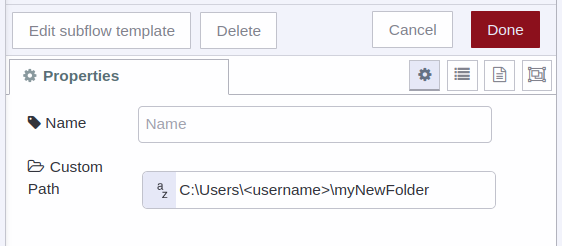
Name: You can assign an identifier to the subflow, and this will only serve to identify your specific flow within the node editor (to differentiate it from other nodes).
Custom Path: This property by default is static, that is, the subflow takes the data coming from your AC Current Monitor Sensor and will store it in a local location inside Node-RED:
Automatically the subflow stores the generated csv files of the sensor(s) inside the Node-RED folder.
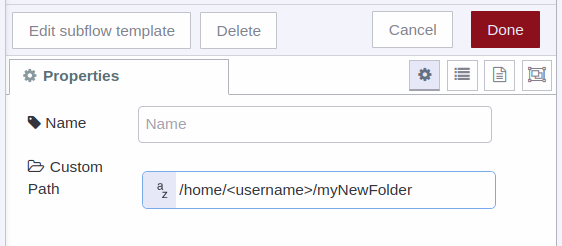
Note: So by default it is not necessary to assign a value to this property, but, if for some reason you need the data generated by the sensor to be stored in another local location, then you can assign this property to that new location and the stream will now take that path to store the data:
1) For Linux
2) For Windows
Click on the Deploy button , in order to apply the changes to our flow, it is located at the top right of the Node-RED flow editor:
Node Status
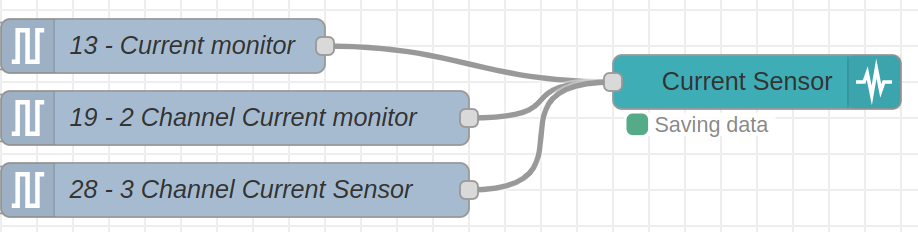
1.- If the path you enter is correct or you leave the default path (leaving the property text field blank), then when new data arrives through the sensor at the subflow input you should be able to see that the data is being stored correctly (Saving data message).
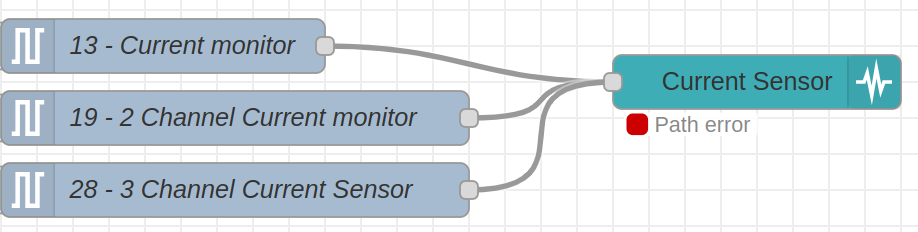
2.- You must be careful to assign a valid route because if the subflow (node) detects that it is not a valid route it will display Path error message.
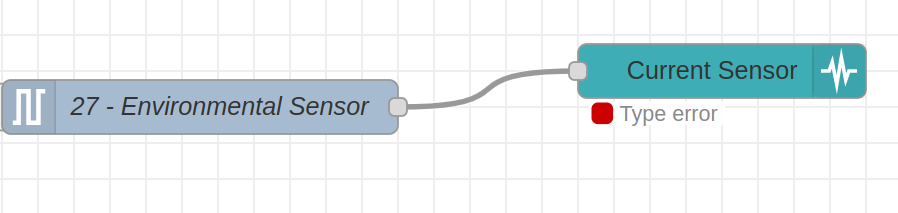
3.- If you connect other ncd-sensor type, you will see the “Type error message“.
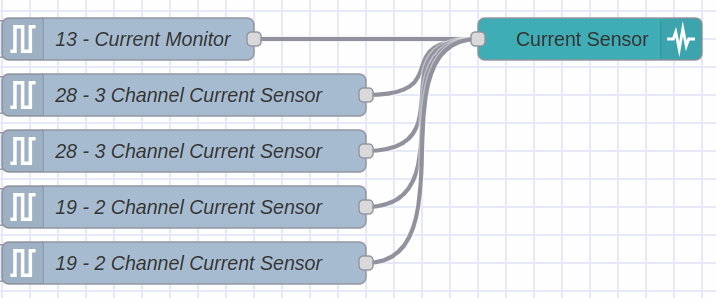
Multiple Inputs
It is possible to connect two or more “Industrial IoT Long Range AC Current Monitor Sensor (1, 2 or 3 Channels)” to the input of this subflow (node), in order to visualize all the data from a single ncd-dashboard.
When you select any of the devices in the list (in case you have two or more sensors connected to the input of this subflow) the data from the local csv files will be automatically loaded, and the last 20 values stored in the graphs will be displayed.
Note: The data storage is per day, in order to have a better data management.
Check Dashboard
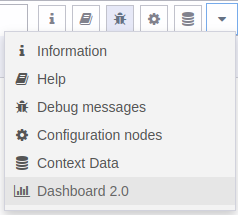
The next step is to go to your ncd-ashboard to see the real time data coming from the sensor by clicking on the “Dashboard 2.0” option in the sidebar:
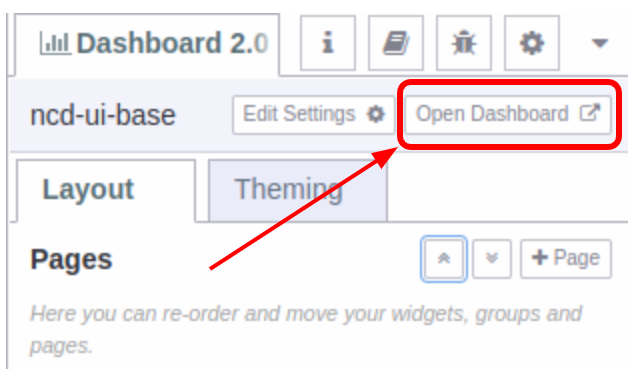
Then click on the “Open Dashboard” option:
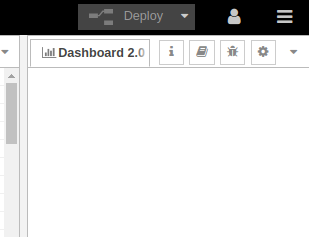
Note: In case you have deployed and cannot see the “Dashboard 2.0” content, you should reload the current page of the web browser with the “F5” key or “Reload page”.
Your ncd-dashboard will automatically open in a new window, where you can see the following:
Dashboard Characteristics
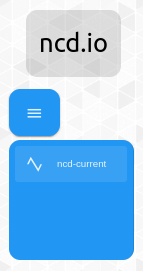
Main Menu
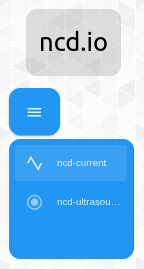
You can navigate between the ui-pages (this menu allows you to navigate between two or more ncd-dashboards, in case you have configured different ncd-dashboards):
Note:For example if you have configured an AC-Current-ncd-dashboard and you import an ncd-Ultrasound-Vibration-ncd-dashboard you will be able to navigate between the ncd-dashboards from the main menu:
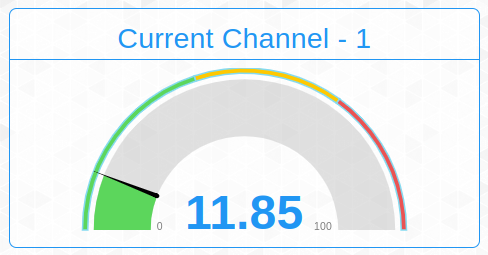
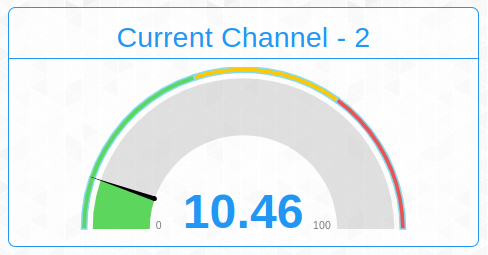
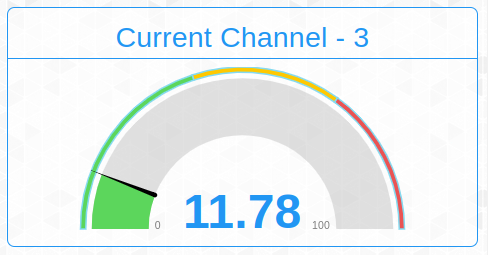
Main Gauges
You can display the Channel-1, Channel-2* and Channel-3* data individually.
*If correspond with the Type.
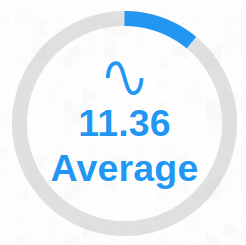
Additional Gauges
This Gauge displays the Average value of the currents, in case the input sensor is a 2- or 3-channel sensor.
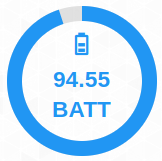
This Gauge displays the battery percentage value of the selected device.
AC Current Chart
It has a main graph, which displays the historical values of each of the sensor channels, dynamically adapts to the type of sensor that is selected.
Show/Hide Lines
It is possible for the user to individuallyshow/hide each of the lines of the graph of interest, so that the user can focus on a signal if desired. To do so, simply click on the identifier as shown in the image below.
Battery Percent Chart
It has a battery graph, which shows the historical values of the sensor’s battery percentage and is dynamically charged according to the type of sensor selected.
Date Picker & Download Button
It is possible to download the locally stored CSV files directly from the ncd-dashboard, which contain the historical data provided by the Industrial IoT AC Current Monitor Sensor(s).
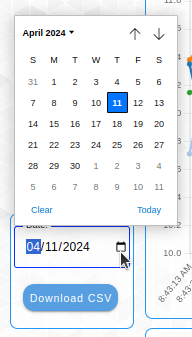
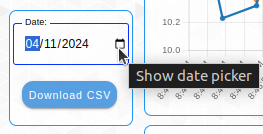
You can see the box at the bottom left, where we have two fields:
Date: Corresponds to a date entry.
Download CSV button: Activates the download of the corresponding CSV file from the web browser.
Format must be used:
mm: for month.
dd: for day.
yyyy: for year.
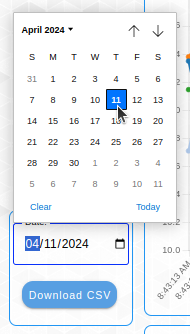
To download a CSV file from the ncd-dashboard, the first thing to do is to select or enter a date of interest using the date picker, i.e. (with the current device selected using the MAC drop-down) the date of the stored data you are interested in downloading.
IMPORTANT
Verify that the date of interest entered corresponds to a valid date, i.e. that the subflow has been storing data (that there is a csv file corresponding to that date).
For example, assuming you have verified that the subflow has been storing data on the date “April 11, 2024”, and you need to download the CSV file generated on that date, then you would enter:
Note: To display the date picker you must click on the icon on the right side of the “Date:” box.
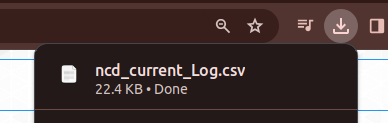
Then click on the “Download CSV” button. If the subflow finds the file on that date, you should be able to see the download start (in the download icon of the web browser):
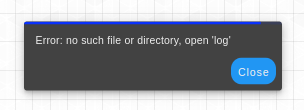
Note: In case you enter a date of interest, which there is no CSV file generated, and press the “Download CSV” button, you will see the following message:
IMPORTANT
CSV file download is currently only available for the default data storage option (local in the path “./node-red”).
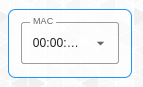
MAC Address Dropdown
The ncd-dashboard provides a dropdown, which allows to select the ncd-sensor of interest to load, display and store its variables, through its MAC address.
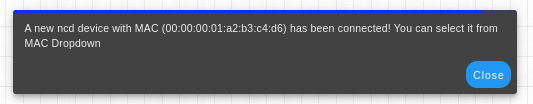
When you connect a new ncd-sensor (via the Wireless Device node) to the ncd-dashboard node input, as soon as data is received from the ncd-sensor a popup window is displayed indicating that a new device has been connected and it automatically becomes available in the MAC Address dropdown for you to select it.
An example of this process is shown in the following image:
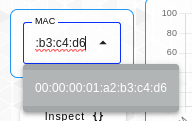
When 1, 2 and 3 channel sensors are connected, the ncd-dashboard is able to dynamically adjust to the type of sensor by selecting the MAC address, an example of this process is shown in the following image.
Inspect Button
It is possible to access the object data of each sensor from the ncd-dashboard, for which the “Inspect” button is available.
Press it once to go to the inspect window of the selected sensor, press it again to return to the data view.
Product info
The “Product info” button allows you to go to the information on our website about the sensor corresponding to the ncd-dashboard.
Possible Drawbacks During Subflow Import
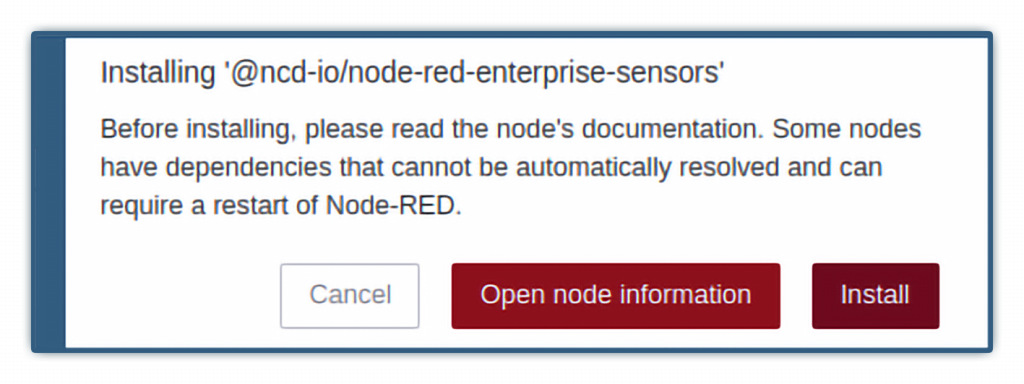
1.- Import Subflow Without Dependencies Installed
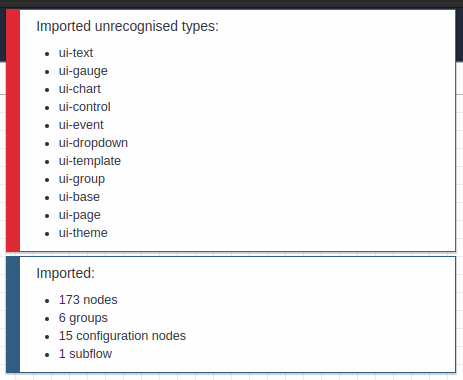
If you import the flow without having previously installed Dashboard 2.0, you will get a message like the following:
So you must delete the subflow and install the module “@flowfuse/node-red-dashboard” as mentioned at the beginning, and repeat the process. To delete the subflow you must double-click on the subflow in the Node-RED node editor to open its properties, then click on the “Delete” button at the top of the window.
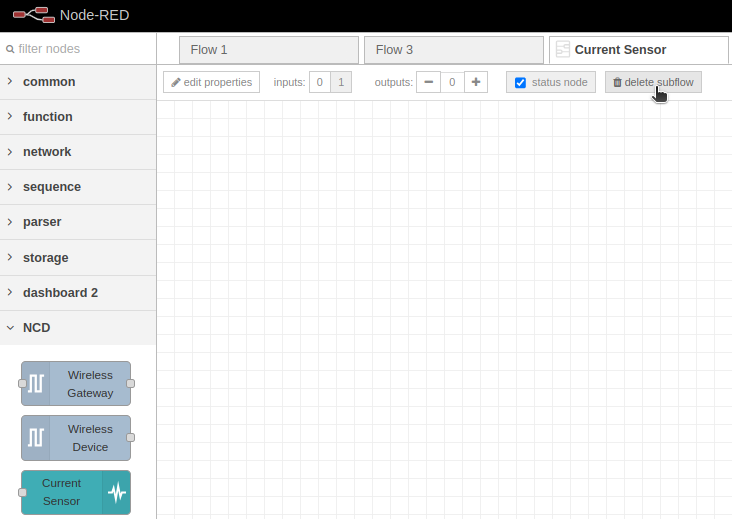
You must also delete the subflow node from the node palette in the “NCD” or “Sublows” group, double click on the node. This opens the subflow window, at the top click on the “delete subflow” button:
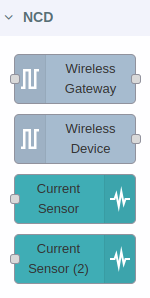
2.- Import the Same ndc-Dashboard Twice / Delete ncd-Dashboard
In case by mistake or by some procedure you have imported twice the same subflow, or you simply want to remove an ncd-dashboard subflow from the nodes palette, you must follow this quite simple procedure.
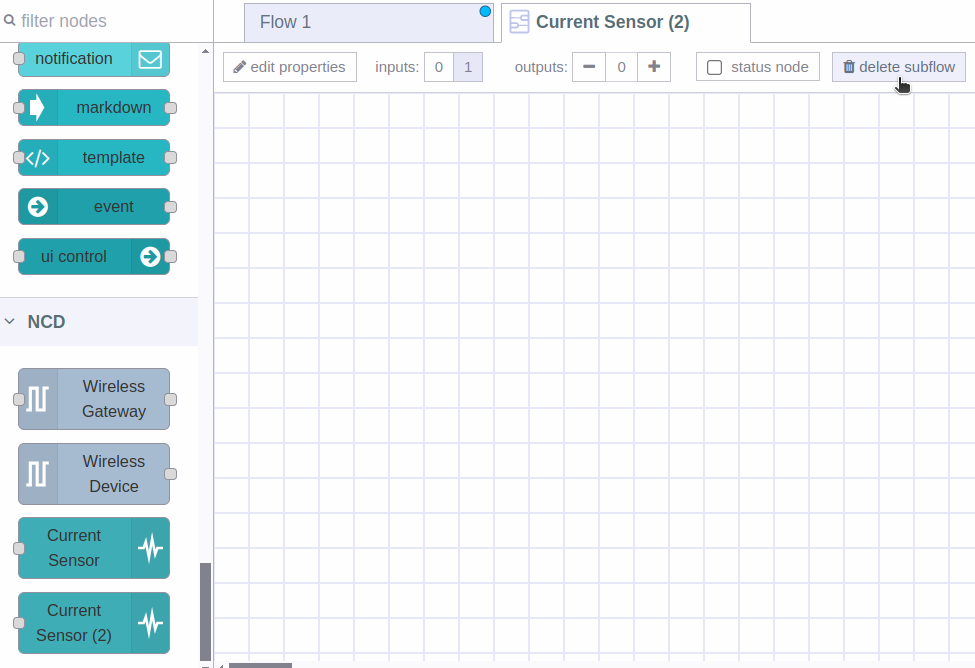
(1) Double click on the subflow node you wish to delete, the ncd-dashboard subflows are located in the node palette within the NCD group. (2) Once the “Edit subflow template” tab opens at the top, click on the “delete subflow” button.
This completely removes the subflow, as well as the associated configuration nodes, you will notice that it no longer appears in the nodes palette.
Do not forget to Deploy in order to save and apply the changes made to your project.
Summary
Automatic and remote measurement/storage of electrical current in Industrial equipment represents an opportunity to optimize maintenance times in Industry, as well as many other advantages.
We have sensors for the measurement of this condition, which meet the requirements and features mentioned above and that hand in hand with these ncd-dashboard form a complete solution, free of monthly fees, customizable and ready to implement.
During the development of these Dashboards we are focused on providing an intuitive tool for the user, and this is achieved thanks to the flexibility that Node-RED allows us, although we use some basic functions in JavaScript, we try to structure the flow with other more friendly nodes, so you can modify or customize the dashboard with little effort.