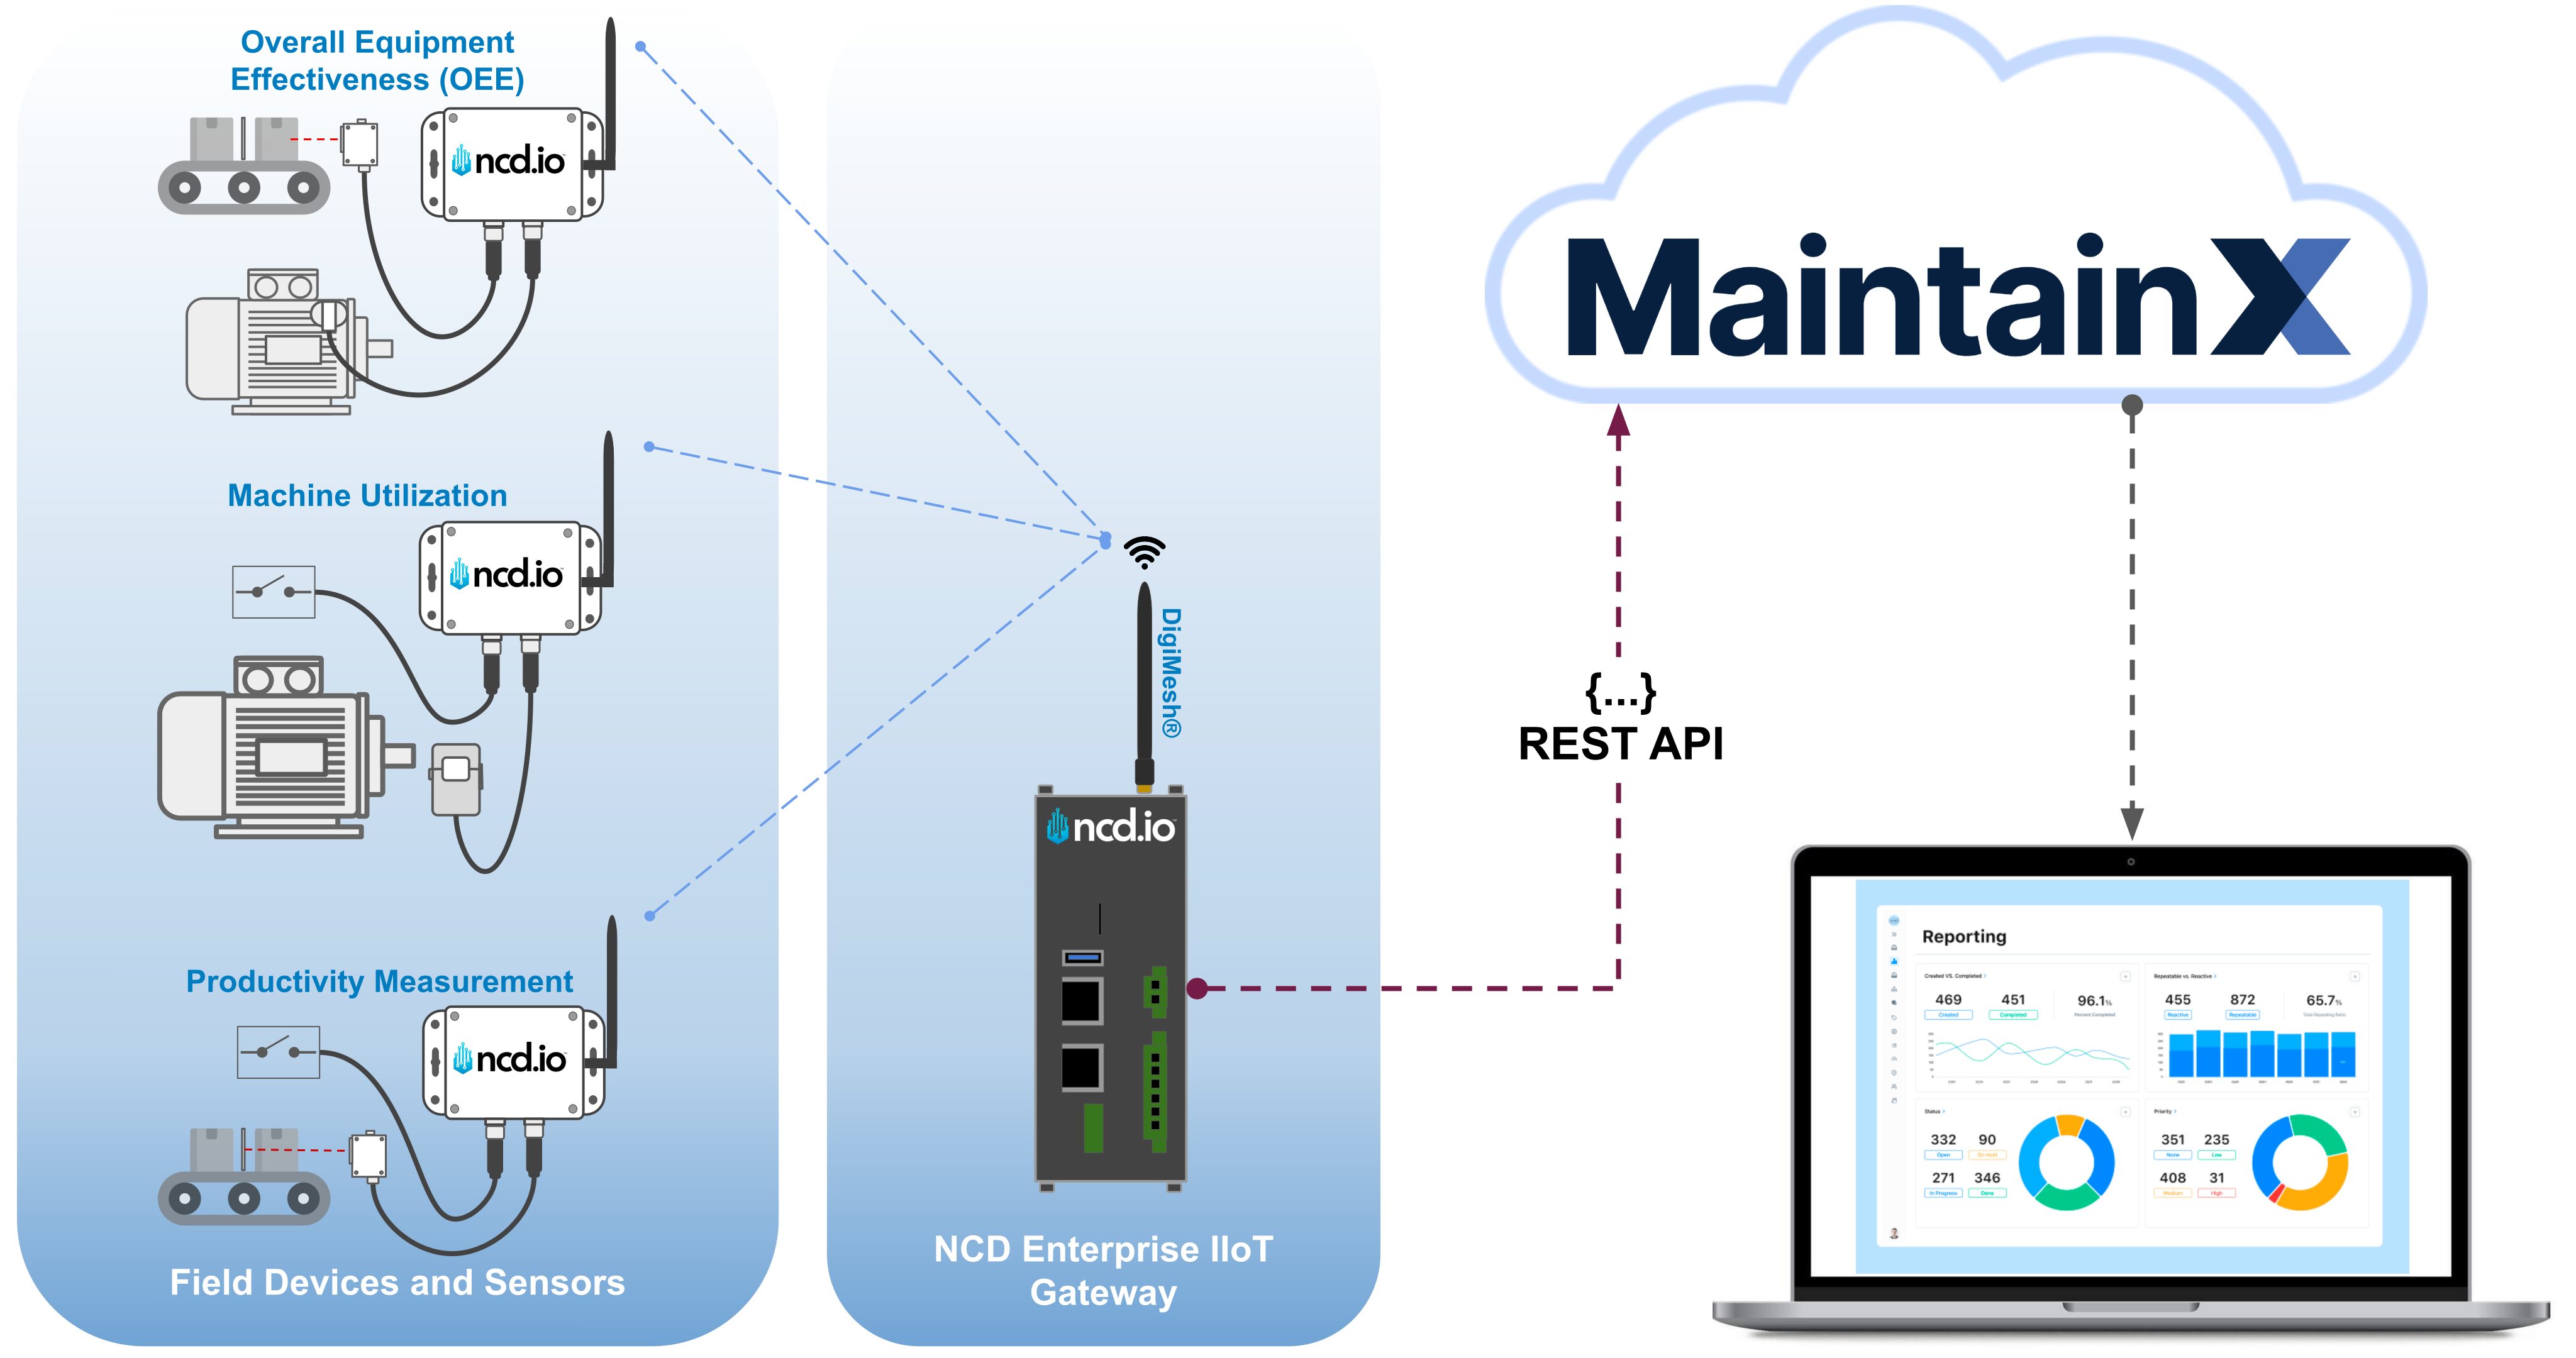
Industrial maintenance teams often face significant challenges, such as unexpected equipment downtime, inefficient manual monitoring, and delayed responses to critical issues, all of which can lead to costly disruptions and missed opportunities for preventive care. The integration of the NCD Machine Uptime Monitoring Sensor with the MaintainX platform, facilitated by the NCD Enterprise IIoT Gateway and Node-RED, offers a powerful solution to these pain points. This guide demonstrates how to seamlessly connect real-time sensor data to MaintainX, a leading maintenance management system, using Node-RED’s intuitive drag-and-drop interface on the gateway. By bridging these technologies, you can automate work order creation, track equipment performance with meter readings, and design tailored workflows—such as triggering alerts for downtime events or scheduling preventive maintenance—ensuring your factory operates efficiently and downtime is minimized.
MaintainX
MaintainX is a leading cloud-based Computerized Maintenance Management System (CMMS) designed to streamline maintenance operations, asset management, and work execution for industrial and frontline teams. At its core, MaintainX enables organizations to create, assign, and track work orders, schedule preventive maintenance, monitor equipment health, and manage assets—all from a single, user-friendly interface accessible on both desktop and mobile devices (iOS and Android).
Use it to:
Set up preventive maintenance schedules and manage reactive maintenance.
Create, assign, and monitor work orders and work requests.
Trigger work orders automatically based on meter readings and Internet of Things (IoT) data.
Monitor equipment health and make data-driven decisions about repairs and replacements.
Monitor your parts inventory and receive alerts when stocks run low.
Create digital checklists for technicians, procedure scoring, and automated corrective actions.
Access out-of-the-box and custom dashboards with reports on equipment health, PM compliance, maintenance costs, and more.
And more.
Key features include real-time communication tools, asset tracking, inventory management, customizable reporting, and integration with IoT devices like the NCD machine uptime monitoring sensor. With its open API and connectors, MaintainX seamlessly integrates with external systems, enabling automated workflows and real-time data updates. It helps reduce downtime, improve efficiency, and enhance equipment reliability, making it ideal for industries such as manufacturing, logistics, and facility management.
Machine Uptime Monitoring Sensor
The Machine Uptime Monitoring Sensor is a versatile, IoT-enabled device designed to track machine and production uptime in industrial settings. Featuring multiple input types—such as accelerometers, magnetometers, current sensors, beam-break sensors, and photo eyes—it delivers precise, real-time monitoring of equipment performance. With an IP65-rated enclosure and wireless communication, it thrives in harsh factory conditions, making it adaptable across industries like manufacturing, automotive, food processing, and chemical/pharmaceutical production.
In industrial factories, unplanned downtime disrupts schedules and inflates costs, but this sensor mitigates the issue by instantly detecting stoppages through motion, contact, or current-based inputs. It also tackles productivity inefficiencies by tracking machine utilization and cycle counts, enabling managers to optimize equipment usage and address bottlenecks. By integrating with systems like MaintainX, it provides actionable data to reduce idle time and boost throughput, directly improving operational efficiency.
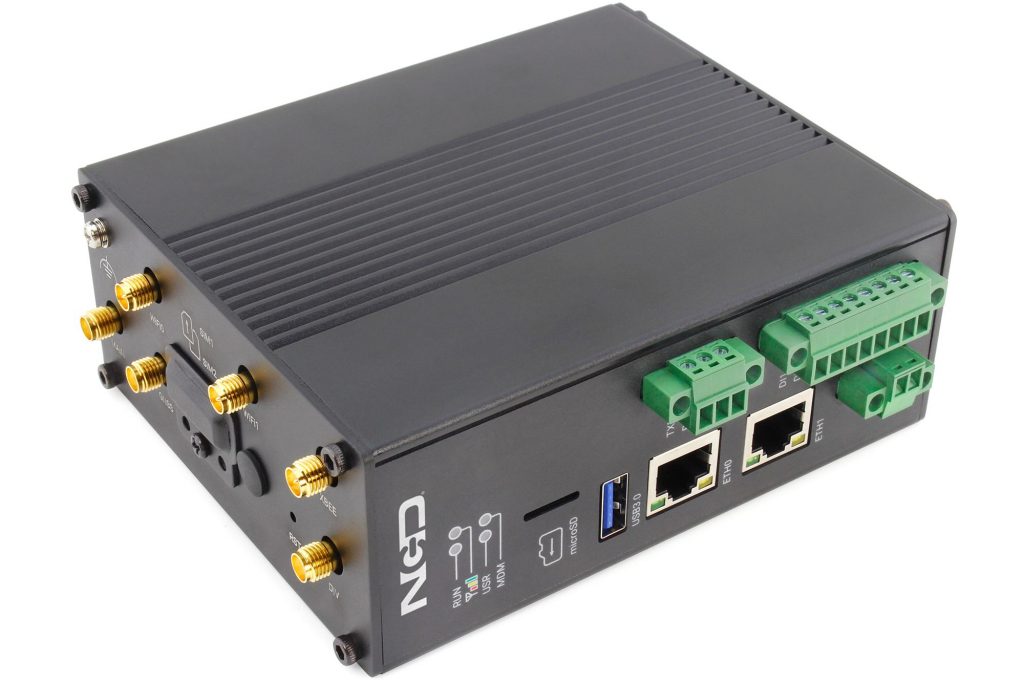
The Enterprise IIoT Gateway gets, processes, decodes, and transmits data from the NCD Industrial IoT sensor to various cloud services or Industrial protocols. You can think of it as a Wi-Fi router, but it uses a specialized wireless protocol called DigiMesh®. Both the NCD sensor and the Enterprise IIoT Gateway communicate using this protocol, which is specifically designed and tested for industrial applications.
This guide covers the integration of the NCD Machine Uptime Monitoring Sensor with MaintainX using the NCD Enterprise IIoT Gateway and Node-RED. The sensor collects real-time machine data via inputs like optical, current, and vibration sensors, transmitting it wirelessly to the gateway through the DigiMesh protocol. The gateway processes this data with Node-RED’s NCD library, sending it as automated meter readings to MaintainX via a REST API. This enables actionable maintenance tasks, such as triggering work orders and creating workflows, to optimize factory operations and reduce downtime with a streamlined setup.
Important!The source for the Automated Meter must be a REST API.
NoteThis tutorial can be replicated with any other NCD Enterprise Industrial IoT Sensor.
With these components, you can connect the NCD sensor to the Enterprise IIoT Gateway and leverage the built-in Node-RED instance to forward sensor data to MaintainX using the REST API.
This tutorial provides a comprehensive walkthrough of the essential configuration steps, including connecting NCD devices, registering them on the platform, setting up a MaintainX, creating and linking a new Automated Meter to visualize real-time sensor data.
Node-RED
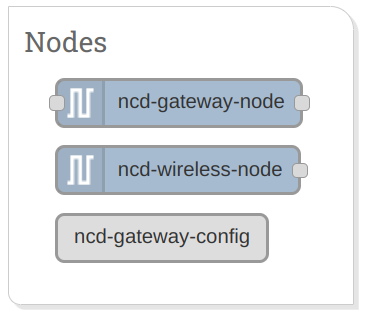
Node-RED is a visual programming tool that provides a browser-based editor for creating applications by connecting predefined functions (nodes). Despite its technical nature, Node-RED offers a user-friendly interface. As an open-source project under the OpenJS Foundation, it is free to use with no subscription fees. You can install and run Node-RED locally on your PC, or, in the case of our Enterprise IIoT Gateway, it comes pre-installed and operates as a service. Node-RED, in conjunction with our Enterprise NCD library, forms a powerful tool for acquiring, managing, configuring, and uploading firmware through an intuitive interface. This combination offers a streamlined approach to optimizing the setup, configuration, and management of NCD sensor data.
NCD Enterprise Library
This library facilitates communication with and configuration of the NCD Wireless Sensor Line. It can be employed in conjunction with Node-RED to communicate and manage a Wireless Sensor Network using the Node-RED flow-based development tool on any platform. Additionally, as demonstrated, the library acts as an interface for uploading Firmware Updates to NCD Sensors. As mentioned earlier, this library is pre-installed on the Enterprise IIoT Gateway and is ready for immediate deployment.
Procedure
The upcoming section details the step-by-step process for integrating the NCD Machine Uptime Monitoring Sensor with the NCD Enterprise IIoT Gateway to send data into Node-RED. It covers the initial setup, ensuring the sensor and gateway work together to capture and relay machine uptime information accurately.
From there, the guide explains how to configure the MaintainX automated meter and connect the gateway to MaintainX using the REST API.
Note!If you’ve already set up the NCD Machine Uptime Monitoring Sensor and the NCD Enterprise IIoT Gateway, you can skip the initial configuration steps. Feel free to proceed directly to the "Configuring MaintainX" section, where you’ll learn how to connect the gateway to the MaintainX platform and start using your sensor data effectively.
Configuring the NCD Devices
We’ll start by setting up the Enterprise IIoT Gateway and the Machine Uptime Monitoring Sensor, followed by connecting them. This process is straightforward, and we have a detailed guide available for reference. Below is a brief overview, but for complete instructions, please refer to the following NCD documentation:
Unbox your NCD Enterprise IIoT Gateway, connect it, and power it on following the provided instructions. Then, connect the ETH0 port to your DHCP-enabled router (the Gateway will act as a DHCP client). It will automatically obtain an IP address. After giving the device some time to boot, you should be able to access the Node-RED instance running on it by using its local IP address or domain name, appending port 1880 (the default Node-RED port).
We recommend using the local domain name format: ncd-xxxx.local:1880, where ‘xxxx’ refers to the last four digits of the Enterprise IIoT Gateway’s MAC address (printed on the side of the device). For example, http://ncd-c398.local:1880
Connect the Sensor to the Gateway
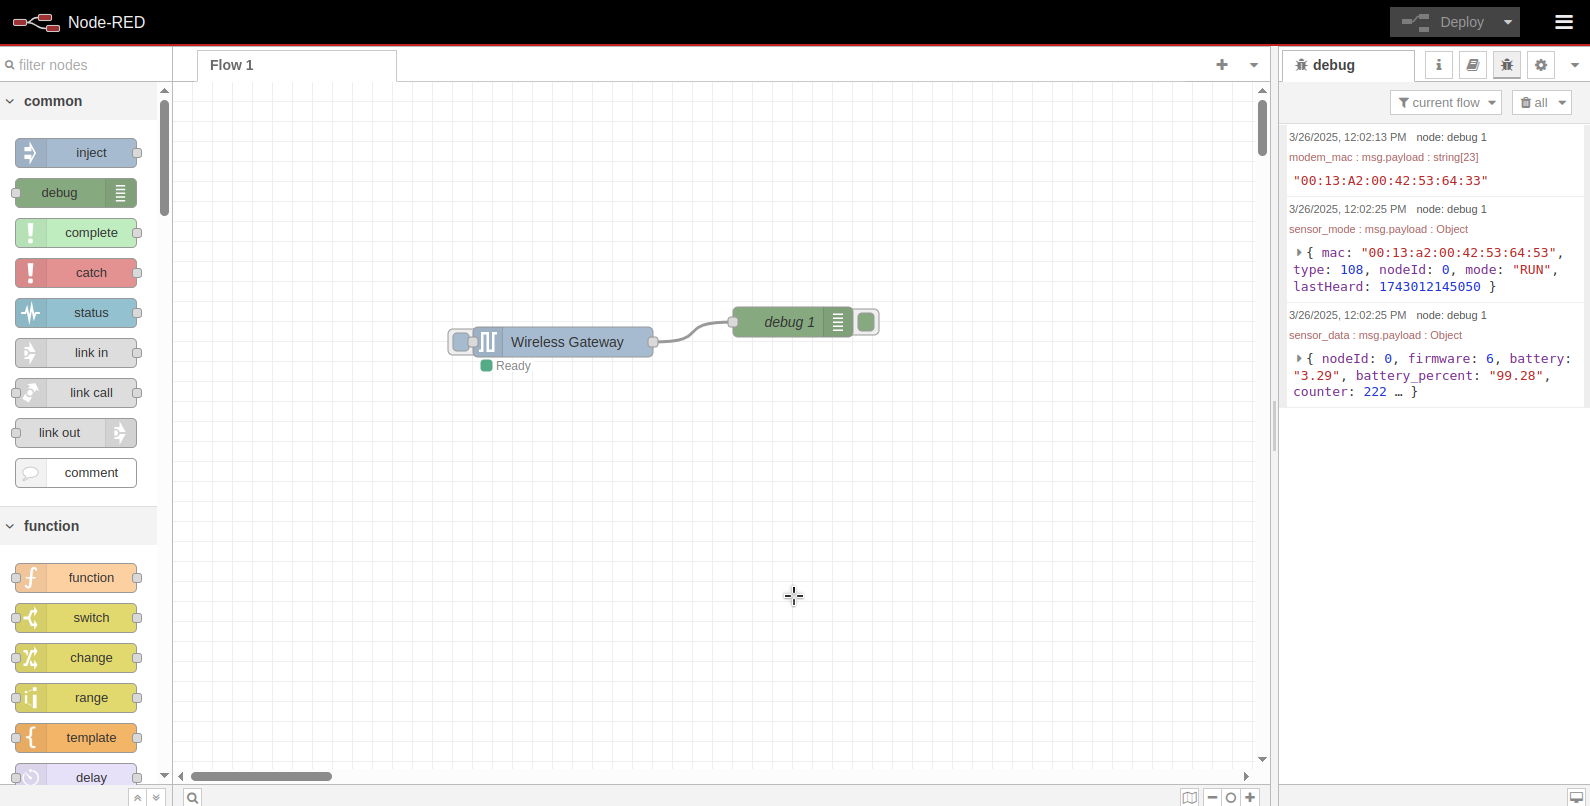
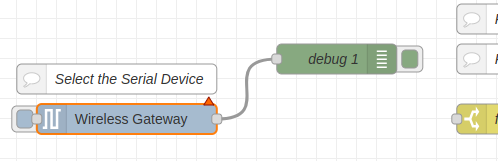
Upon accessing the Node-RED instance, you will notice a pre-configured flow that includes a Wireless Gateway node and a Debug node. These nodes form part of the default configuration, enabling the system to receive and display messages from connected devices. This flow is preconfigured and ready to receive data from NCD sensors. When an NCD sensor connects to the wireless network and transmits data, the ‘Wireless Gateway‘ node automatically receives and processes the message. The processed message is then passed through its output terminal and sent to the ‘Debug’ node. This node displays the message in the Debug window, located on the right side of the Node-RED editor.
Click to Expand
At this stage, everything is ready, and you can proceed to power on your NCD Machine Uptime Monitoring Sensor. NCD Industrial Sensors come pre-equipped with batteries and also support an external power supply option, which can be selected during the purchase process.
NoteIn this guide, we will focus on an example using a battery-powered sensor; however, the steps are equally applicable to sensors powered by an external supply. To activate the sensor, open its casing and toggle the power switch to the “Power by Internal Battery” position.
The power switch on this device has three positions:
The Battery Power position will use the onboard batteries to power the sensor and transmit data.
The Off position will power down all components of the sensor and no data will be transmitted.
The External Power position will use the external power supply connected to the onboard barrel connector to power the sensor and transmit data.
Click to Expand
Once the sensor is powered on, it begins transmitting data, and you will start seeing incoming messages. The ‘Wireless Gateway‘ node decodes the sensor data and forwards it through its output terminal to the ‘Debug’ node. These messages are displayed in the debug window of the Node-RED editor. After activating the NCD Vibration Sensor, the Debug window should display messages similar to the following:
Click to Expand
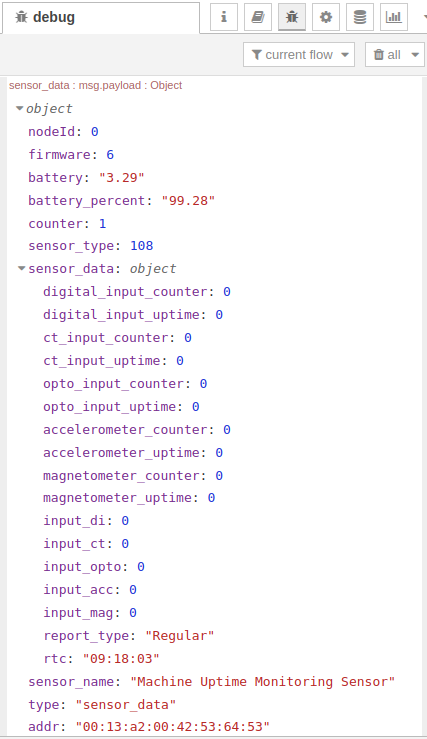
NoteNCD sensors transmit a variety of messages that provide insight into the sensor’s current mode and operational status, along with the actual sensor data. In this guide, we will focus specifically on the sensor_data message.
Understanding Sensor Inputs and Data for Machine Monitoring
The NCD machine uptime monitoring sensor is a versatile tool that tracks machine activity using various input types: contact closure, optical/digital input, current sensor, vibration sensor (accelerometer), and magnetometer sensor. These inputs detect machine cycles (on/off events) and measure uptime, providing valuable data for performance tracking and maintenance. The sensor supports two configurable inputs with combinations like Contact Closure + Current Sensor or Accelerometer + Magnetometer, depending on your setup.
The NCD Machine Uptime Monitoring Sensor supports five types of inputs to capture a wide range of machine data:
Contact Closure: Detects on/off states using dry or wet contacts, perfect for tracking basic machine activity.
Optical/Digital Input: Uses light-based detection, such as break beam sensors, photo reflectors, or photo eye sensors, to monitor movement or presence.
Current Sensor: Measures electrical current to track total machine uptime and cycle counts with advanced precision.
Accelerometer: Monitors vibration and motion to measure total machine uptime and cycle counts effectively.
Magnetometer: Detects magnetic fields to determine the on/off status of machinery, ideal for equipment with magnetic emissions.
How the sensor works
The sensor generates data based on five key properties:
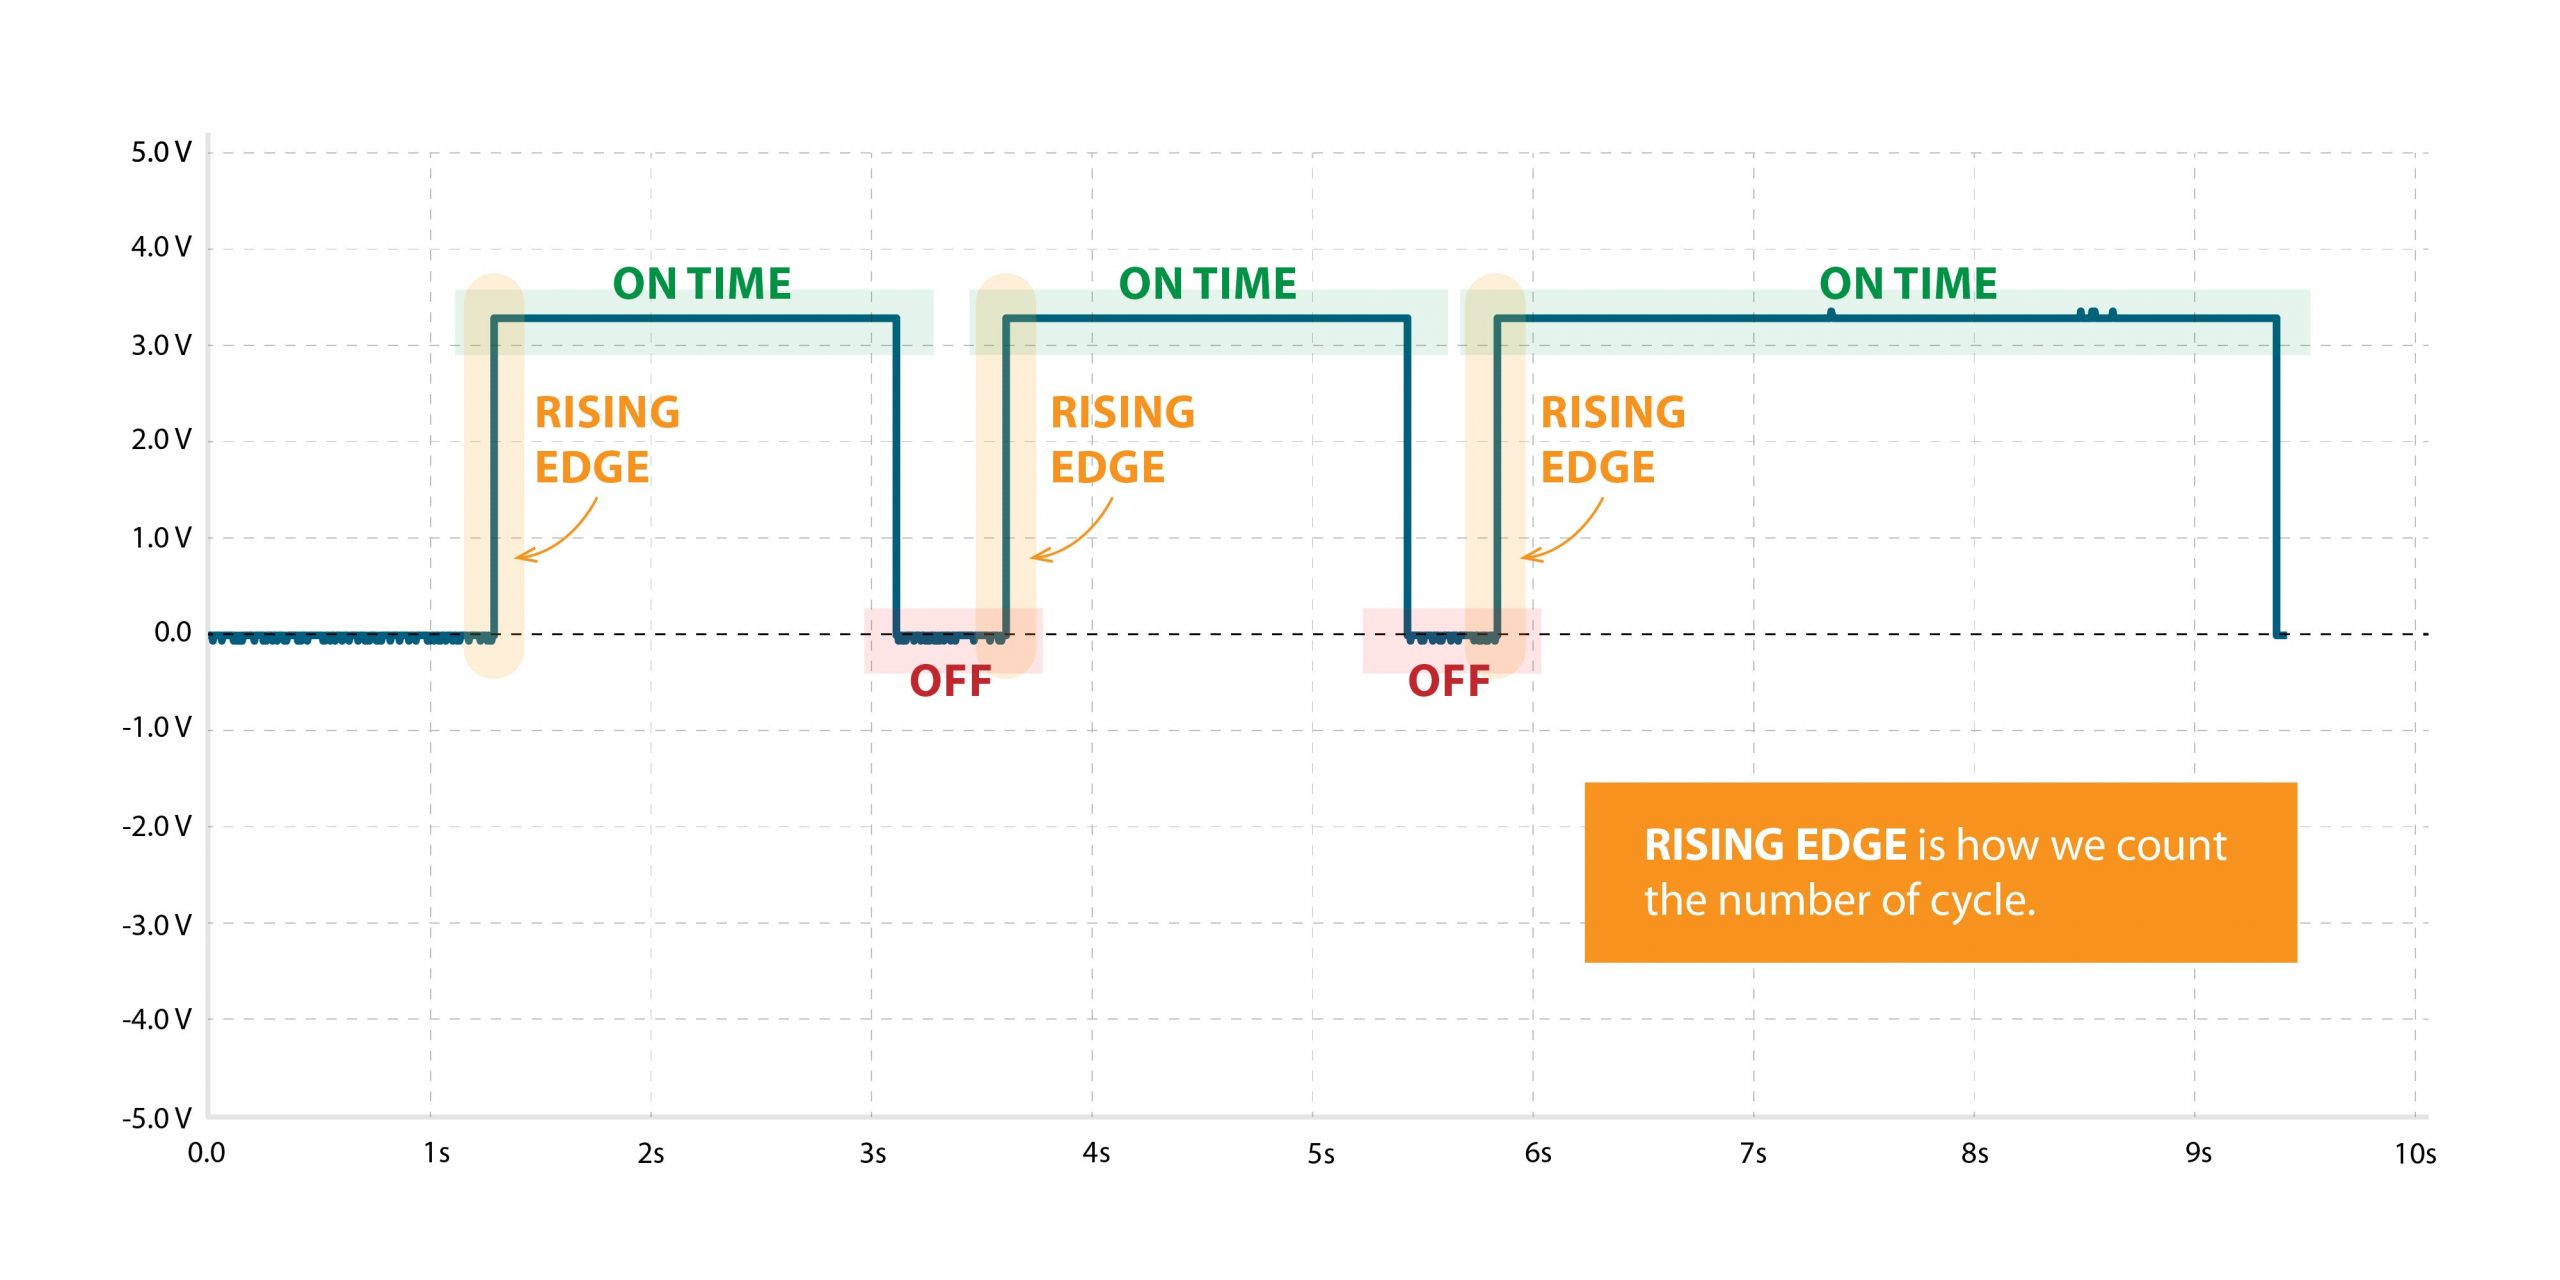
Counter: This tracks the number of machine cycles. Each time the sensor detects an input (e.g., a contact closing, a pulse from a current sensor, or a vibration), the counter increases by 1. Think of it as counting how many times the machine turns on or completes a cycle.
Uptime: This measures the total time (in seconds) the machine is powered on. When the sensor detects an input, it starts a timer; when the machine turns off, the timer stops and adds to the total uptime. It’s your window into how long the machine is actually running.
Input: These are real-time status flags (e.g., input_di, input_ct, input_acc) showing whether the input is active (1) or inactive (0). You can configure them to trigger on a rising edge (off-to-on) or falling edge (on-to-off), giving flexibility in how you define a cycle.
Report Type: This tells you why the sensor sent data. A “regular” report comes at user-set intervals (e.g., every hour). A “Shift end” report is triggered instantly when a predefined shift time is met. An “Interrupt” report is triggered instantly when an input changes (based on the configured trigger). A “Threshold” report is sent when any counter reaches a specified value.
RTC: If the internal RTC (Real-Time Clock) is set, it reports the actual Real-Time Clock value in hours, minutes, and seconds (e.g., rtc: “09:18:03”). This provides a timestamp for when the data was recorded.
Click to Expand
The sensor sends this data, including counters and uptime for each input type.
Note!Only the configured inputs show active values—unused inputs stay at 0.
sensor_data message: The sensor_data message includes critical information such as the firmware version, battery percentage, sensor type, data values, sensor name, MAC address, and other essential details. The sensor_data message can be identified by the msg.topic property. When the sensor transmits a data message, the msg.topic is set to sensor_data which makes it easier to filter or manage the sensor data. To view the sensor data in the debug window, simply click on the message. You should see something like this:
Click to Expand
Note!For this guide, we’ll use the Current Sensor Input as our example to demonstrate the integration process. If you’d prefer to use a different input type or combine multiple inputs, such as the Optical Sensor, Magnetometer or Accelerometer, we strongly recommend reviewing the datasheet, particularly the "Example Probe Wiring" section. This resource provides detailed wiring instructions to help you adapt the setup to your specific needs.
Click to Expand
Configuring MaintainX
In this section, we’ll provide a concise overview of meters in MaintainX and guide you through creating Automated Meters. You’ll learn how to set its measurement unit, choose a meter type, and define the parameters to suit your needs. Additionally, we’ll briefly explore the MaintainX API documentation, which enables seamless communication between the NCD Machine Uptime Monitoring Sensor and MaintainX using Node-RED, enhancing your integration setup.
Meters in MaintainX
In MaintainX, a meter is a tool designed to measure and record equipment usage variables, such as operating hours or production milestones. Any equipment that requires usage-based maintenance relies on these meters to track key performance factors, ensuring timely upkeep based on actual utilization rather than fixed schedules.
Meters play a vital role in adopting condition-based or predictive maintenance strategies, allowing you to schedule tasks triggered by real equipment usage. For instance, if a forklift needs servicing after every 500 operating hours, MaintainX can monitor the meter readings and automatically generate an inspection or maintenance work order when this limit is exceeded. This approach enhances efficiency and prevents unexpected breakdowns by aligning maintenance with equipment condition.
Types of Meters
MaintainX offers two types of meters:
Manual Meter: A technician manually checks this meter and records the reading in MaintainX.
Automated Meter: This meter automatically transfers readings from an integrated data source, such as a sensor, to MaintainX at a predetermined interval.
This guide walks you through creating and using Automated Meters in MaintainX to capture data from the NCD Machine Uptime Monitoring Sensor.
To dive deeper into meters, automations, and the entire MaintainX environment, visit the MaintainX Help Center at https://help.getmaintainx.com/. This resource offers detailed guides and support to help you maximize the platform’s features for your maintenance needs.
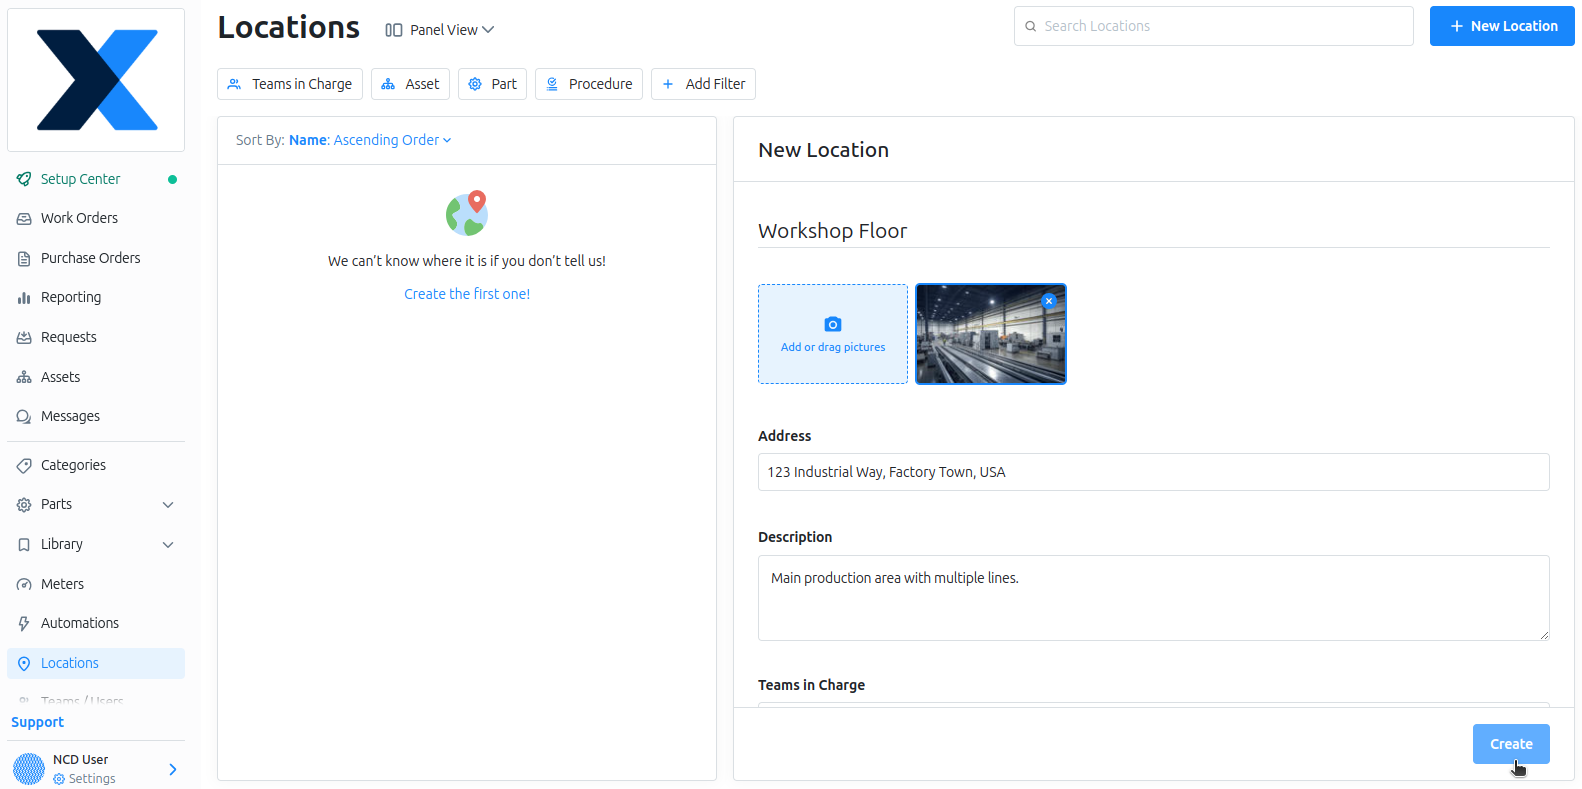
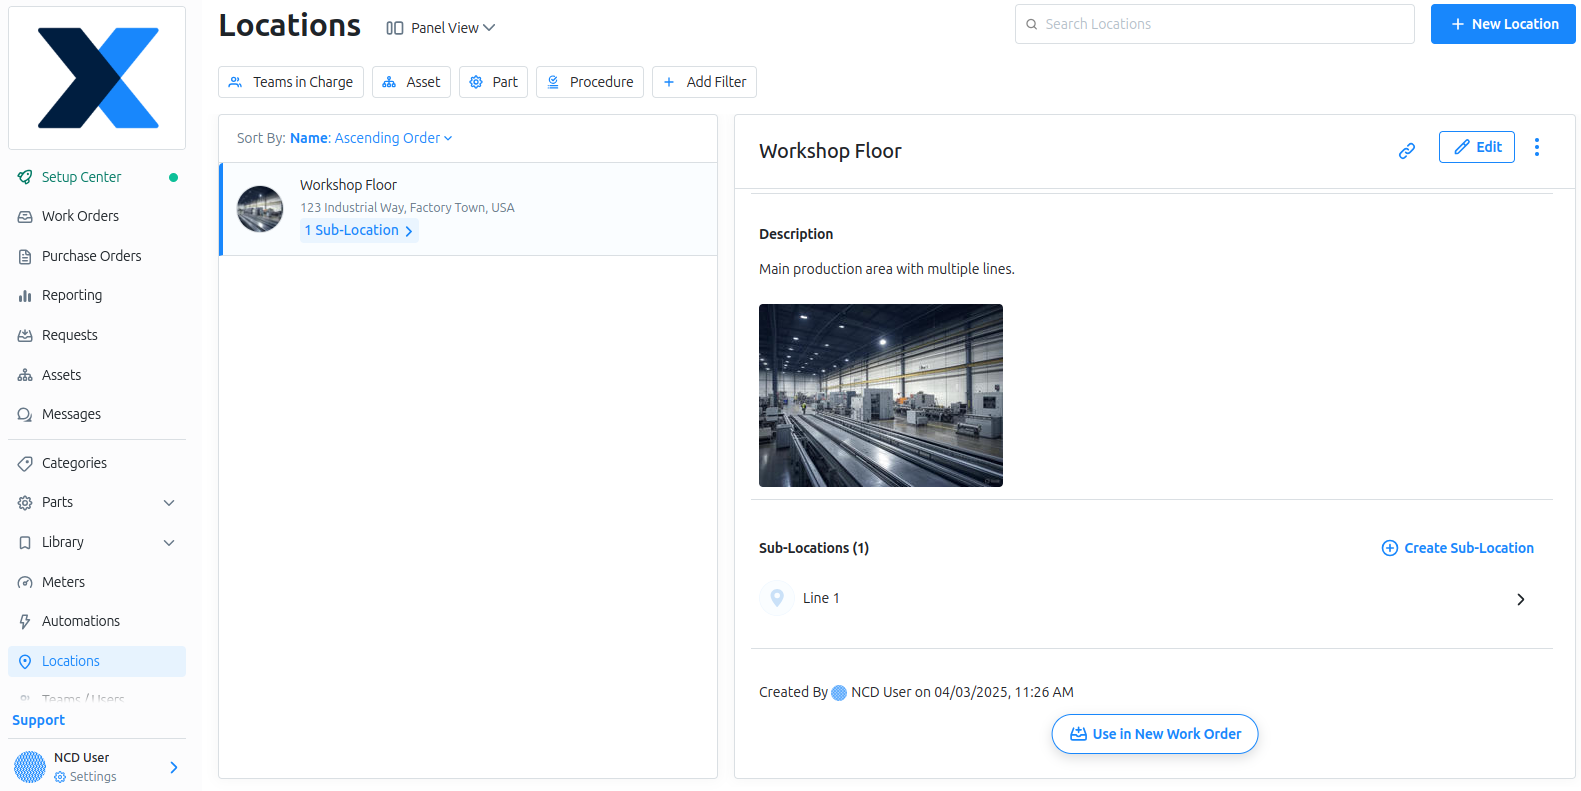
Create Location
In MaintainX, a location represents a specific area in your facility—like a workshop floor or production line—where assets (e.g., machines or sensors) are placed. It organizes your equipment for easier management, helping teams track, maintain, and monitor assets efficiently. For example, “Workshop Floor” can be a location, with “Line 1” as a sub-location, tying directly to assets like a CNC machine.
Step 1. The first step to create a location in MaintainX is to go to Locations in the left sidebar menu.
Click to Expand
Step 2. The second step is to assign the name, address, description, and all relevant location properties, then click the Create button to create the location.
Click to Expand
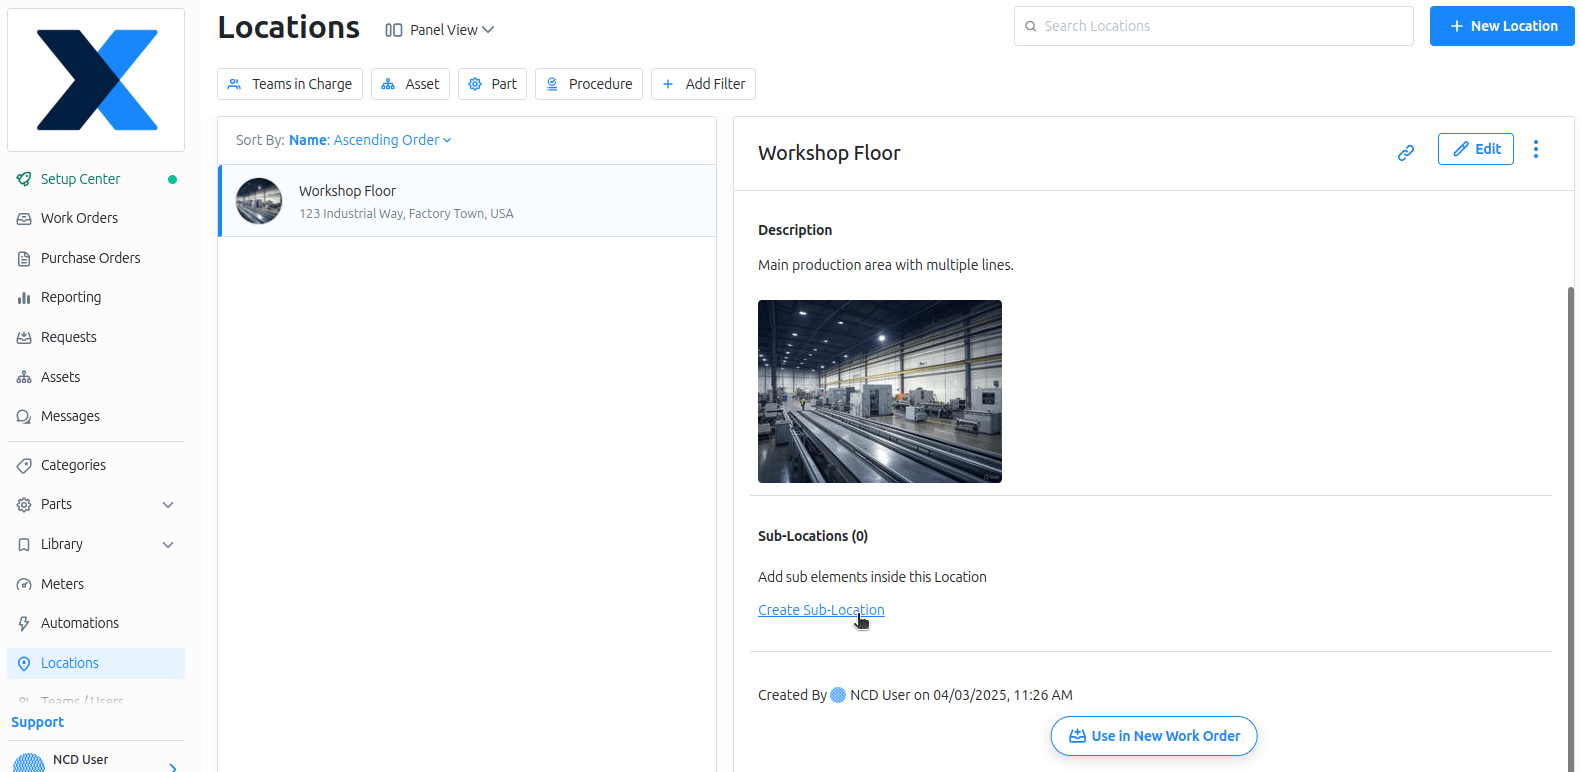
Sub-locations
In MaintainX, a sub-location represents a specific area within a larger location, like a production line (e.g., “Line 1”) inside a workshop floor. It helps further organize assets, making it easier to manage and monitor equipment in detailed sections of your facility.
Step 1. To create a new sub-location, go to your current location in MaintainX, scroll down to the location properties, and click the Create Sub-Location button.
Click to Expand
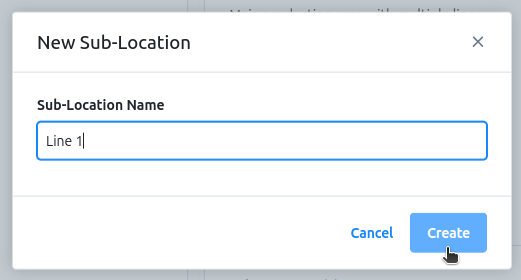
Step 2. Next, assign a name to your new sub-location, then click the Create button.
Click to Expand
Step 3. Once you click the Create button, you should see your new sub-location listed.
Click to Expand
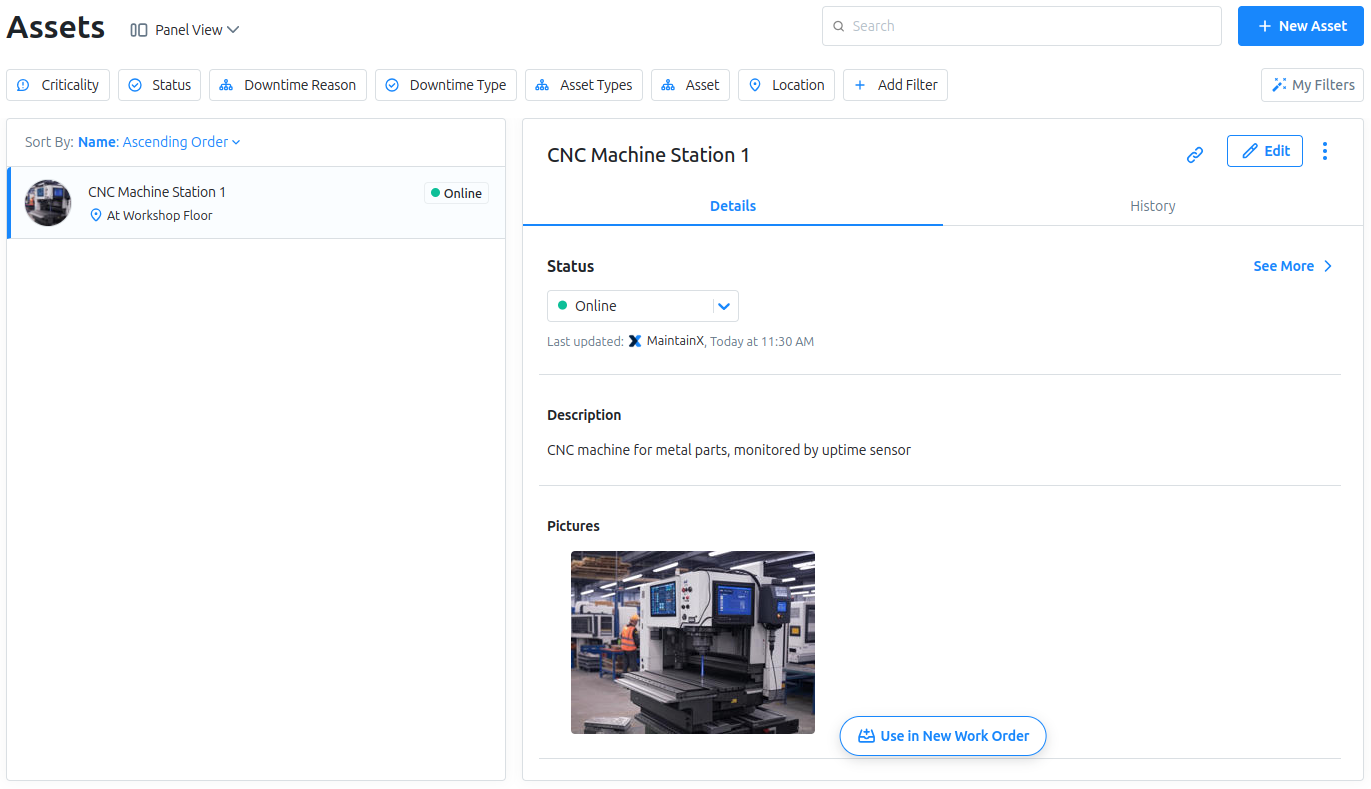
Create Assets
In MaintainX, an asset represents a specific piece of equipment or device, like a CNC machine or a sensor, located within a location or sub-location. Assets are the items you monitor and maintain, allowing you to track performance, schedule maintenance, and trigger work orders based on their data or condition.
Step 1. To create an asset, go to the main menu in MaintainX and click the Assets option.
Click to Expand
Step 2. Next, click the New Asset button located at the top right.
Click to Expand
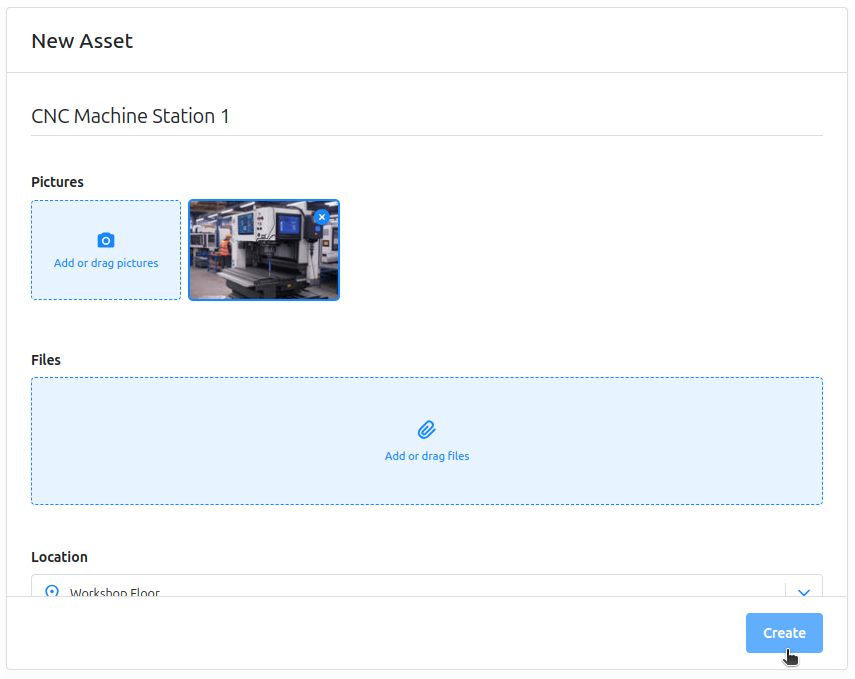
Step 3. Next, assign an asset name, picture, files, location, sub-location, and all relevant asset properties, then click the Create button.
Click to Expand
Step 4. Once you click Create, you should see the new asset listed. In this example, we created a CNC Machine, which we will monitor for cycles and uptime.
Click to Expand
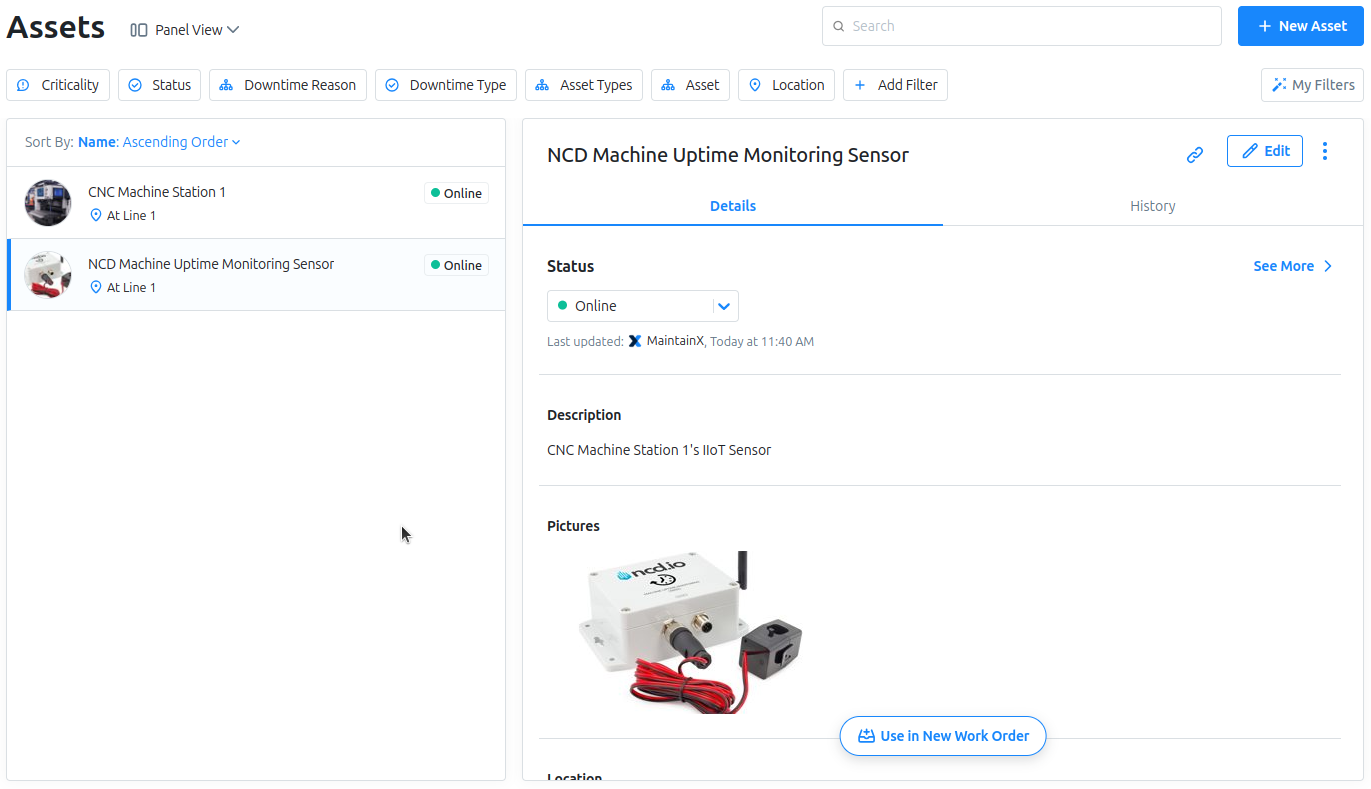
NCD Sensor as Asset
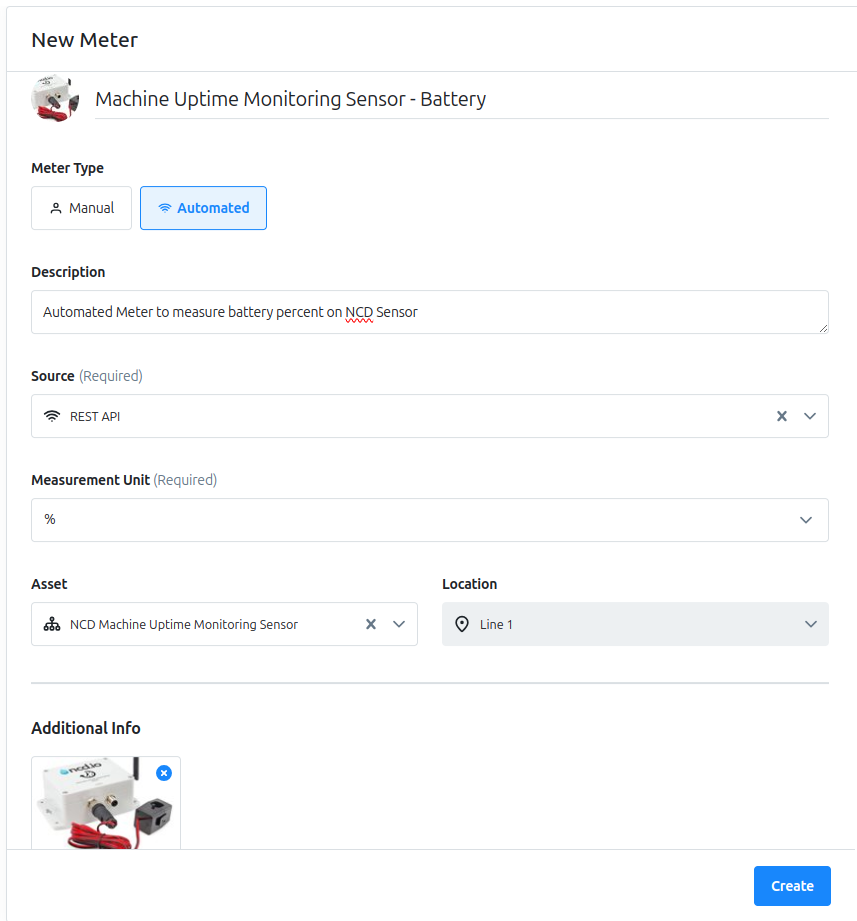
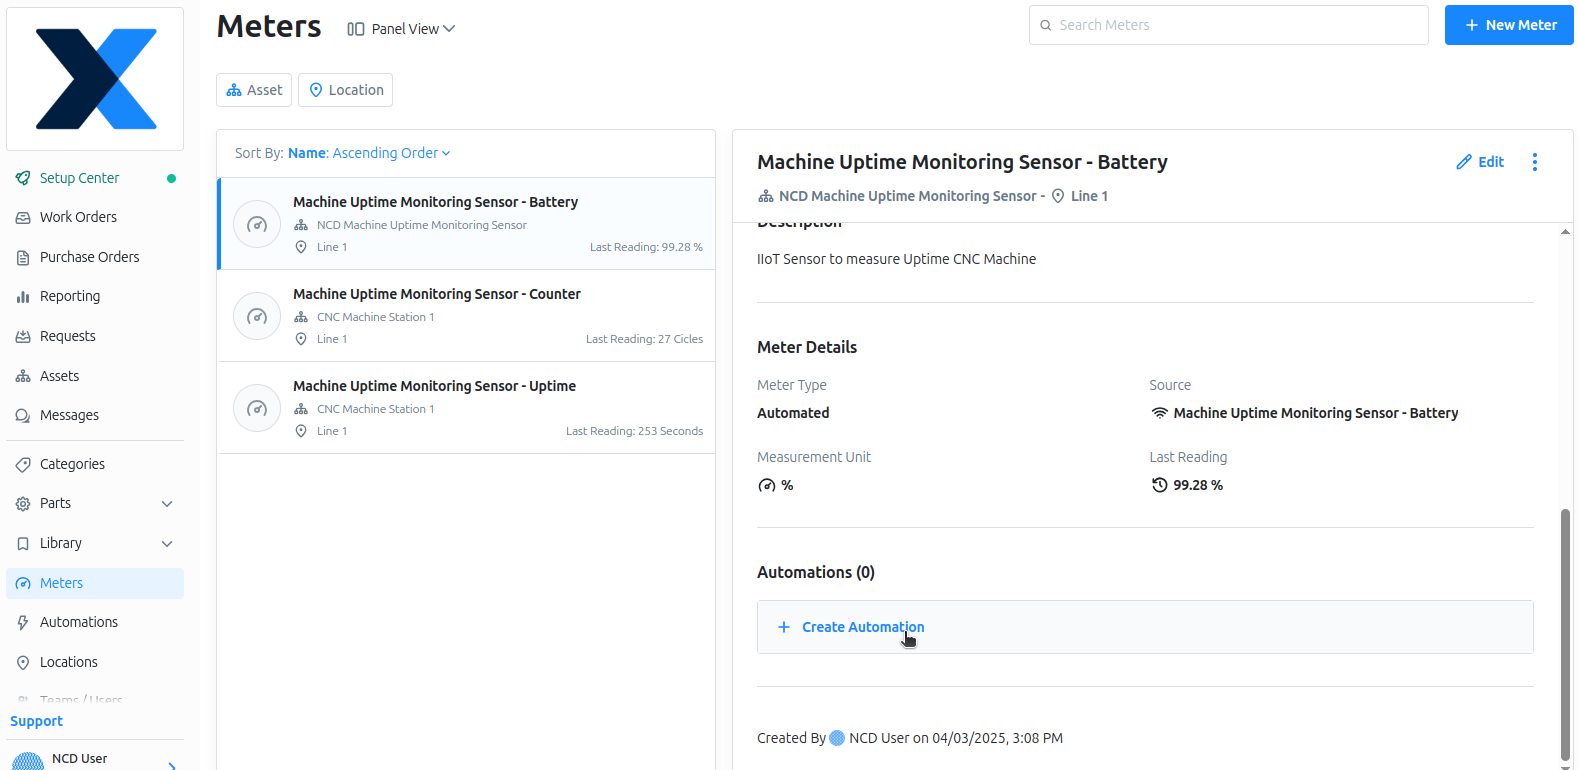
Next, we will create another asset. In this example, we will add the Machine Uptime Monitoring Sensor itself as an asset. This sensor sends its battery percentage, which we will monitor to trigger a work order if the battery percentage falls below a specified value.
Click to Expand
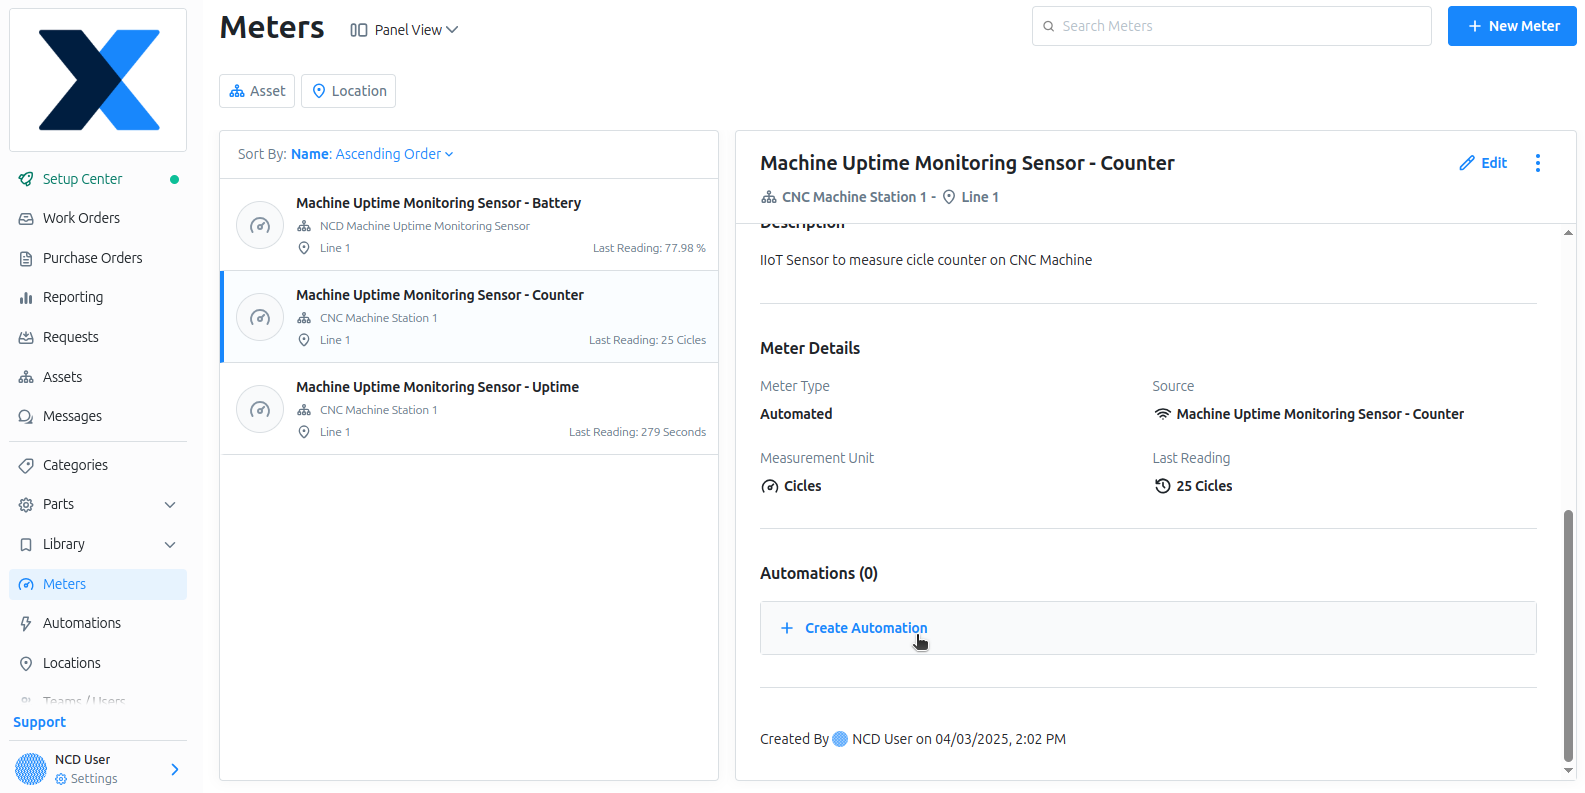
Create Automated Meter
In this section, we will cover the procedure to create Automated Meters — you’ll find these steps very intuitive.
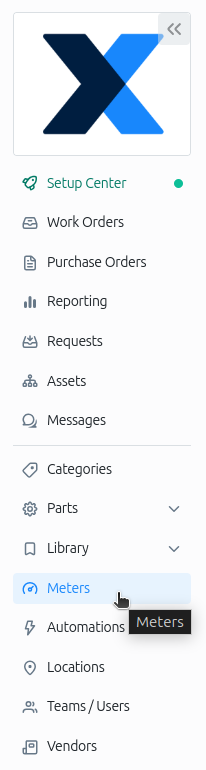
Step 1. Go to the main menu and click on Meters.
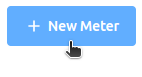
Step 2. Click on the New Meter button, located at the top right side.
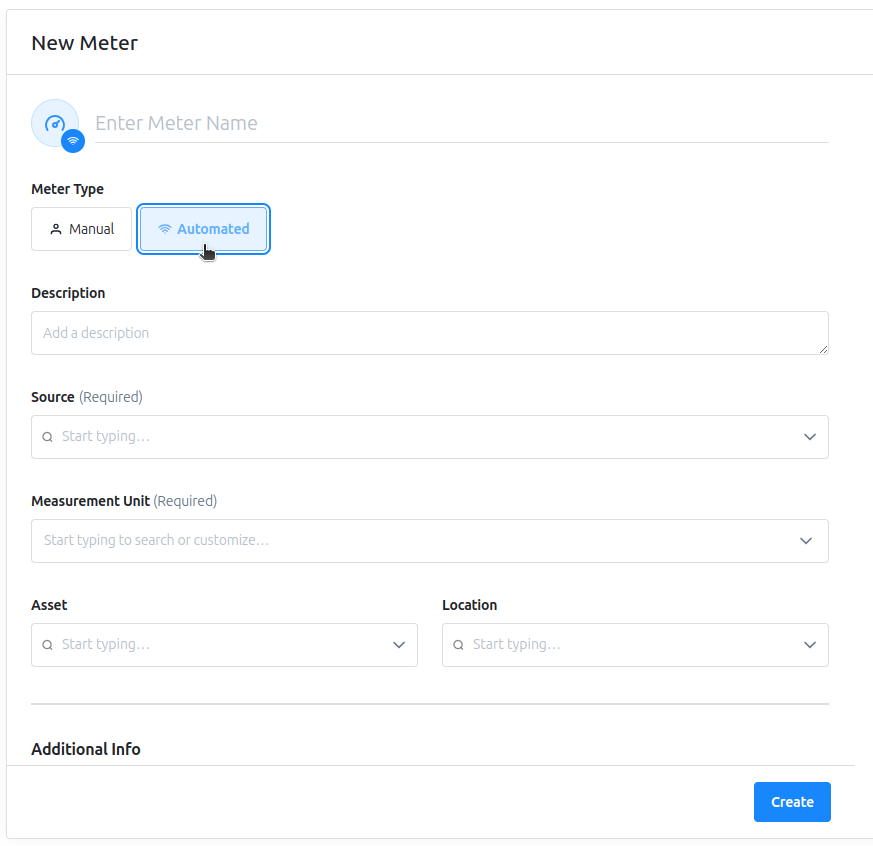
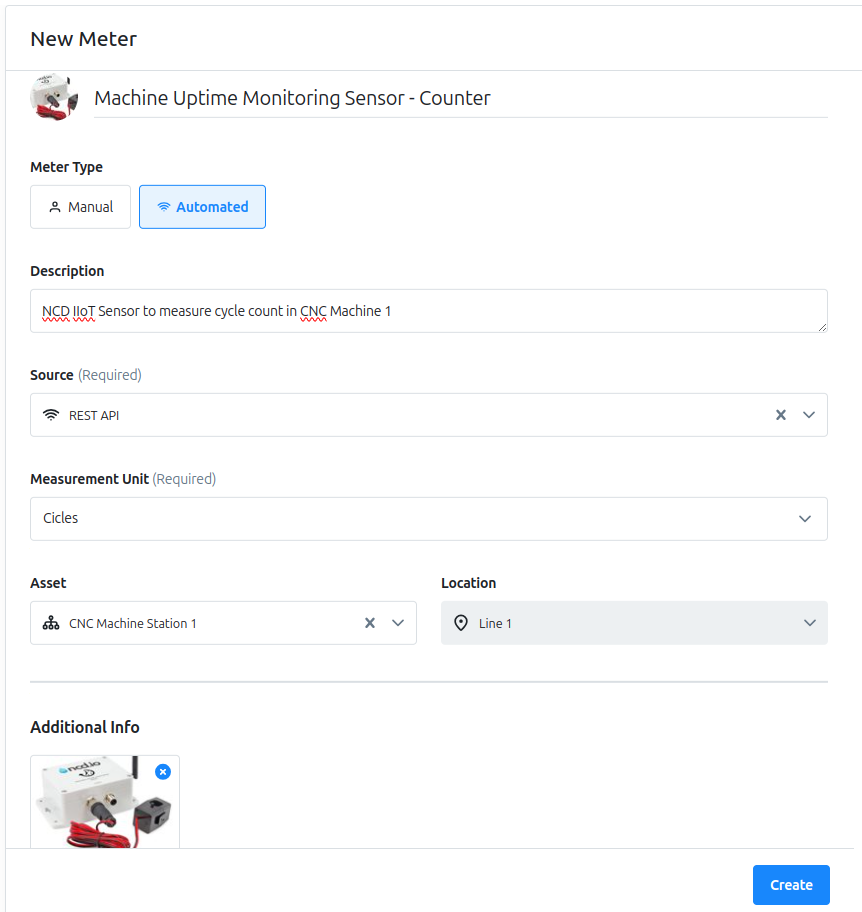
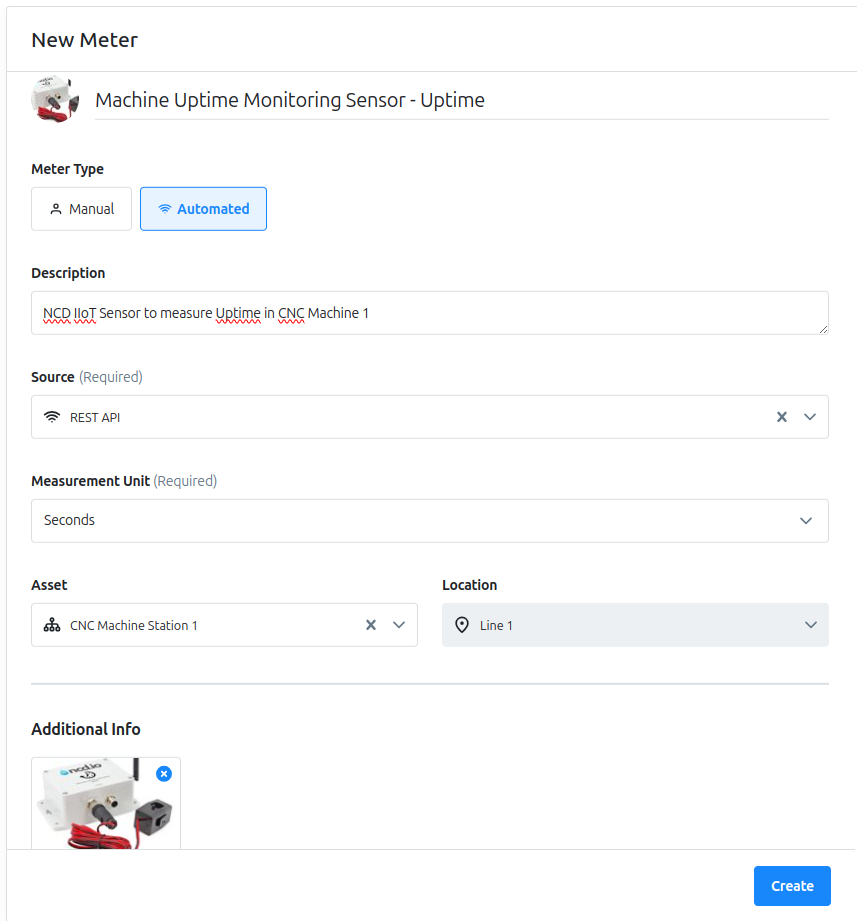
Step 3. You will need to enter all the Automated Meter properties. An important point is to set the Meter Type property as ‘Automated’.
For this example, we created three meters: counter, uptime, and battery percentage. The counter and uptime meters will be used to monitor our asset (CNC Machine Station 1), while the battery percentage meter will allow us to monitor the battery level of the Machine Uptime Monitoring Sensor itself.
Click to Expand
Click to Expand
Click to Expand
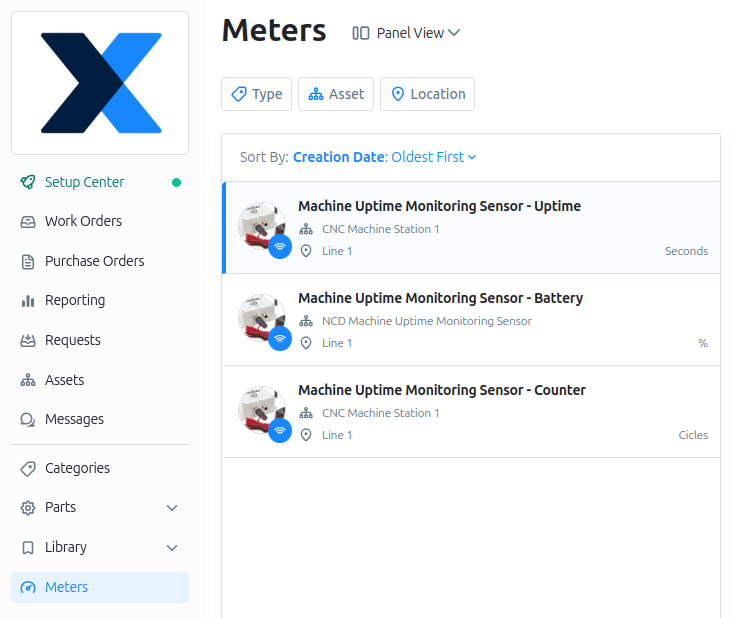
After you create your Automated Meters, you should be able to see all of them listed in the Meters section under the Main Menu.
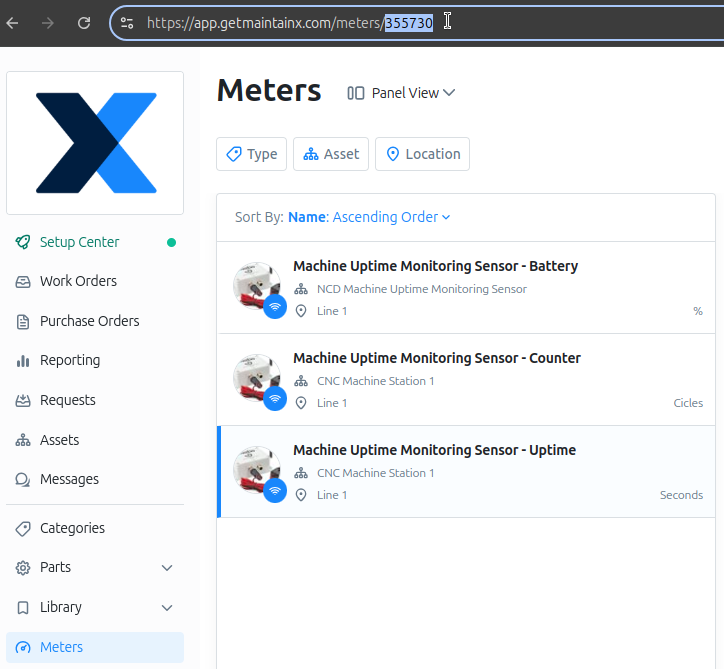
Get Meter ID
After you create your Automated Meters, you will need to get the Meter ID — this is a unique value assigned to each Meter in MaintainX. We will use this value to configure the Node-RED flow, linking the flow-generated meter readings to the corresponding Automated Meter.
To get the Meter ID, go to your MaintainX account, click on the Automated Meter of interest, and open the Meter. In your browser, the HTTPS address will display a number at the end—this is the unique ID for that Meter.
We recommend saving this value in a text editor, as you’ll need it in the next section.
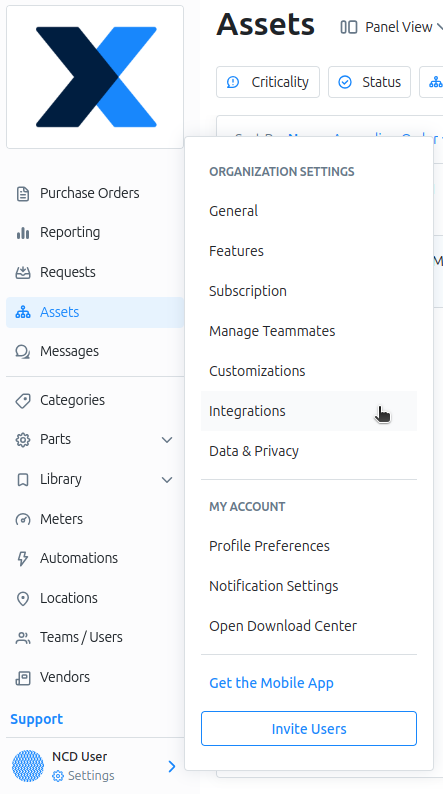
Create Token
An API token is a secure key that allows Node-RED to communicate with the MaintainX platform via its REST API. It acts as a digital credential, authenticating requests to access and manage data like work orders, assets, and sensor readings (e.g., battery percentage from the Machine Uptime Monitoring Sensor). In this section, we’ll create a token in MaintainX to enable Node-RED to send data, such as the CNC Machine’s cycles and uptime or the sensor’s battery level.
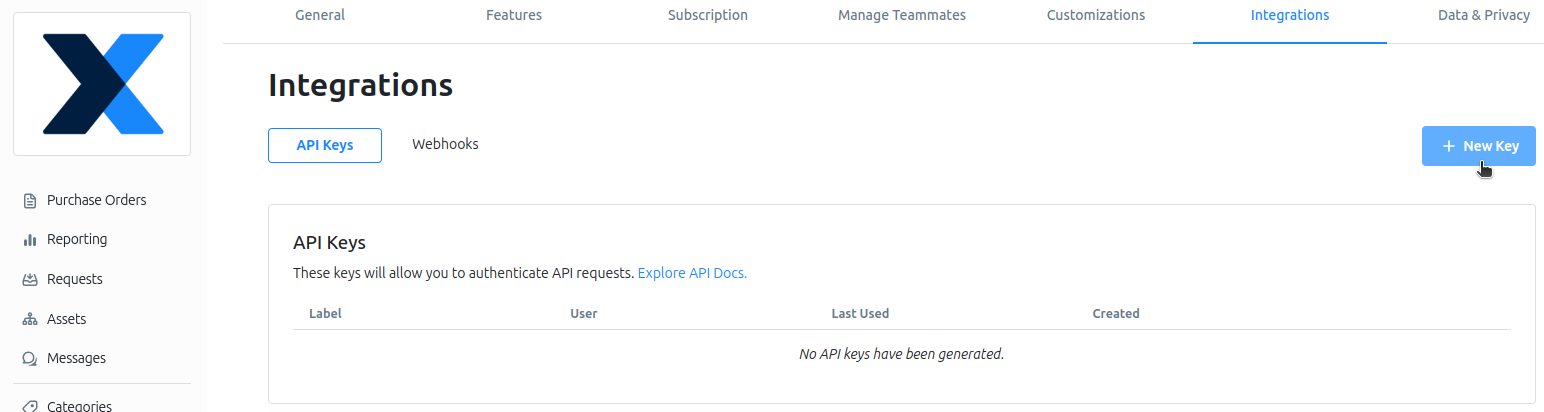
Step 1. To create a token, go to Settings in the bottom left sidebar of MaintainX and click the Integrations option.
Click to Expand
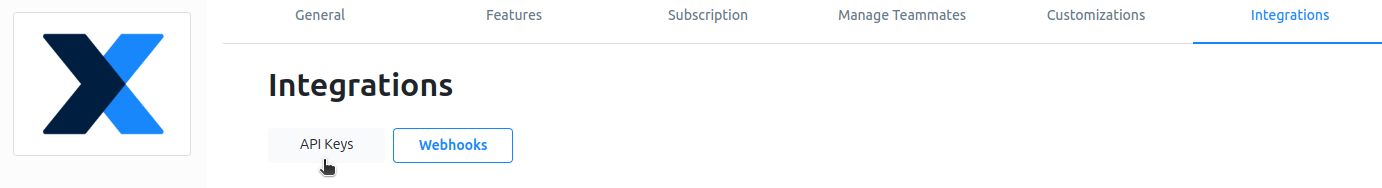
Step 2. Next, click the API Keys option.
Click to Expand
Step 3. Next, click the New Key button located at the top right.
Click to Expand
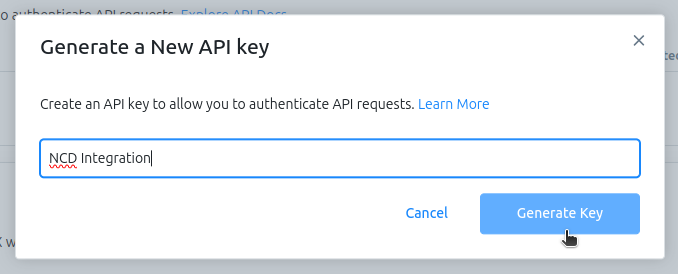
Step 4. Next, assign an API key name—for this example, we’ll use “NCD Integration”—then click the Generate Key button.
Click to Expand
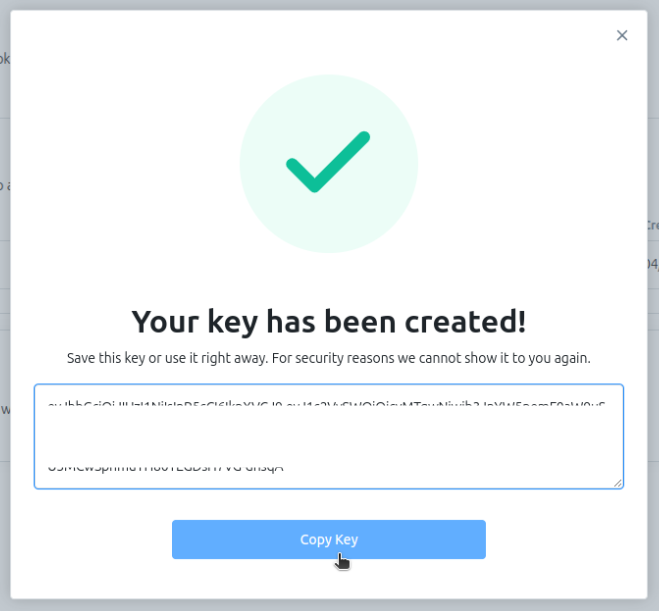
Step 5. A pop-up window will appear confirming that your key has been successfully created. Make sure to copy and store this key in a secure location — it will not be shown again. We’ll use this token later in Node-RED to establish communication with MaintainX, so it’s an essential requirement.
Click to Expand
Node-RED Flow
Now it’s time to configure the Node-RED flow to send your NCD sensor data to MaintainX. For this important step, we’ve developed a pre-built Node-RED flow that you can import and use as a reference. You can follow the guide and use this flow as a starting point, adapting or modifying it to match your specific NCD sensor, as many sensors share a similar payload structure.
Importing
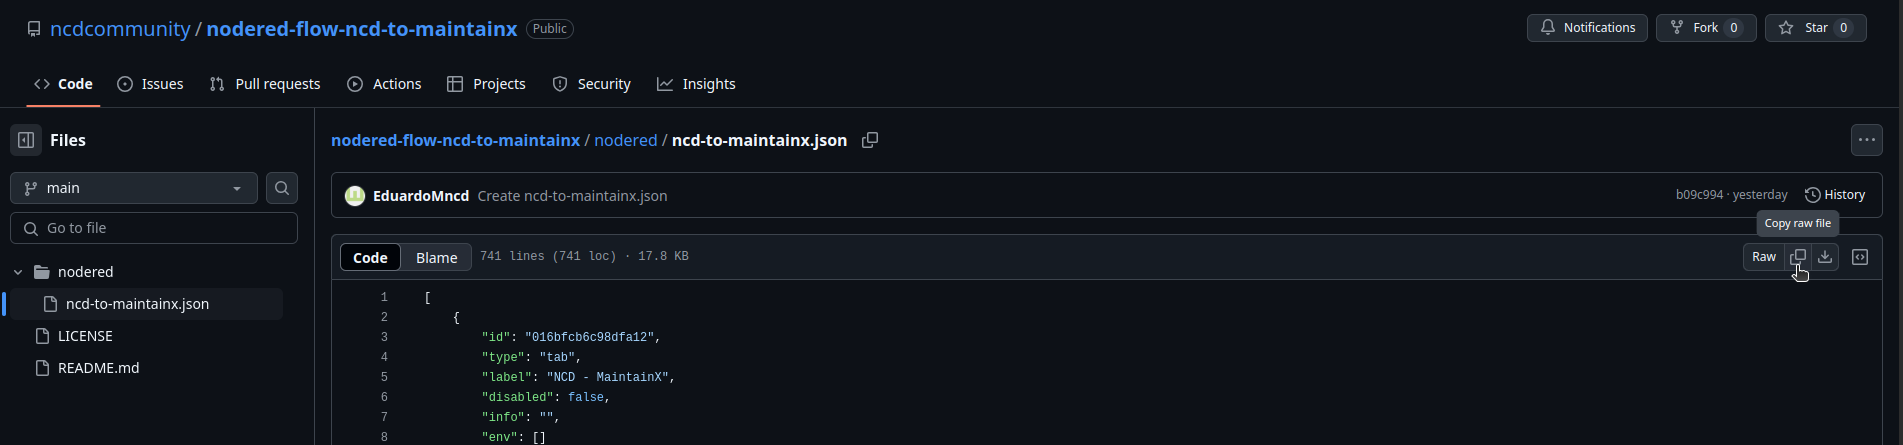
Repository
Step 1. To use this flow, you’ll need to access our GitHub repository and copy the Raw JSON code.
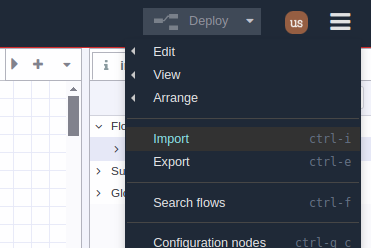
Step 2. Then you will need to click on the main menu in the top-right corner of Node-RED, then select the Import option.
Click to Expand
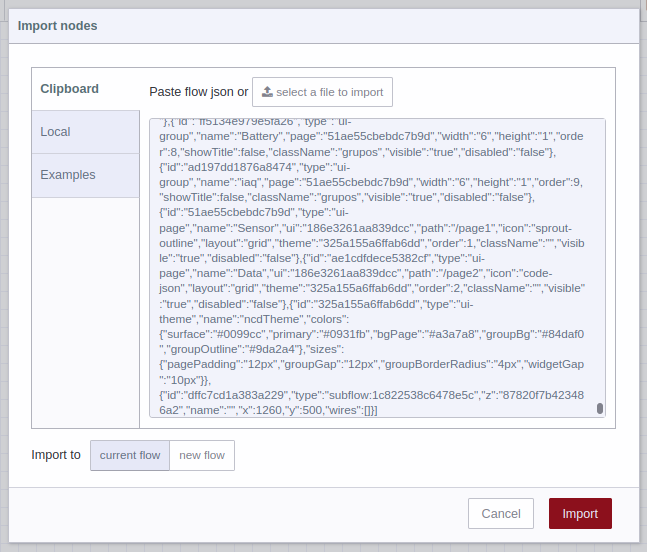
Step 3. The next step is to paste the code into the text input, and click on the Import button.
Click to Expand
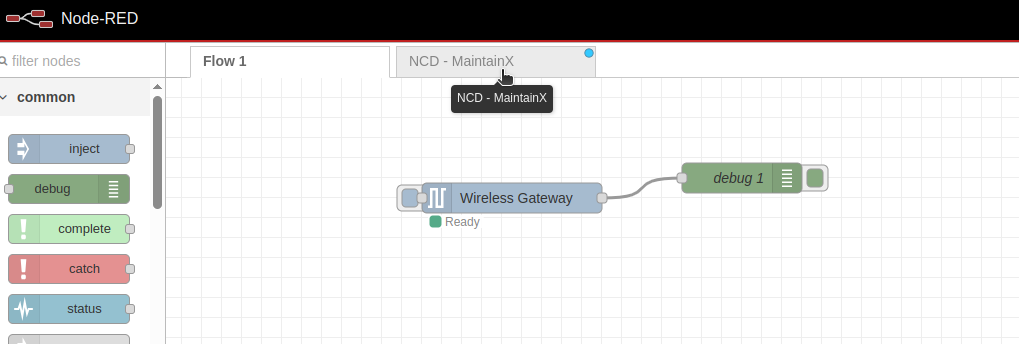
Step 4. As soon as you import the flow, you should see the ‘NCD – MaintainX’ tab. You should click on it.
Click to Expand
You should see something similar to this on your workspace.
Click to Expand
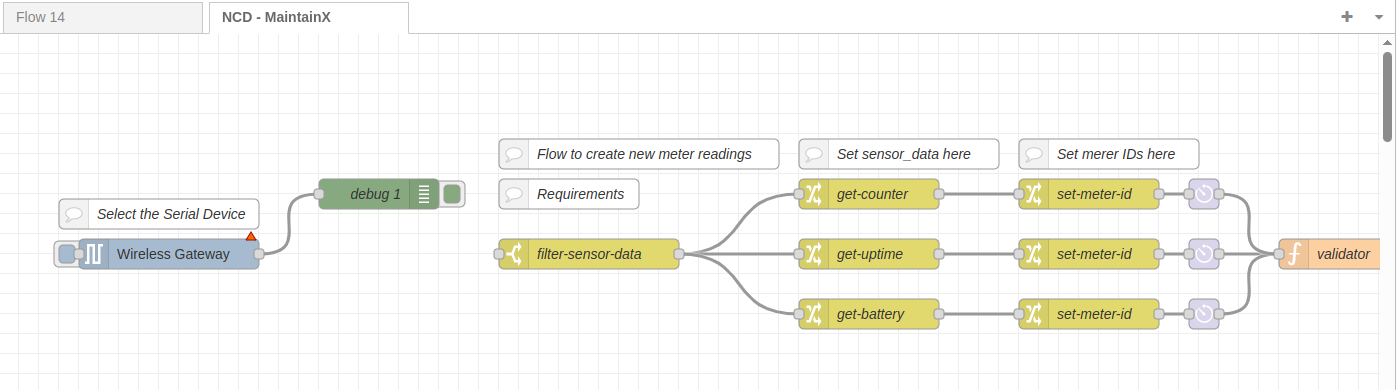
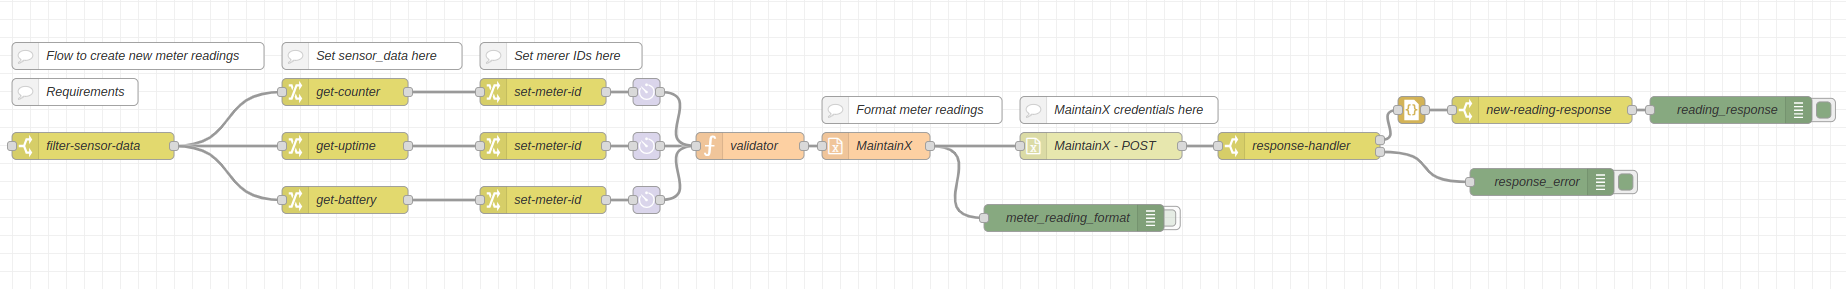
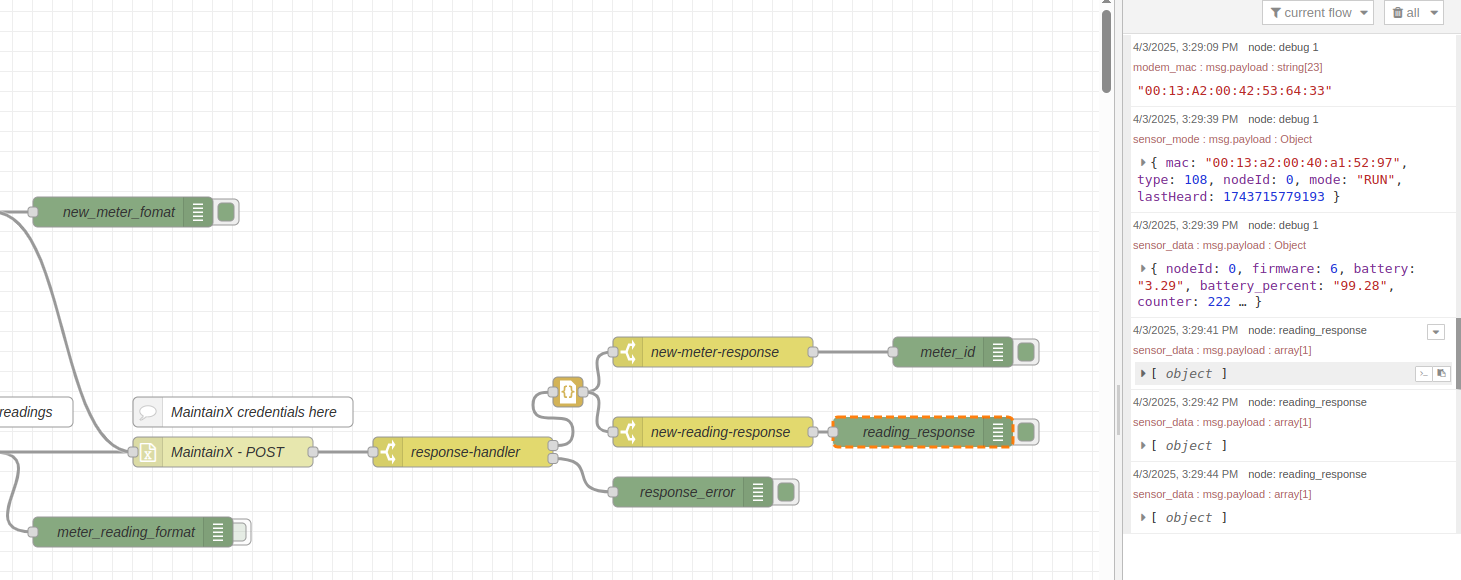
Flow Overview
In this section, we will overview the NCD to MaintainX flow.
This flow is used to create readings for specific automated meters. It takes the sensor data, formats it according to the MaintainX API, and sends the data to the corresponding automated meter ID.
Click to Expand
Configuring
You will need to configure the flow, which means setting some properties before deploying and enabling it. These properties include the Serial Device for communication, setting the token, Automated Meter IDs, and other details that will be explained in the next section.
Set Serial Device
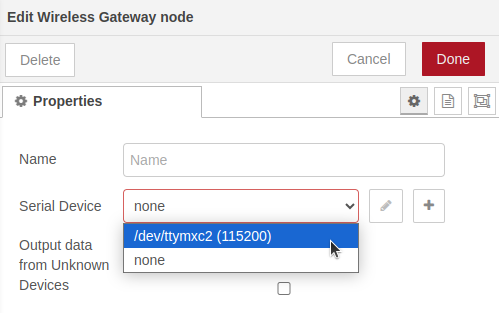
The first setting is to configure the Serial Device property. This is the configuration node that the Wireless Gateway will use to communicate with the Gateway or modem’s wireless module. If you are working with an Enterprise IIoT Gateway, you will need to select your actual ‘/dev/ttymxc2’ configuration. If you are using an NCD Modem, you should select the corresponding port used to communicate with the wireless module.
Click to Expand
Click to Expand
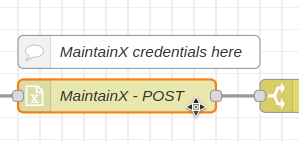
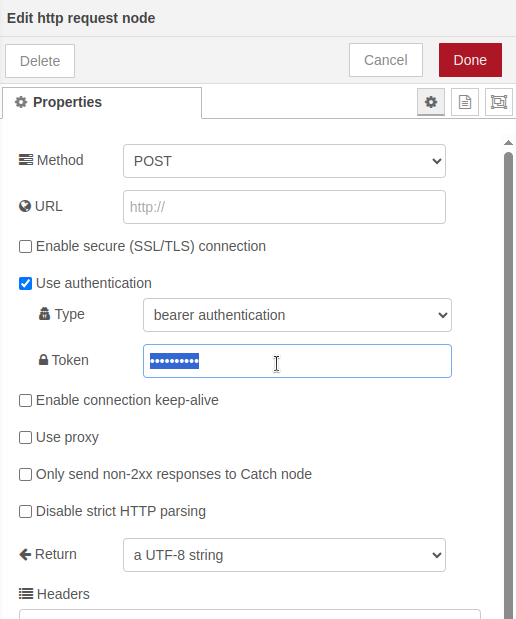
Set Token
With the API token created, we can now configure Node-RED to communicate with MaintainX. This token will authenticate requests, allowing Node-RED to send data from the NCD Machine Uptime Monitoring Sensor—such as the CNC Machine’s cycles, uptime, and the sensor’s battery percentage—to MaintainX.
To set the token in your Node-RED flow, access the MaintainX – POST HTTP node by double-clicking it, then copy and paste your API token into the Token property.
Click to Expand
Click to Expand
New Meter Readings
Now that we’ve completed the automated meter creation for each of our variables, the next step is to configure the flow to send or create a meter reading. This process involves retrieving the Machine Uptime Monitoring Sensor data, processing it, assigning the corresponding Meter ID, and formatting the payload according to the API structure. The following sections will show how to set up the creation of automated meter readings.
Sensor data
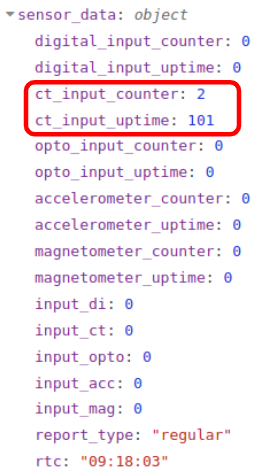
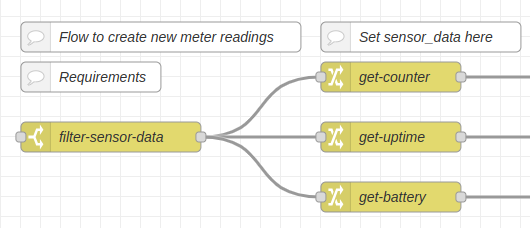
The filter-sensor-data node allows us to filter sensor_data messages. These sensor_data messages are part of the main sensor message and include the battery percentage, firmware version, sensor name, and main field variables. As discussed in the previous section, this sensor supports various types of inputs, but we’ll focus on the current input counter, current input uptime, and battery percentage. At the filter-sensor-data node, we have three Change nodes connected. These nodes extract the property of interest and assign it to a new property called msg.value, which will contain the value of the field variable once the flow receives sensor data.
msg.value = payload.sensor_data.ct_input_counter;
msg.value = payload.sensor_data.ct_input_uptime;
msg.value = payload.battery_percent;
Click to Expand
ImportantBefore this step, you can perform tests or create logic in Node-RED to condition the values of the field variables before sending them to MaintainX. This allows you to implement basic logic or filters to avoid sending excessive, unnecessary incoming data to the MaintainX platform. This is an important consideration.
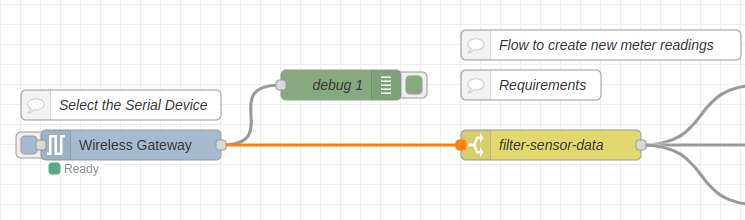
In this step, connect the output of the Wireless Gateway node to the input of the filter-sensor-data node.
Keep in mind that after completing this step, the next time you deploy your flow, all sensor data messages will be sent to the MaintainX platform. For this reason, we recommend running some tests locally first and adding logic to ensure that only relevant or necessary data is sent—for example, when critical thresholds are reached. You can also configure the Machine Uptime Monitoring sensor according to your application’s specific requirements.
Click to Expand
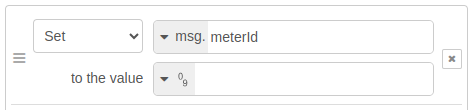
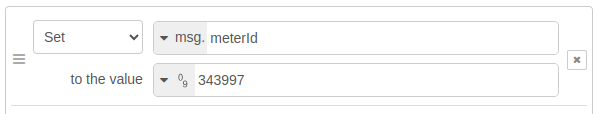
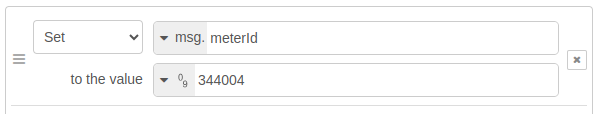
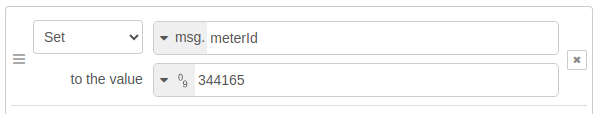
Set Meter Id
The next step is to set the corresponding Meter ID. This value allows Node-RED to write data to the MaintainX platform, enabling MaintainX to identify which Automated Meter ID the incoming reading value belongs to. It’s the method MaintainX uses to correctly associate the data with the appropriate meter.
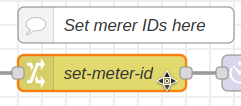
Each Automated Meter has its own unique ID. To enter the Meter ID into the Node-RED flow, we use the set-meter-id nodes. To access these nodes, simply double-click on the node, and you will see a number input where you should enter the corresponding Meter ID.
Click to Expand
NoteRemember that for this example flow we created three meters; counter, uptime and battery percent, and each one has its unique meterId.
You will need to set the meterId for each Automated Meter created by entering the corresponding numeric value into each set-meter-id node.
Meter ID for counter Automated Meter
Meter ID for Uptime Automated Meter
Meter ID for battery Automated Meter
We’ve added delay nodes after the meterId nodes. This allows the flow to transmit the data for each value sequentially and receive the corresponding response for each one.
Meter Readings API
The API structure for meter readings and type of values is as follows:
Property
Type
Description
meterId (required)
number
Global ID of the meter
value (required)
number
The reading value given by the meter
readingDate
string or null
Date at which the meter was read. This date can be set in the past, but cannot be further than 3 days for Automated Meters.
We use a function node that allows us to extract the meterID, value, and reading date, formatting the data according to the Meter Reading API requirements. The code used inside the function node is as follows:
In order to save and apply the changes, you will need to deploy the flow by pressing the Deploy button.
Sensor Transmission
Now, everything will be ready to create new meter readings. Each time sensor data is received, Node-RED will transmit this data to the corresponding Automated Meter ID in MaintainX.
To test this, we can trigger a sensor transmission manually. This allows you to force a new sensor message without having to wait for the next scheduled transmission. You can do this by pressing the internal reset button on the sensor.
Click to Expand
Once you press the reset button or receive a new sensor data transmission, if all settings are correct, you should see reading responses in the debug window. This indicates that MaintainX has successfully received the Automated Meter Readings from the Machine Uptime Monitoring Sensor. This serves as a confirmation method for newly created Automated Meter Readings.
Click to Expand
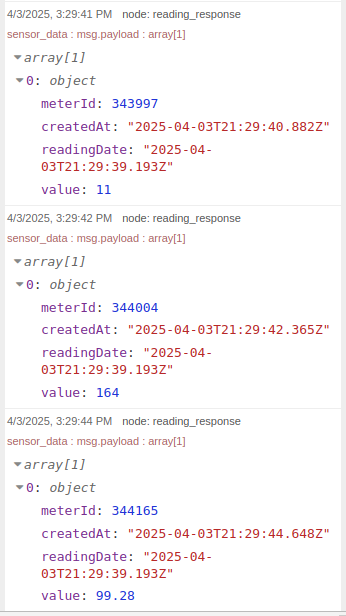
Reading Response
Each reading response will include the Meter ID, the date when the new reading was created, and the value of the Automated Meter reading itself. You can see an example of the reading response in the following image.
Click to Expand
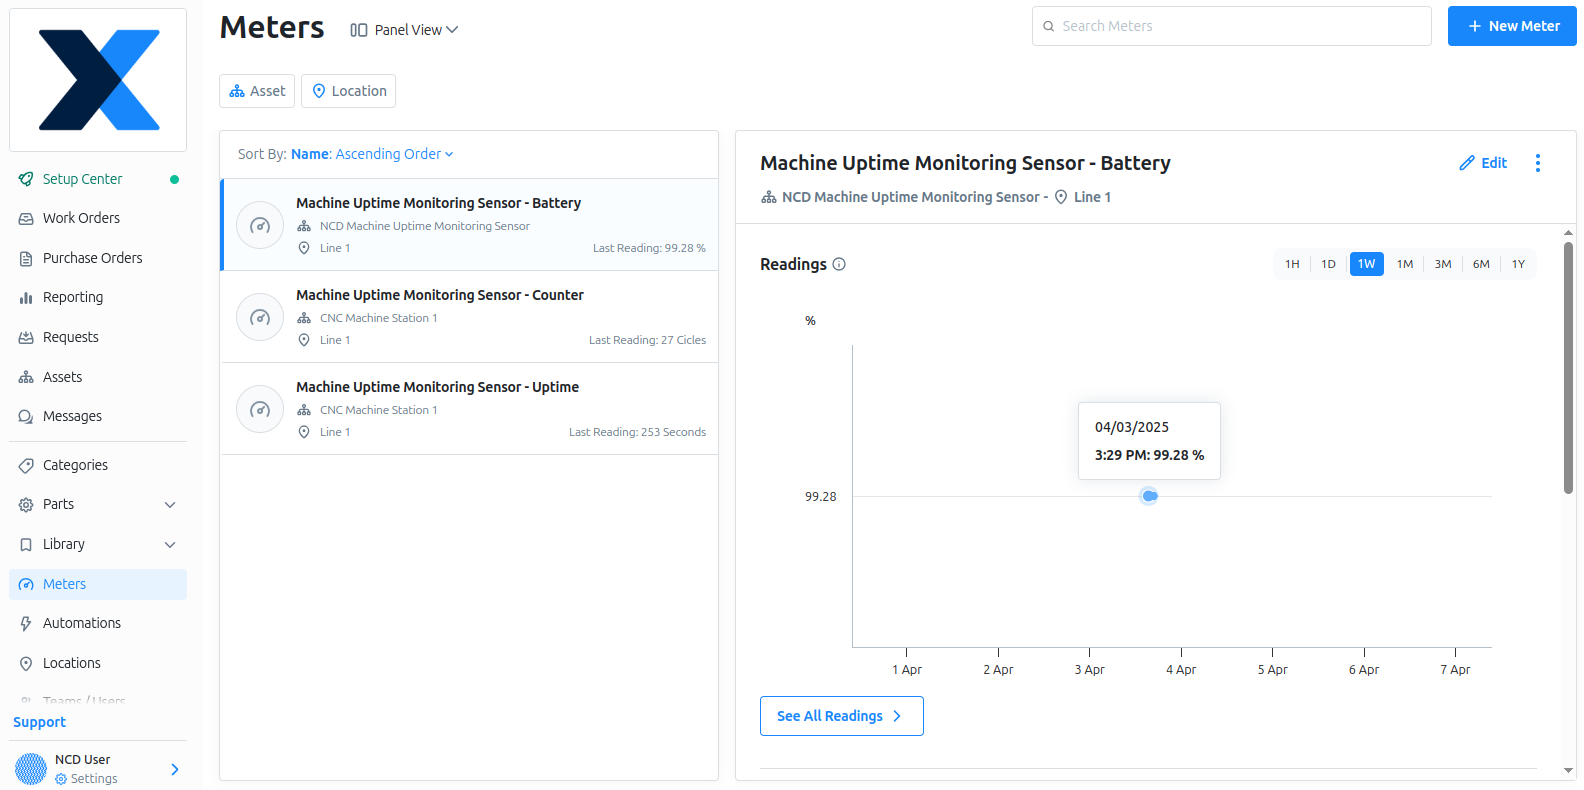
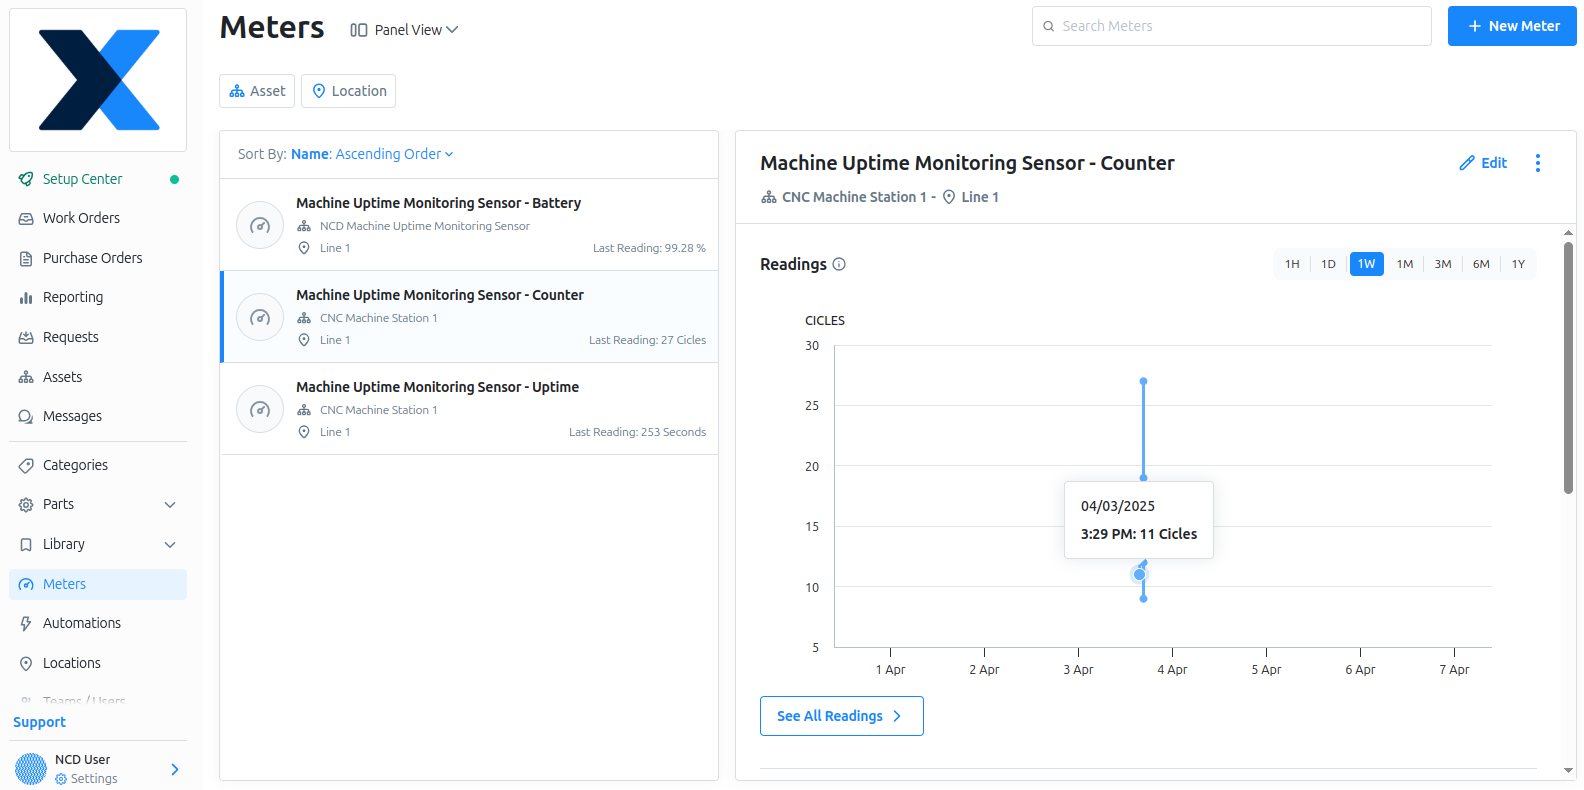
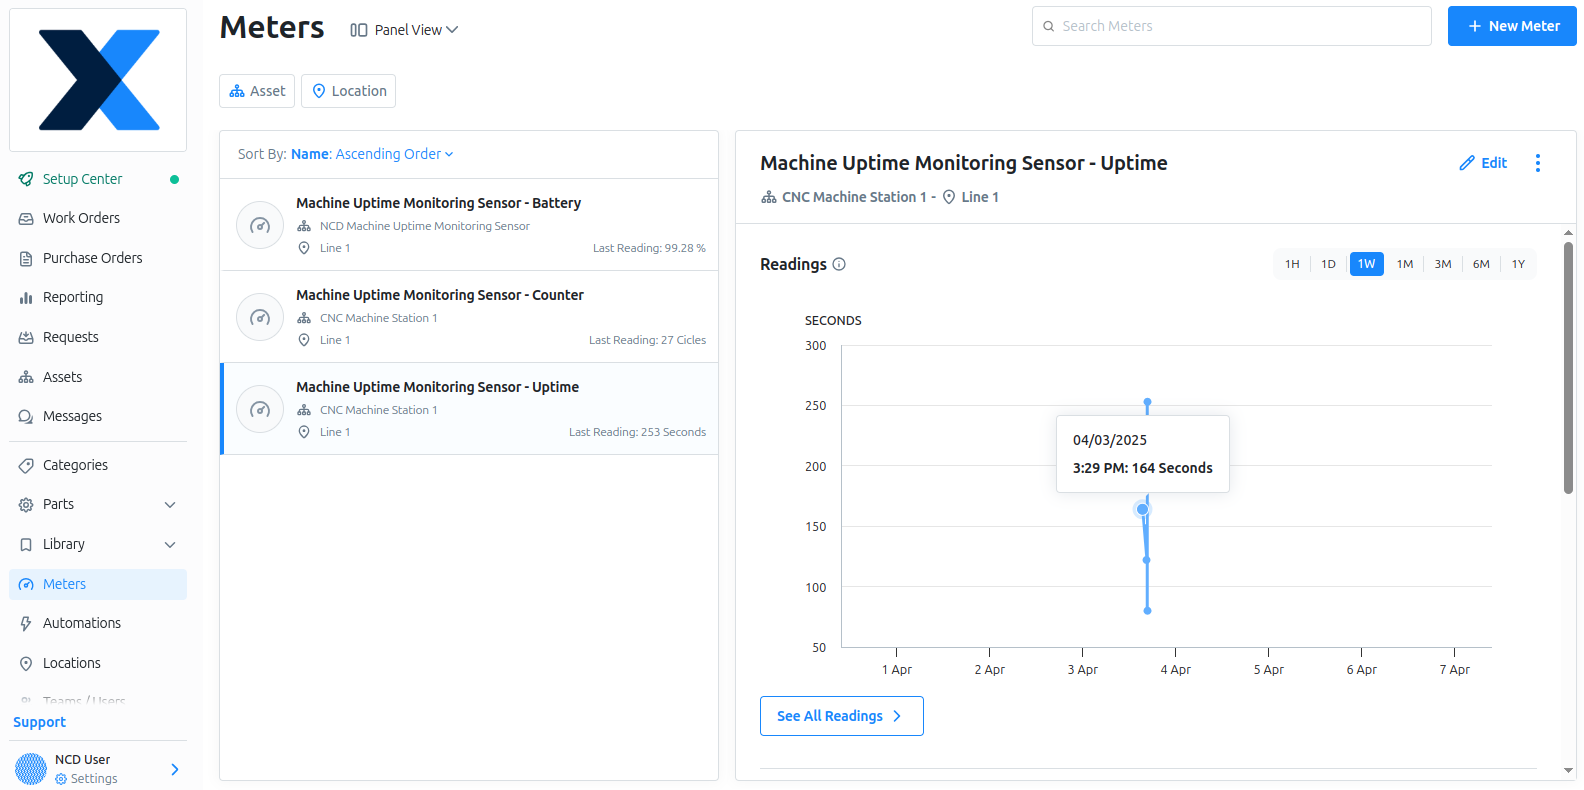
After enabling the flow, in your MaintainX account under the Meters section, you should be able to see the new Automated Meter Reading for each of your Automated Meters. The following images are examples of the Automated Meter Readings in the MaintainX platform.
Click to Expand
Click to Expand
Click to Expand
Response Errors
This section will show you the response samples for creating a new meter and creating a new reading. It includes the code and description. For more information, please consult the official MaintainX documentation.
Create new meter – Response samples
Code
Description
400
Missing x-organization-id header.
502
The creation of the source associated with this meter failed.
Create new Reading – Response samples
Code
Description
400
Unexpected error
403
Forbidden
404
meter Not Found
429
Too Many Requests. Manual meter readings are limited to 1 every 6h 00m 00s. For a higher recording frequency please use Meters of type IoT. Contact info@getmaintainx.com for help.
Plus: Trigger Work Order and Email Notification
An automation in MaintainX is a rule that triggers actions, such as creating a work order or sending an email notification, based on specific conditions like sensor data thresholds. In this section, we’ll show how to create an automation to trigger a work order and email notification based on the Machine Uptime Monitoring Sensor data (e.g., when the battery percentage drops below 70%). This example serves as a foundation for your broader maintenance plan or CMMS platform, which you can scale as needed. We’ll also include a procedure as a reference for creating automations in MaintainX, explaining the step-by-step process in this section.
Trigger Work Order Based on Battery Percent
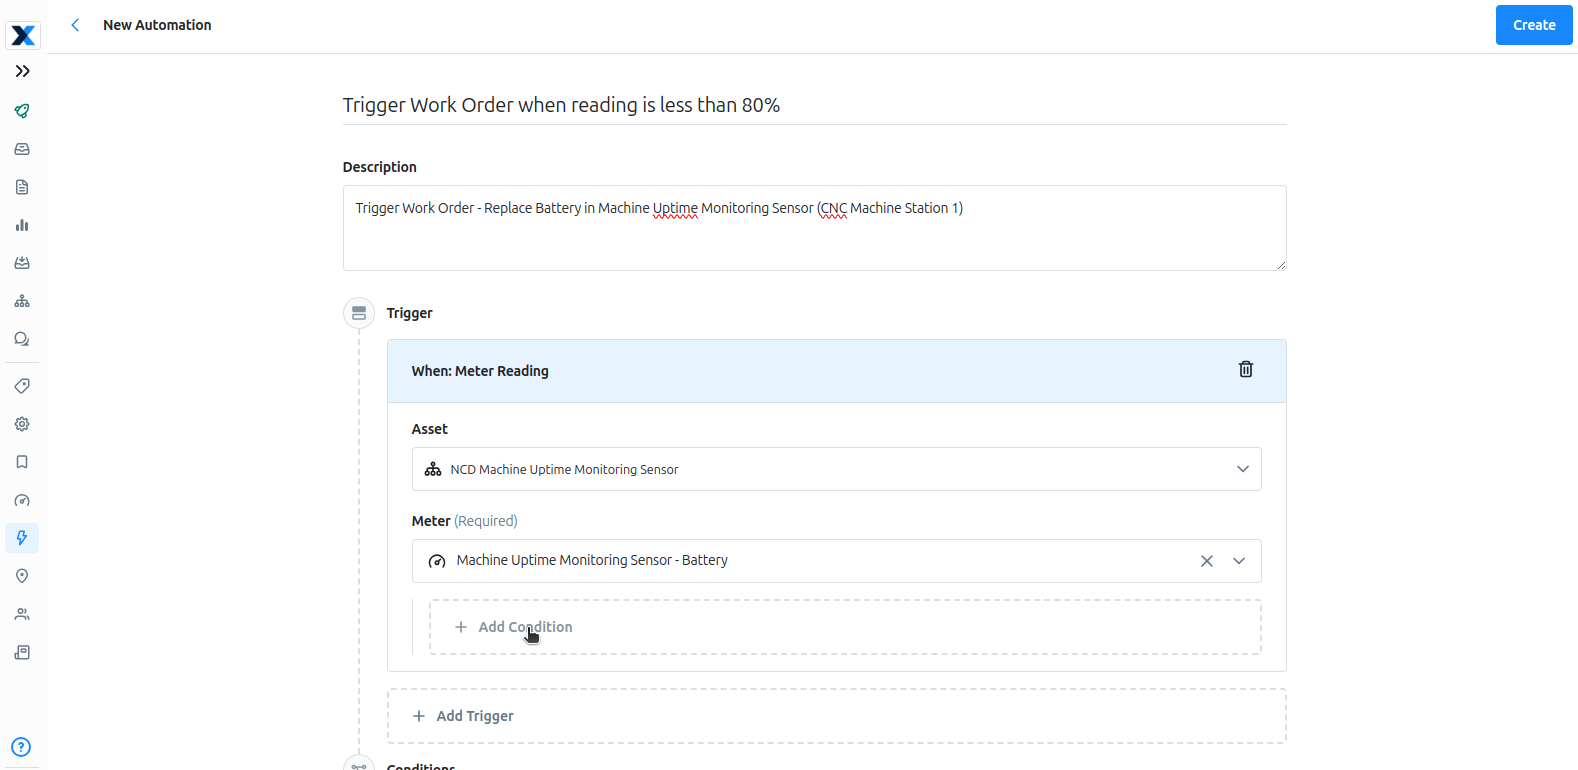
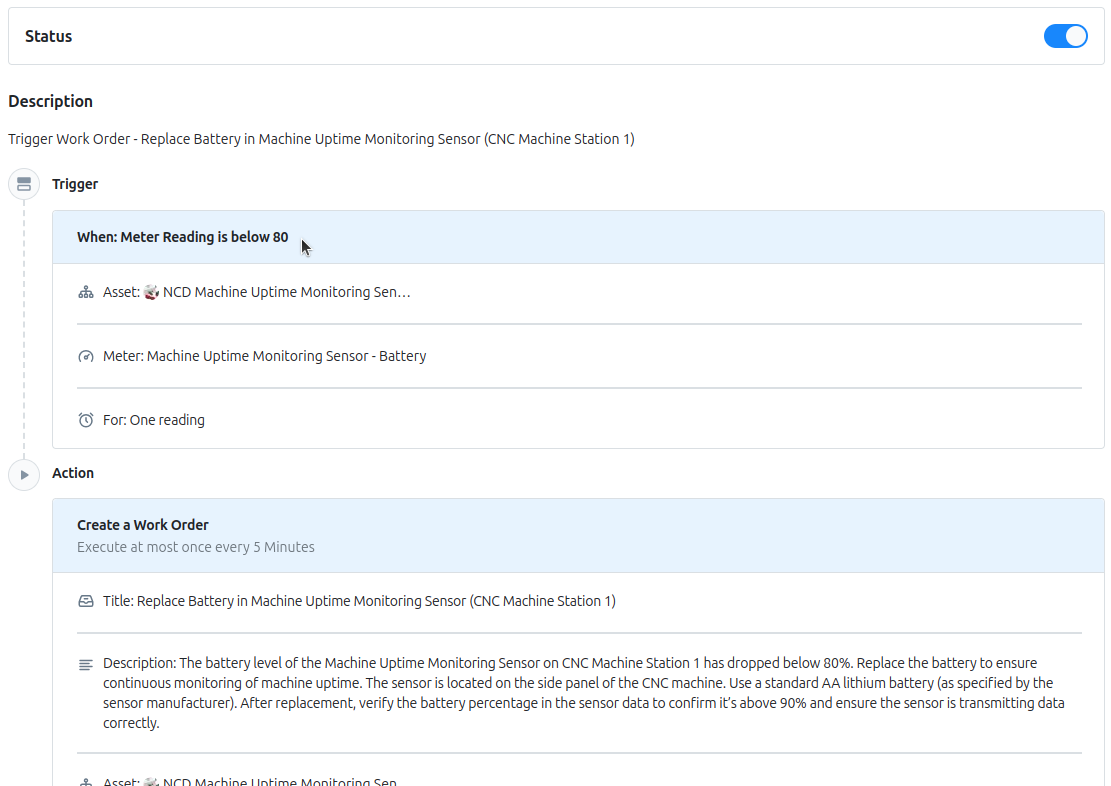
We’ll start with an automation to trigger a work order based on the battery percentage. This work order will activate when the value of the battery percentage automated meter falls below a defined threshold, instructing the replacement of the batteries in the Machine Uptime Monitoring Sensor. First, select the Machine Uptime Monitoring Sensor – Battery Automated Meter, then click Create Automation.
Click to Expand
Next, assign an automation name and description in the text input fields.
Click to Expand
The next step is to click on the “Add condition” option.
Click to Expand
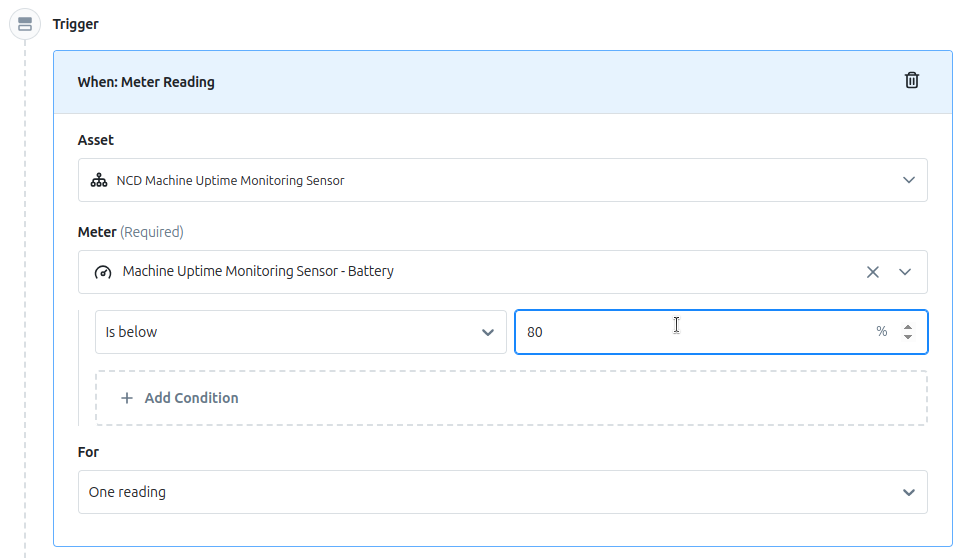
The next step is to select the ‘is below’ option as the condition and enter the percent value. In this case, we will use 80%. This means the automation will trigger the work order when the battery value falls below 80%.
NoteYou can add multiple conditions in the same MaintainX automation.
Click to Expand
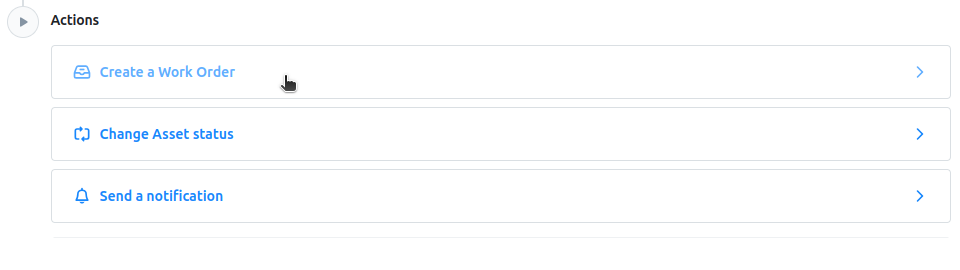
Then, scroll down and click on ‘Create a Work Order’ under the Actions section.
Click to Expand
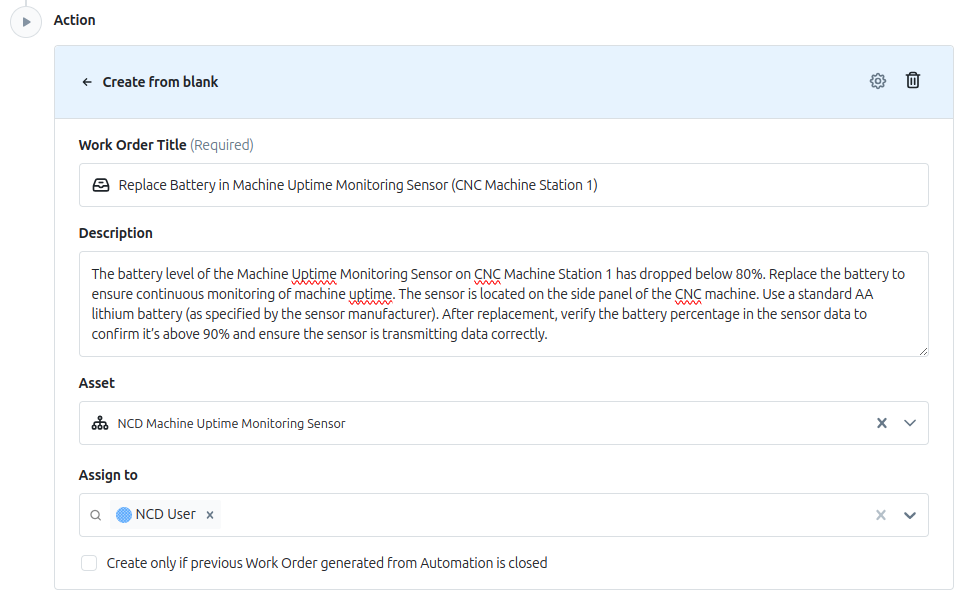
Next, click on ‘Create from blank’ and enter the work order title, description, asset, assignee, and all relevant work order properties. For this example, we use the following:
Click to Expand
To create the Automation you will need to click on ‘Create’ button
The next window will display the automation details and its current status. You should see something similar to this:
Click to Expand
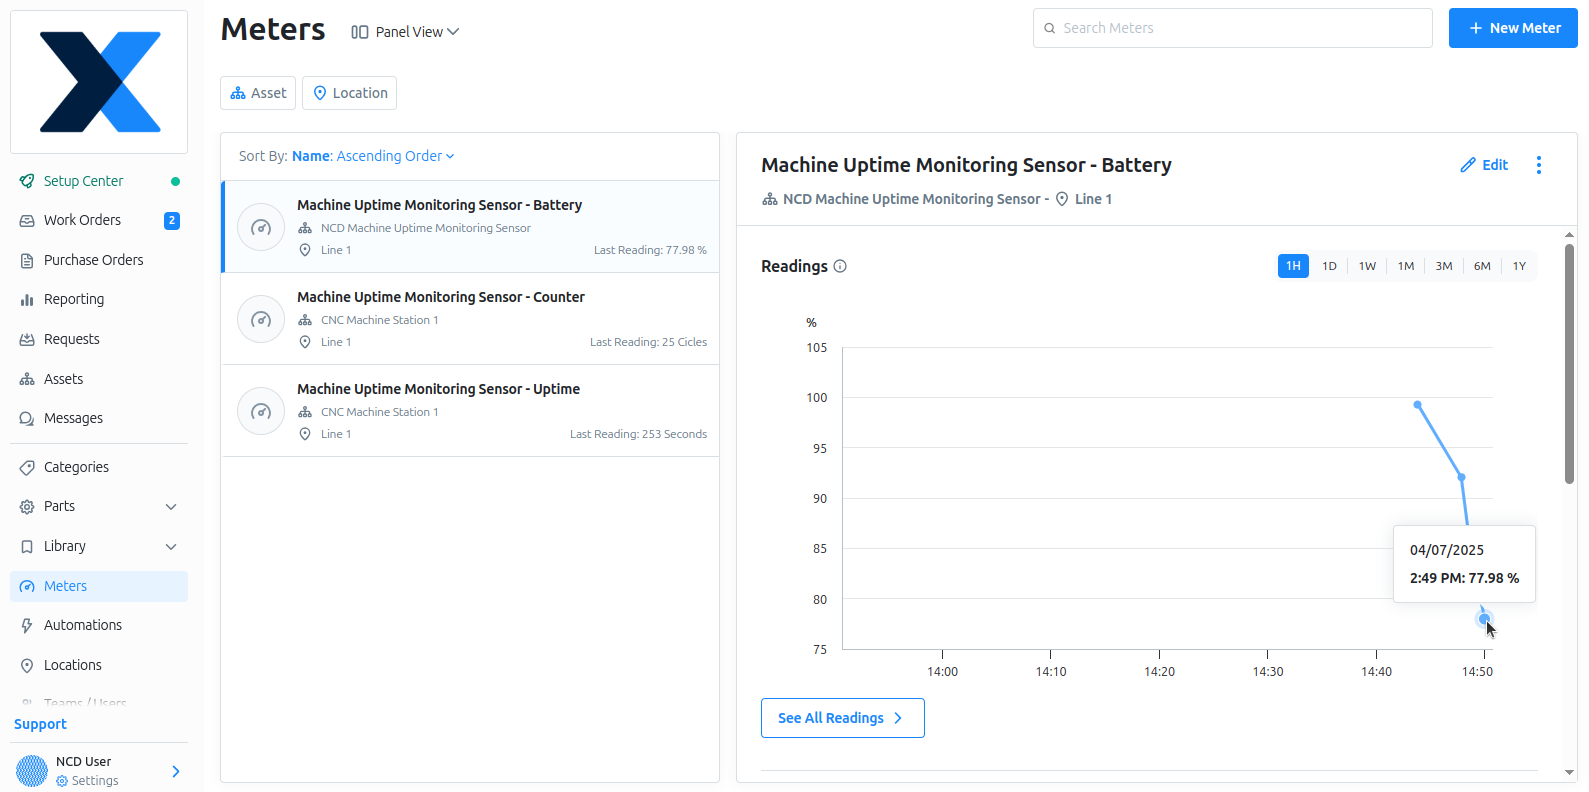
Now we can monitor the battery percentage value. If it falls below 80%, the MaintainX automation should automatically generate a Work Order. As an example, the image on the right shows a simulated battery level at 77%.
Click to Expand
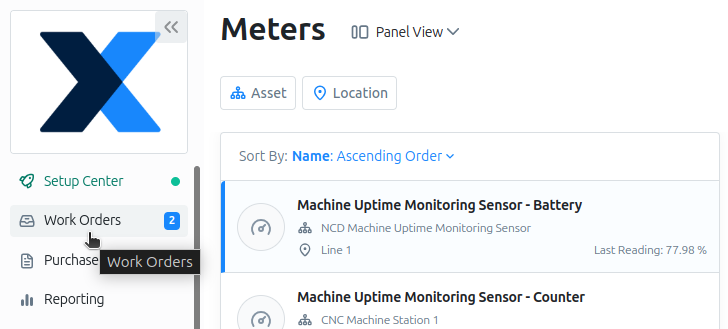
As soon as MaintainX detects this value, it will automatically create the Work Order. You can view it by navigating to the Work Orders section from the main menu.
Click to Expand
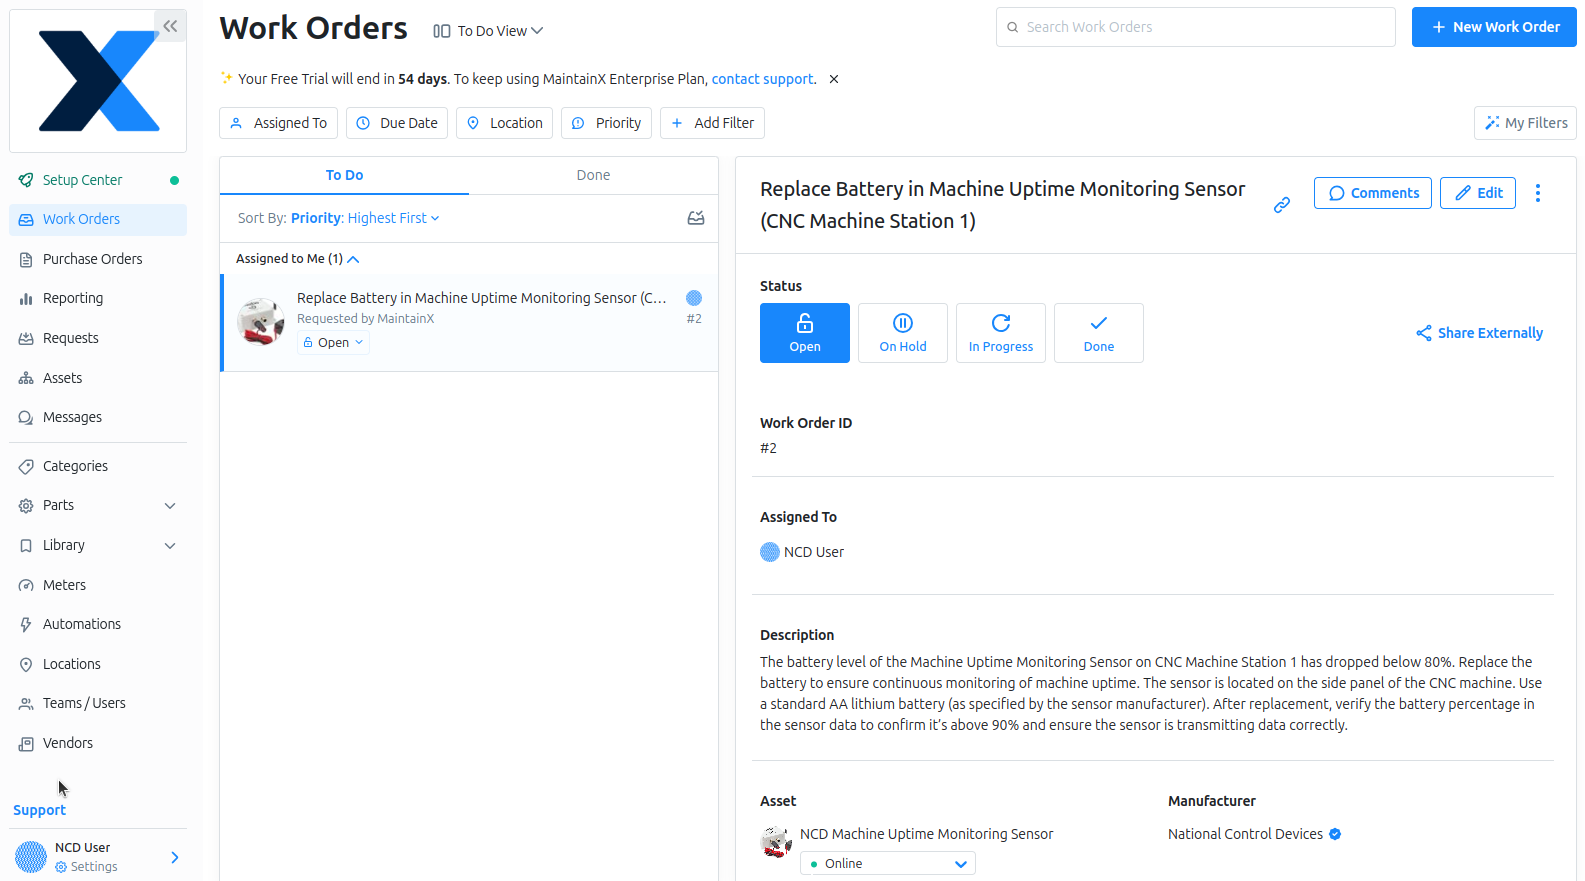
And you can see that the Work Order has been created, as shown in the following image.
Click to Expand
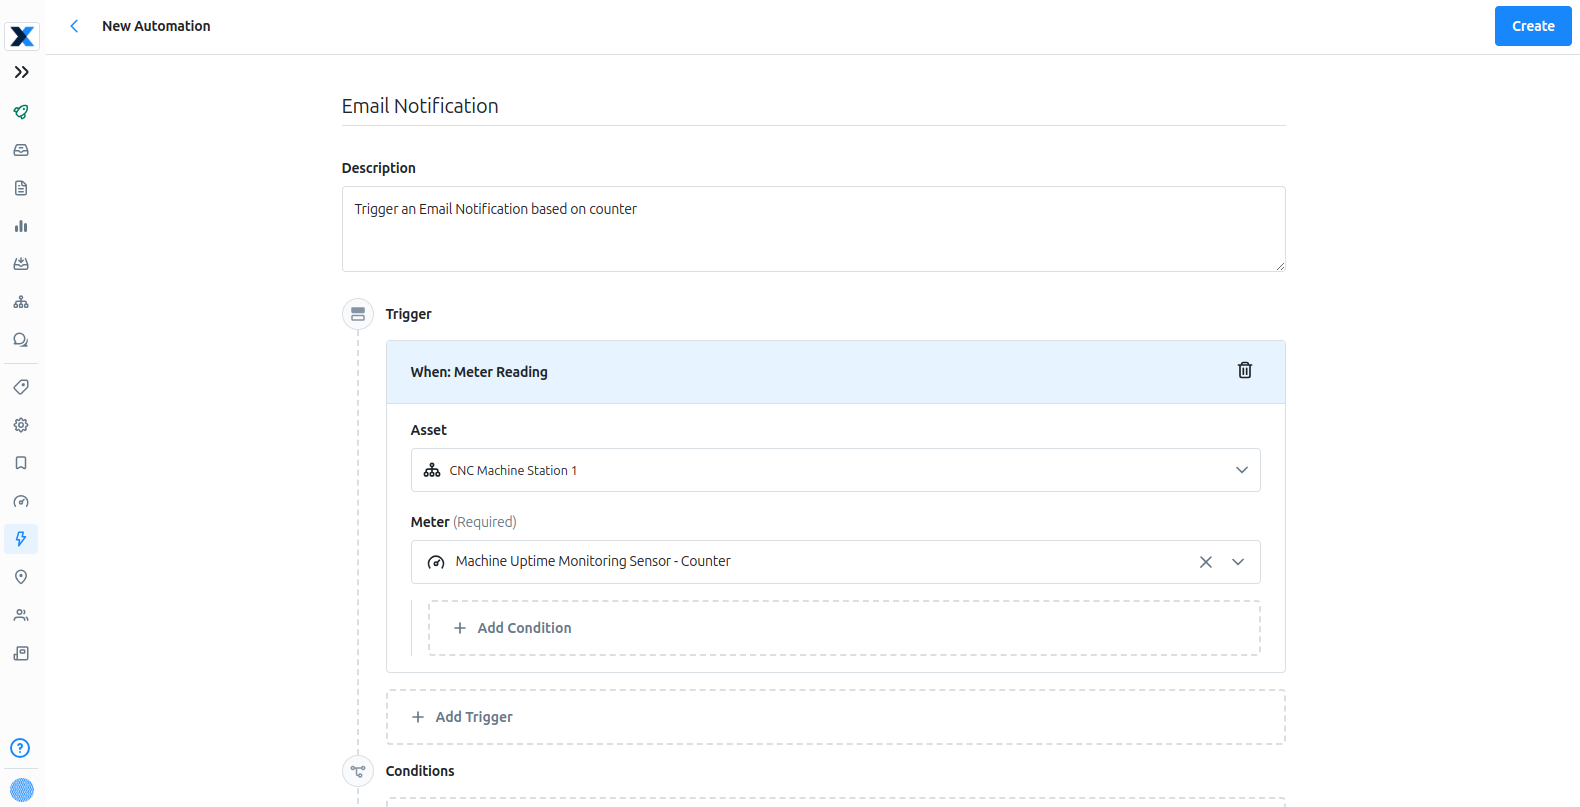
Trigger Email Notification Based on Sensor Counter
This next example demonstrates how to create an automation to trigger an email notification. The first step is to go to the Automated Meter section and select the meter you want to use for the automation, in this case, the Machine Uptime Monitoring Sensor Counter. Then, click on the Create Automation option.
Click to Expand
The next step is to assign a name to the automation and add a description.
Click to Expand
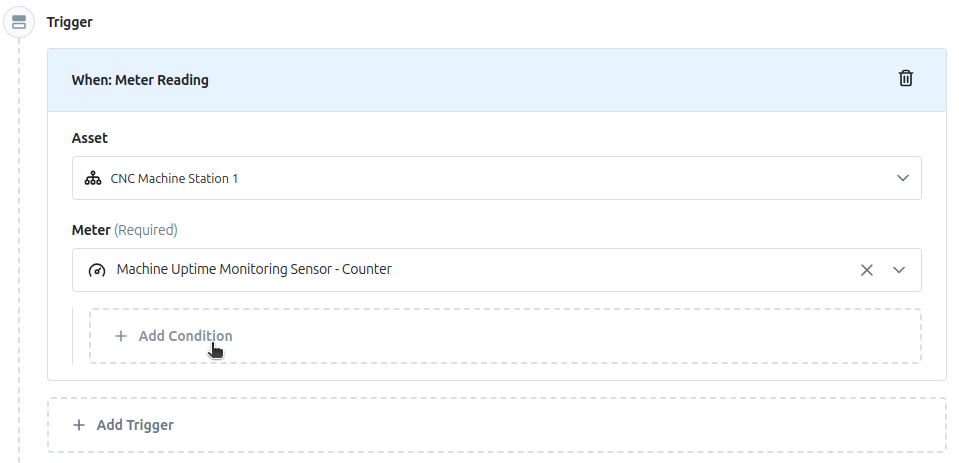
The next step is to click on Add condition option
Click to Expand
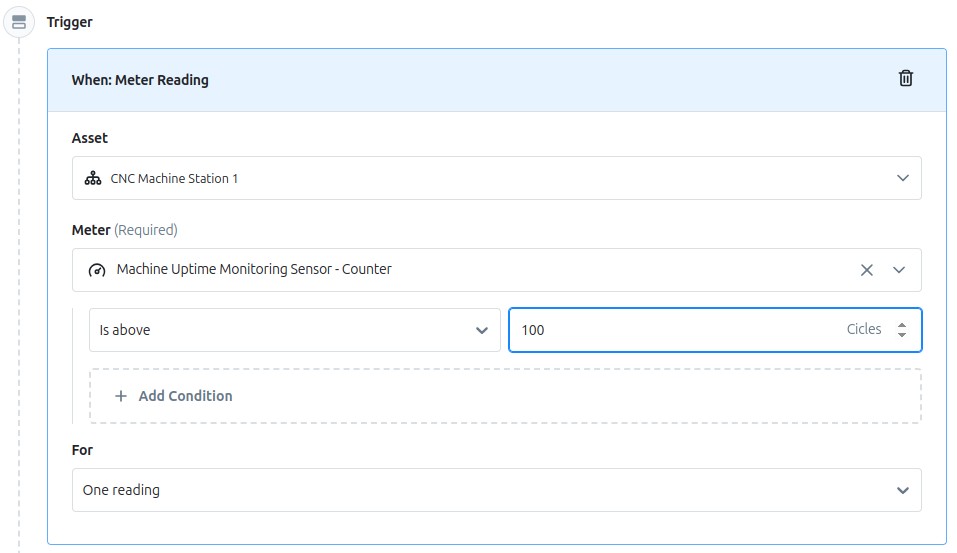
This time, we want to trigger an email notification when the counter value reaches 100. For this, we need to select the ‘is above’ condition and enter 100 cycles.
Click to Expand
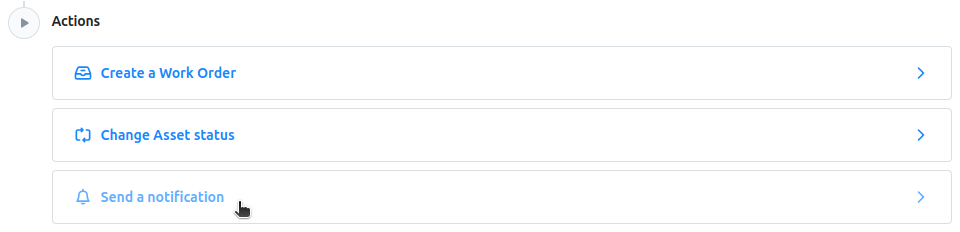
he next step is to scroll down to the Actions section, then click on the ‘Send a notification’ option
Click to Expand
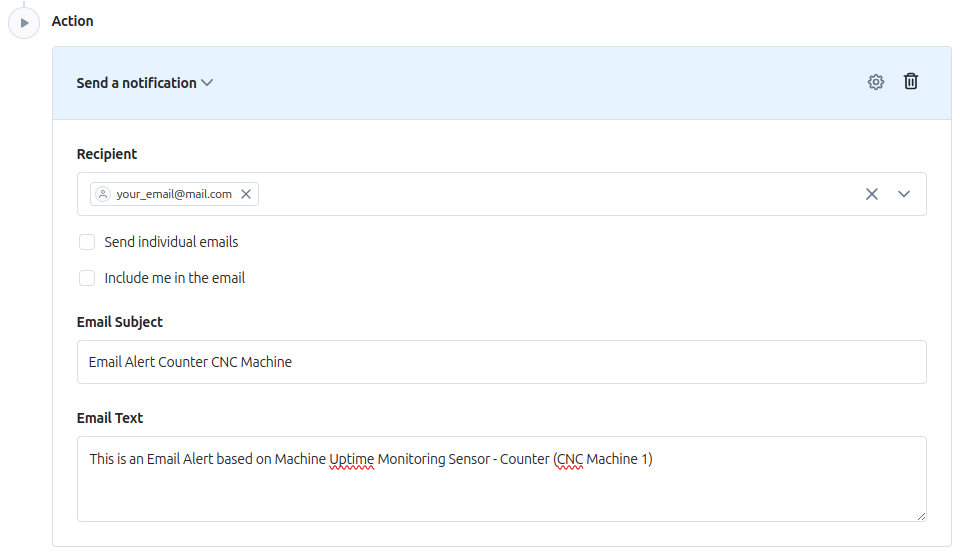
The next step is to enter the recipient’s email address, then create an email subject and write the email body text. An example of this is shown in the image on the right.
Click to Expand
Click on ‘Create’ button
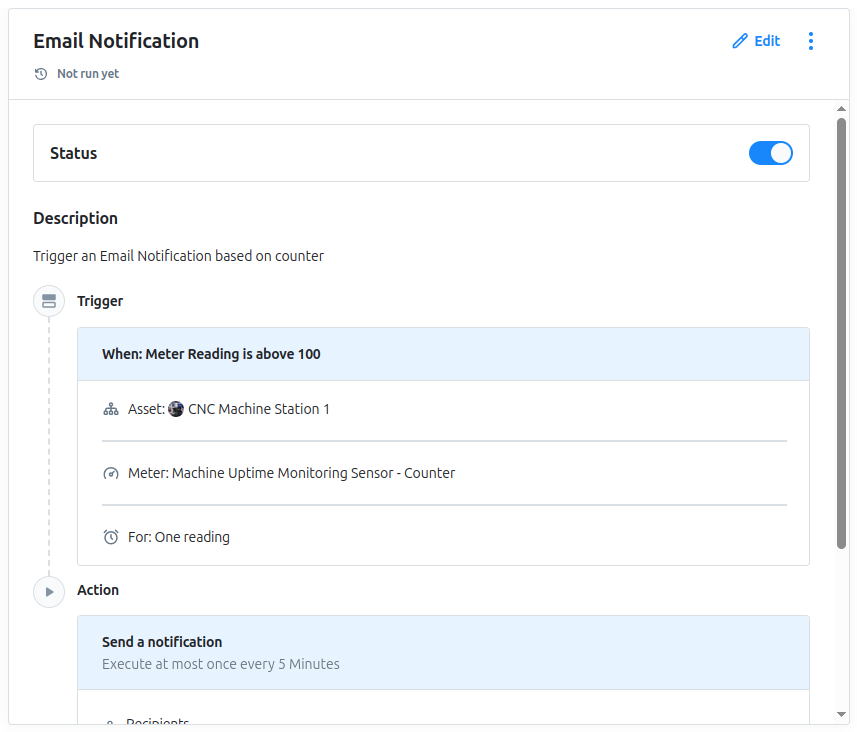
The next window will display a summary of the automation.
Click to Expand
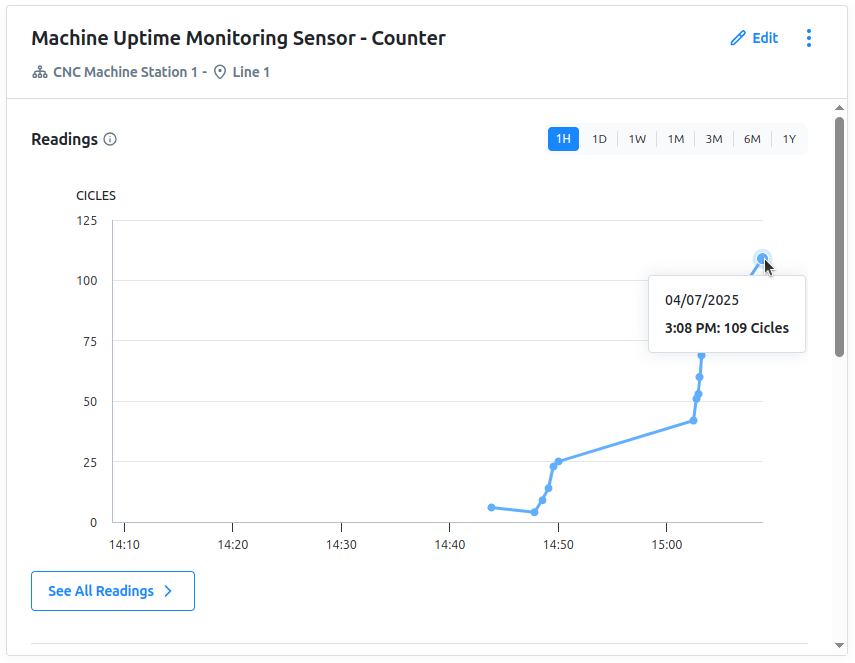
Now, we will monitor the Machine Uptime Monitoring Sensor counter value in MaintainX. As soon as the value exceeds 100 cycles, as shown in the right image.
Click to Expand
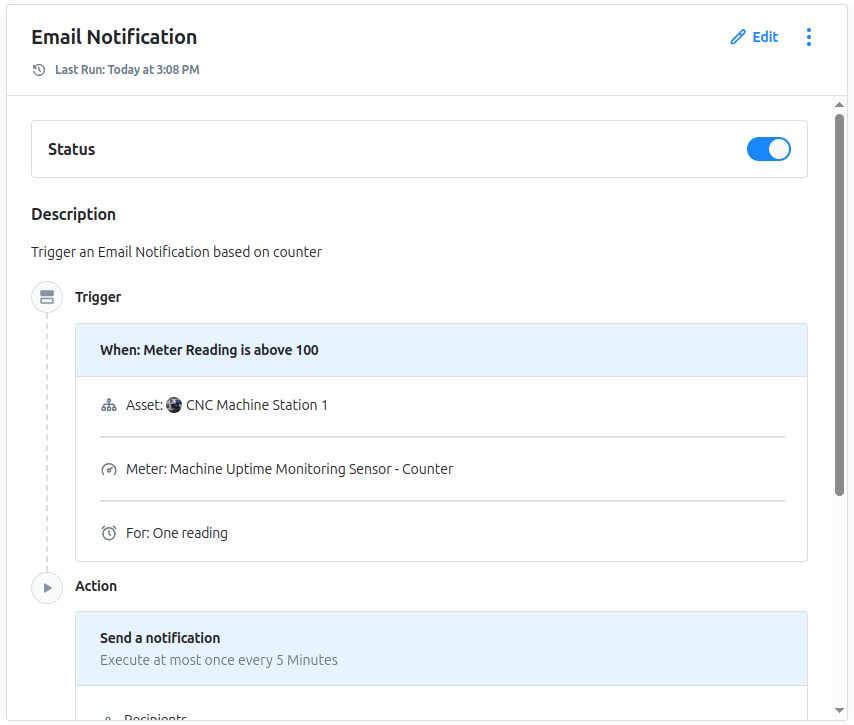
The automation will detect this value and trigger the Automation and Email Notification. You should see that the email notification runs immediately. An example of this is shown in the right image.
Click to Expand
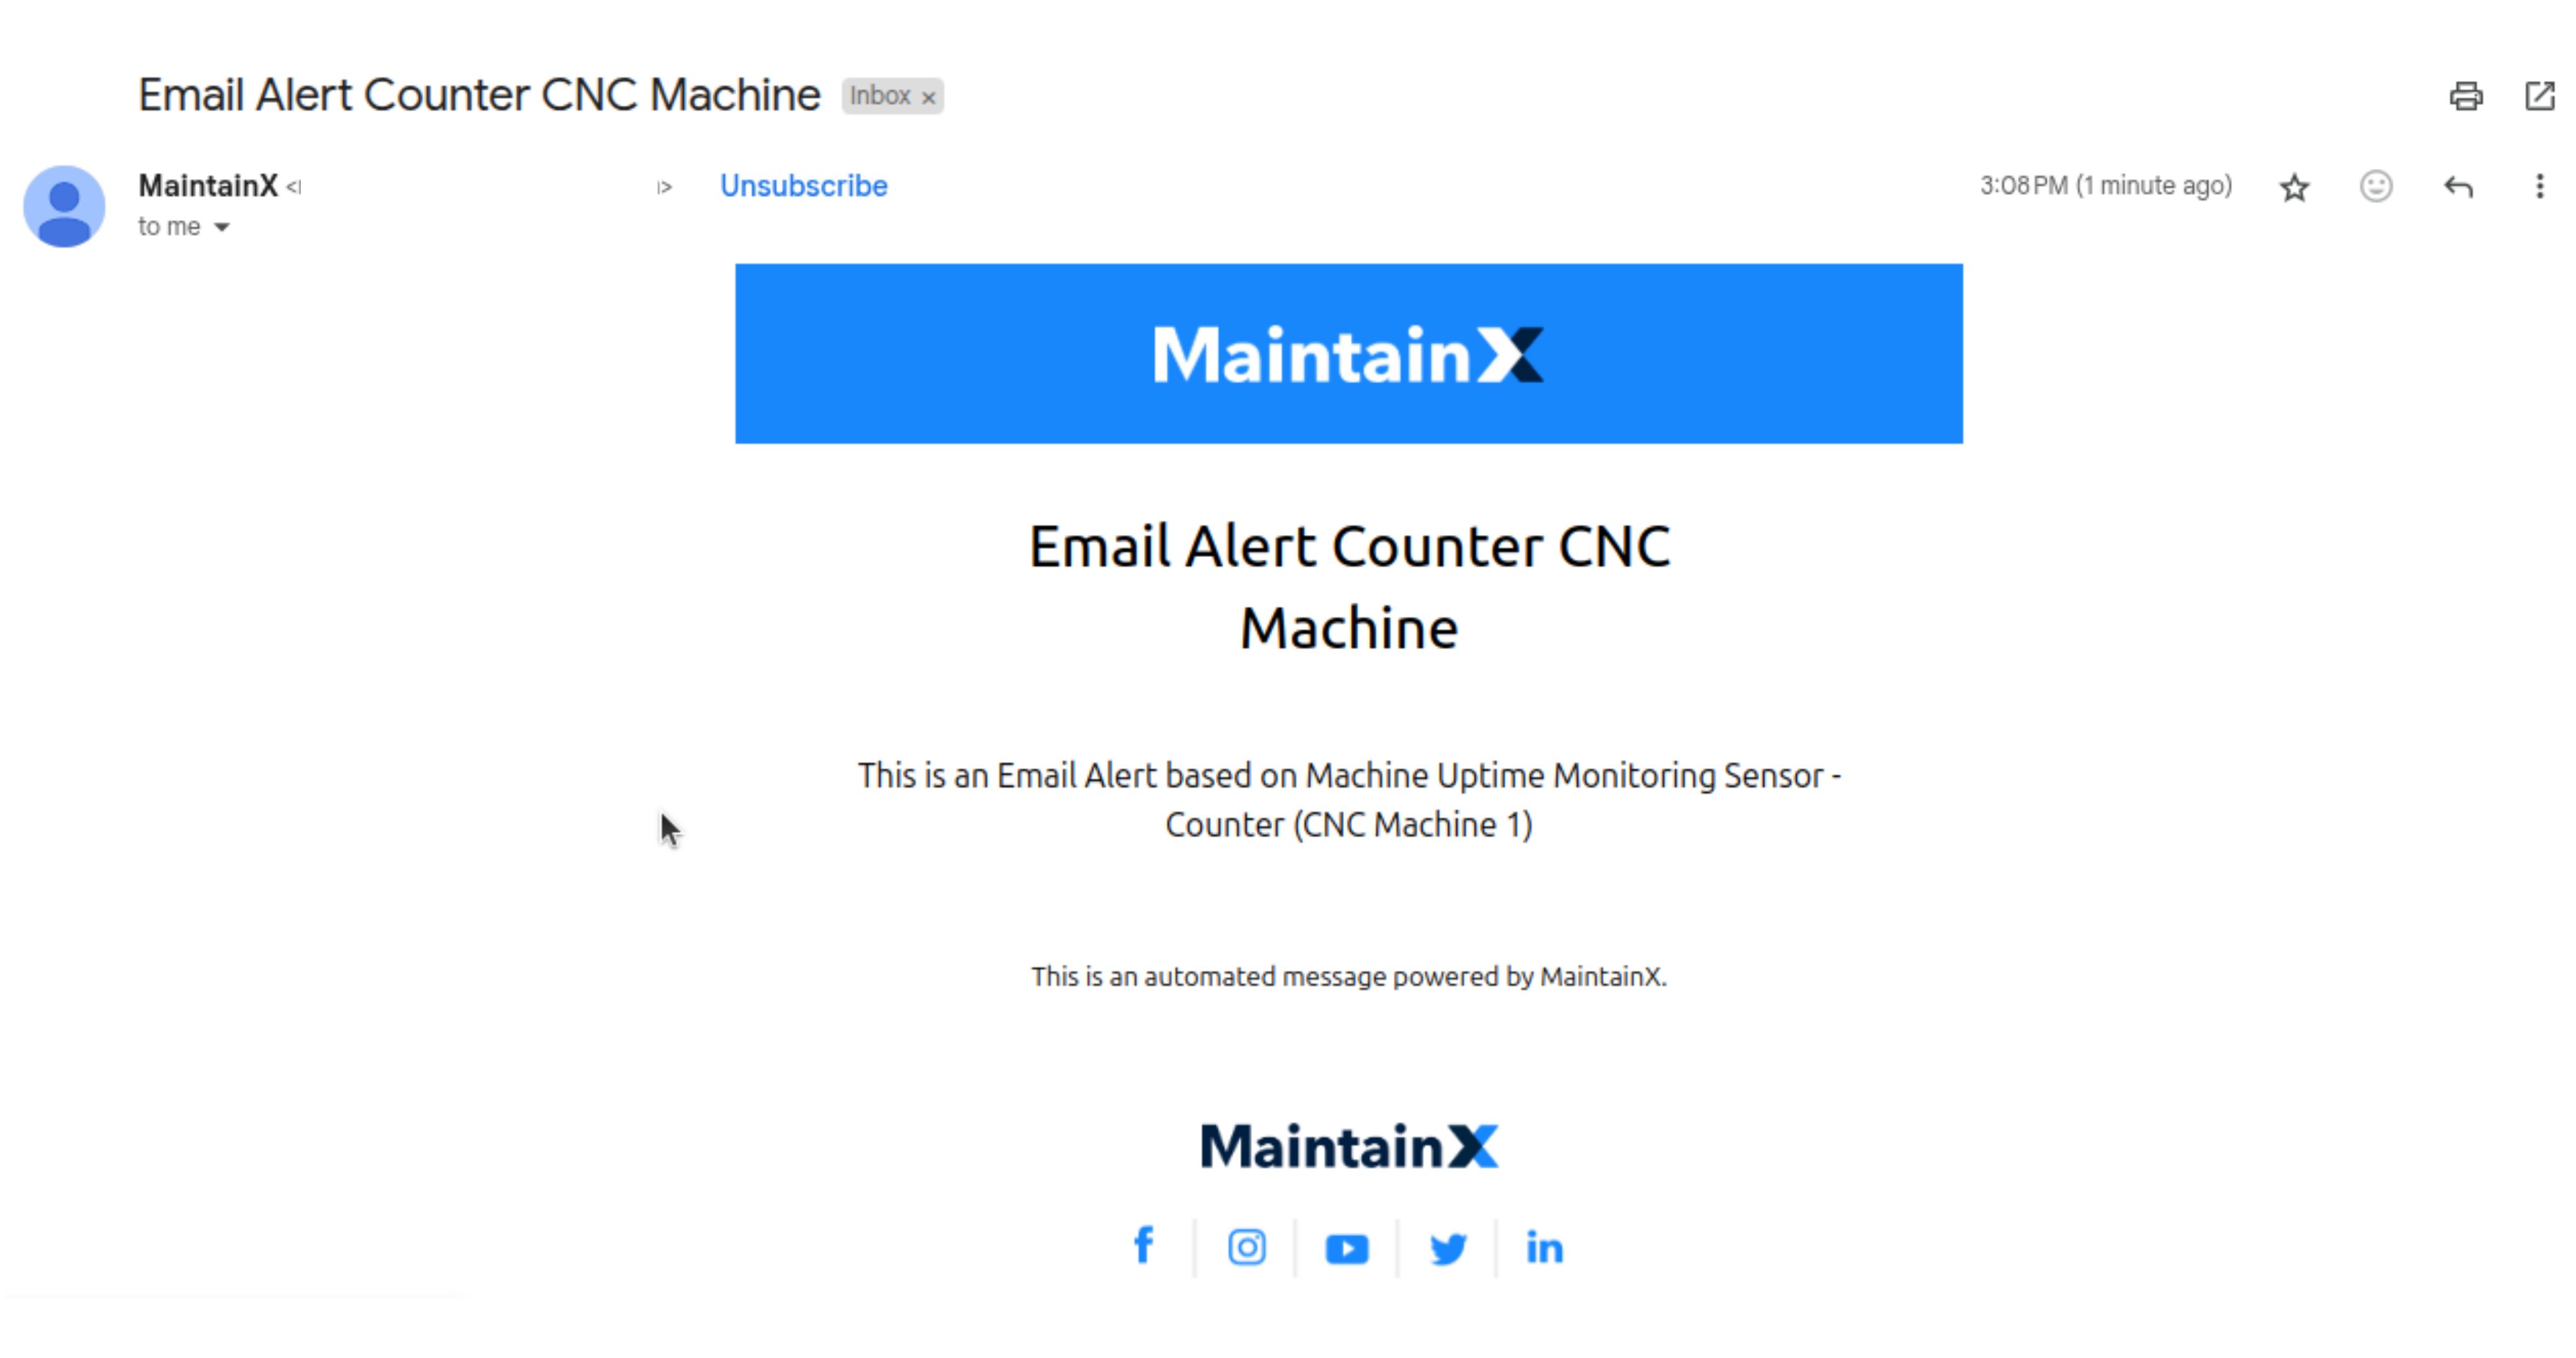
You can confirm by accessing the email account set in the automation’s email notification. You should see a new email received from MaintainX, similar to the one shown:
Click to Expand
Summary
This article guided you through the process of integrating the NCD Machine Uptime Monitoring Sensor with MaintainX using Node-RED to enhance your maintenance workflow. We started by setting up a location (Workshop Floor) and sub-location (Line 1) in MaintainX, followed by creating assets for the CNC Machine Station 1 and the Machine Uptime Monitoring Sensor itself. We then created three automated meters—counter, uptime, and battery percentage—to monitor the CNC Machine’s performance and the sensor’s battery level. Using Node-RED, we configured a flow to filter and process sensor data, send meter readings to MaintainX via the API, and create an automation to trigger a work order and email notification when the battery percentage drops below 70%. This setup provides a scalable foundation for your CMMS platform, enabling efficient monitoring and proactive maintenance of your industrial assets.