

Powering it up takes two minutes. The five minutes after that decide whether the data is worth anything in a year.
Getting a wireless sensor to talk is the easy part. You put batteries in it, it finds the gateway, and it starts sending. Nothing about that requires a decision from you.
The decisions come next, and they are small enough to skip. What is this thing called. Where is it. What machine is it on. How often should the gateway expect to hear from it. Every one of those has a Skip button next to it, and skipping all of them still leaves you with a working sensor and a chart that goes up and down.
A year later that is exactly the problem. Here is the whole sequence on a real gateway, with the five minutes that matter called out.
The click by click for every screen below is in the sensor’s user guide and the Atrium gateway guide. This is the other half: which of those clicks matter, and what it costs you when you skip them.
1. Set it up, do not just let it arrive
A gateway hears everything in radio range. On this one, 154 devices had checked in and were sitting in the pending list, waiting for somebody to decide they mattered. The monitored list was 13.
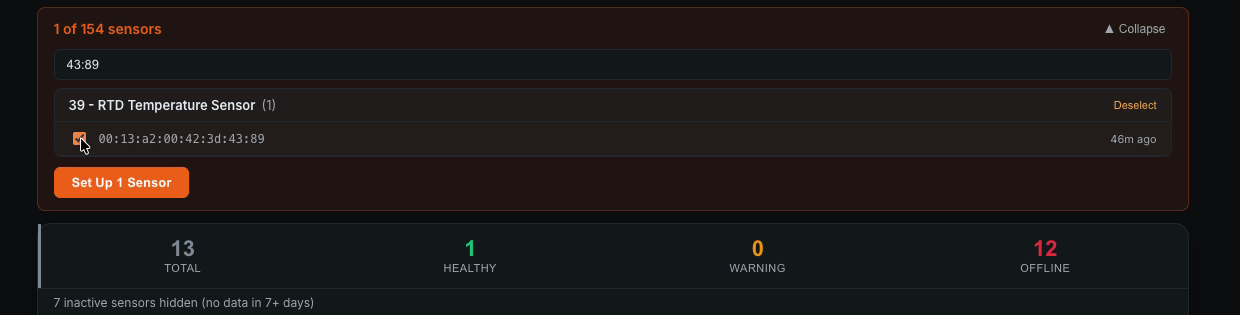
Search the pending list by the last four characters of the address printed on the sensor, tick it, and press Set Up 1 Sensor. That is the two minutes.
Mind the gap between those two numbers, though. A gateway will happily hear a sensor for months without ever monitoring it, and a device that nobody has set up is a device nobody is watching.
2. Name it the way the work is described
Setup asks four things. Only the first is required.
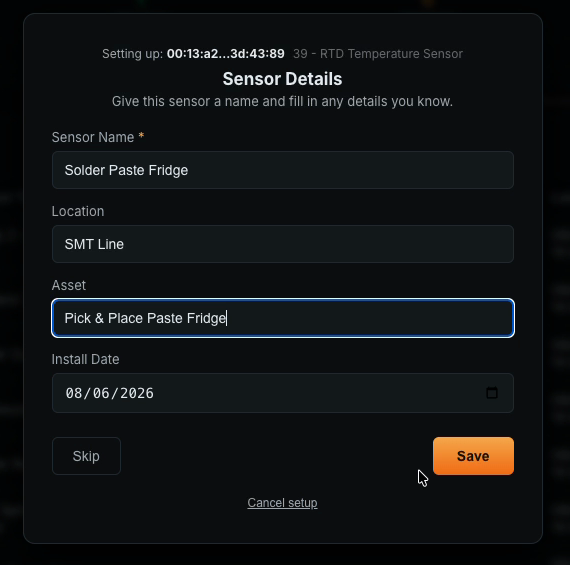
Fill in all four anyway, and fill them in the way people on the floor actually talk:
- Sensor Name is what shows on the dashboard and in every alert email. “Solder Paste Fridge” is a name somebody can act on at 2 a.m. An address is not.
- Location and Asset are not decoration. They are filters. The sensors page filters by Location and searches across device ID, location and asset, so the moment you have more than a dozen sensors, these two fields are the difference between finding the four sensors in the finishing department and scrolling.
- Install Date is your battery clock and your warranty clock. It is the only field that gets harder to fill in with every week that passes, and the dialog gently invites you to skip it: it asks for “any details you know.” Fill it in on day one and you never have to guess.
Here is what the row looks like afterwards.

That row is readable without opening anything. Leave those same four columns empty and what you have is an address, a battery percentage, and a walk across the plant to find out which machine it is bolted to.
One thing worth knowing about these four fields: none of them reach the sensor. They are labels the gateway keeps for you, digital nametags for your own fleet, and nothing here changes how the device behaves. Which also means there is no reason to be careful with them. Rename a sensor at 2 a.m. if it makes the alert clearer.
3. Tell the gateway how often to expect the sensor
This is the step that is genuinely easy to get wrong, because it looks like a setting and it is actually a promise.
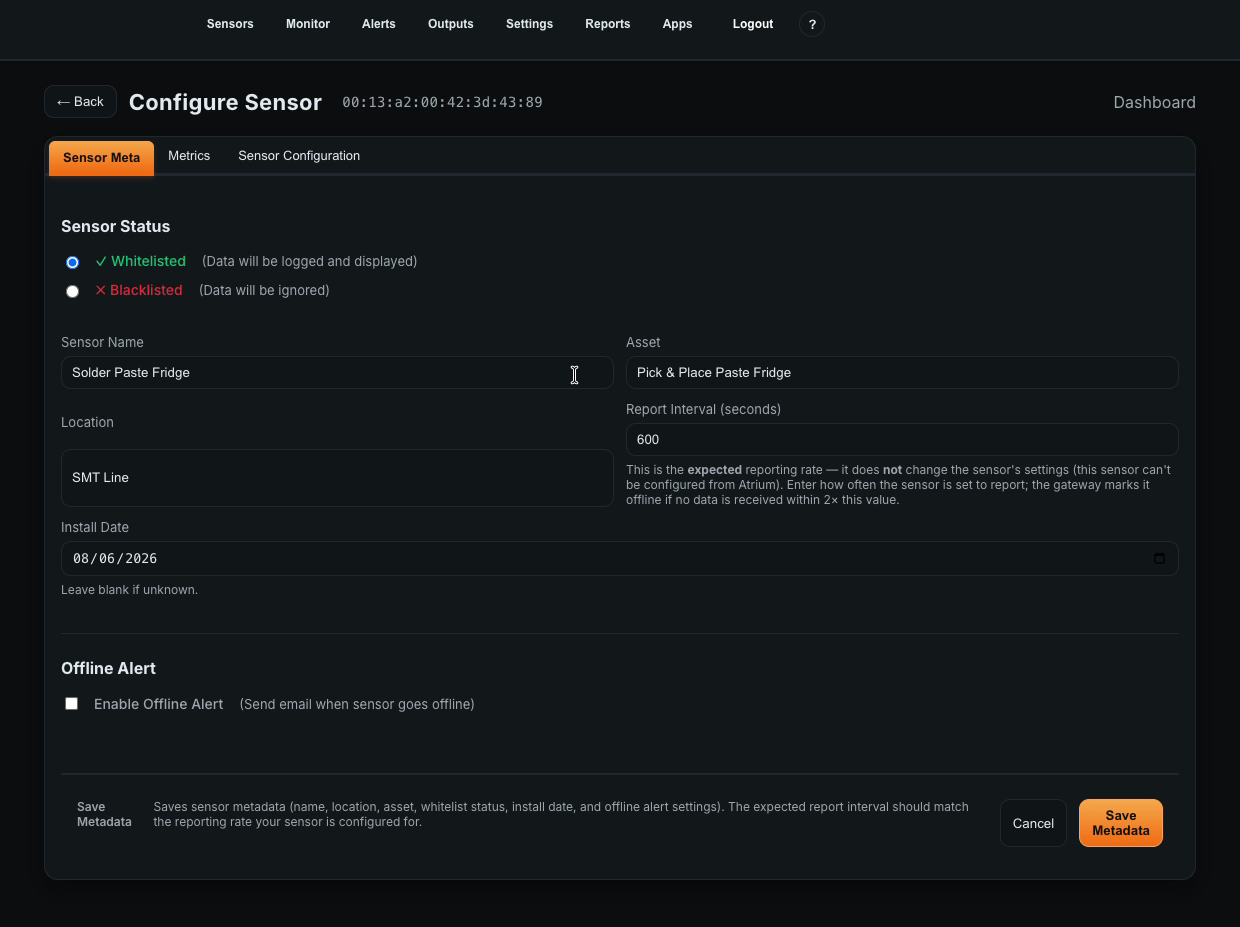
Read the help text under Report Interval carefully, because it explains the whole offline system in two lines.
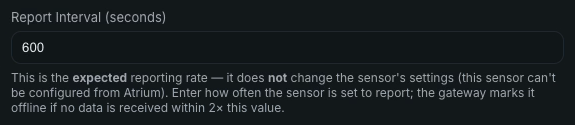
So the number you type is what the gateway expects, not what the sensor does. It is a description of the sensor, not an instruction to it, and the gateway uses it for exactly one job: watching the connection. Miss two transmissions in a row and you are marked offline. Get the number wrong in either direction and you pay for it:
- Type a number lower than reality and the gateway starts declaring a perfectly healthy sensor offline. Do that a few times and everybody learns to ignore offline notices, which is worse than having none.
- Type a number higher than reality and a sensor can sit dead for a long time before anything says so. A sensor set to report every 10 minutes but declared at 24 hours is a sensor you will not miss until somebody walks past the machine.
Where do you find what it is actually set to? That number lives on the other tab, as Delay, in the hardware settings coming up in the next step. The fields there sit empty until you tick Show current values, which is how you read back what the sensor is running now. The two have to agree. Delay is what the sensor does, Report Interval is what the gateway expects, and if you ever change the first without changing the second, you have built yourself a false offline alarm.
Set it to match how the sensor is actually configured, then tick Enable Offline Alert so silence sends an email. Silence is the one condition a threshold alarm can never catch, because a sensor that has stopped transmitting never crosses anything.
While you are on this tab: Whitelisted means the data gets logged and displayed, Blacklisted means it gets ignored. That is your tool for a sensor on the bench that you do not want polluting a real asset’s history.
4. The settings that ride the next sync
Some hardware settings can be sent from the browser rather than from a bench. On this RTD sensor that includes the two that determine whether the reading is even correct: how the probe is wired, and which probe it is.
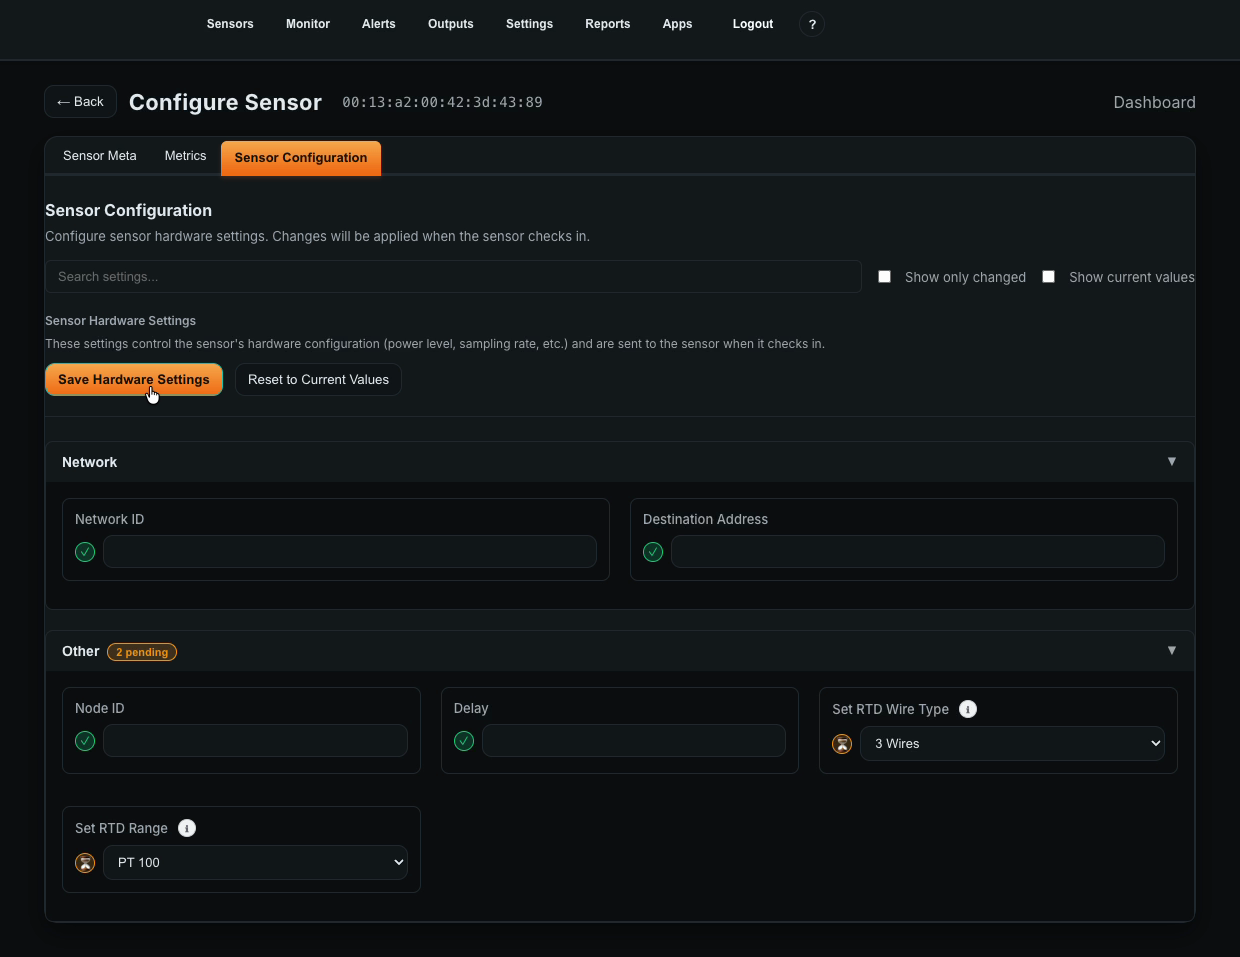
Unlike the labels in step 2, these are real instructions for the sensor. The 2 pending badge tells you the change is queued, not applied, and the note at the top of the panel says changes are applied when the sensor checks in.
If you read the fine print back in step 3 closely, there is an aside in the Report Interval help text saying this sensor cannot be configured from Atrium. That is about the report interval and nothing else. It is telling you that typing a number into that box does not reach the sensor. The hardware settings on this tab are a different mechanism, and they do.
That phrase is worth being precise about, because checking in is not the same as reporting. A battery powered sensor sends two different kinds of message, and only one of them can carry settings back the other way:
- Data reports are the readings. On this sensor they arrive every 10 minutes, and they are a one way trip. The sensor transmits and goes back to sleep.
- A configuration sync is a separate, short window where the sensor is actually listening. It is the only moment the gateway can hand it anything.
The newer sensors open that window on their own, once an hour. So a setting you save at 9:02 does not land at 9:12 with the next reading. It lands at the next sync, up to an hour later, and then the pending badge clears. Nothing failed in the meantime. Do not save it four more times.
That is the honest limit of configuring a battery powered sensor over the air, and it is worth saying out loud: the sensor is asleep almost all the time, which is how it runs for years on a battery. It cannot receive anything while it is asleep.
If you happen to be standing next to it, you do not have to wait for the hour. Press and release the reset button and the sensor goes into configuration mode immediately, and the queued settings land right then. Worth knowing before you drive back out to a machine to check whether something took.
Not every sensor does that hourly sync on its own yet, so it is worth checking before you plan a fleet wide change. Checking takes a second, because Atrium prints the type number in front of the sensor type: the sensor in these screenshots reads 39 – RTD Temperature Sensor, so it is type 39, and it is on the list.
The sensor types that sync on their own (57 types, August 2026)
| Type | Sensor |
|---|---|
| 1 | Temperature/Humidity |
| 4 | Thermocouple |
| 12 | 3 Channel Thermocouple |
| 15 | 1 Channel 0-10V Receiver |
| 20 | High Precision Pressure Sensor |
| 21 | Differential Bidirectional Pressure Sensor |
| 23 | 2 Channel Thermocouple Sensor |
| 24 | Activity Detection |
| 26 | Pressure Sensor |
| 33 | AC Current Detect Sensor |
| 39 | 3 Wire RTD Temperature Sensor |
| 45 | 4-20mA 16-Bit Input Transmitter |
| 47 | Wireless Tilt Sensor |
| 48 | 4-20mA 16-Bit Input Transmitter |
| 51 | 6 Channel Current Sensor |
| 52 | 2 Channel 4-20mA Receiver |
| 54 | 2-Channel RTD Temperature Sensor |
| 55 | 3-Channel RTD Temperature Sensor |
| 56 | 2 Channel 0-10VDC Receiver |
| 60 | Air Velocity, Pressure, & Temperature Sensor |
| 75 | Siemens Air Velocity Probe |
| 86 | 3-Phase Current Monitor Sensor Gen4 |
| 87 | Gen 4 One Channel Wireless Current Sensor |
| 88 | 1 Channel Ultrasound Vibration Sensor |
| 89 | 2 Channel Ultrasound Vibration Sensor |
| 90 | DC Current Sensor |
| 93 | Oil Temperature and Moisture Sensor |
| 95 | 16-Bit 1-Channel 0-24VDC Receiver |
| 96 | 16-Bit 1-Channel 0-48VDC Receiver |
| 103 | Custom Wireless Accelerometer Sensor |
| 105 | 1 Channel Automatic Luber With Ultrasound Vibration Sensor |
| 106 | 2 Channel Automatic Luber With Ultrasound Vibration Sensor |
| 107 | 4 Channel 4-20mA Receiver |
| 108 | Machine Uptime Monitoring Sensor |
| 110 | One Channel Vibration Plus v4 |
| 111 | Two Channel Vibration Plus v4 |
| 112 | Condition Based/Predictive Maintenance Sensor v4 |
| 114 | Standalone Smart Vibration Sensor v4 |
| 115 | One Channel Ultrasound Sensor Gen4 |
| 118 | Dual Pressure and Temperature Sensor |
| 119 | Machine Runtime Hour Meter |
| 122 | Wireless 4-20mA Current Splitter |
| 123 | 3 Channel Production Counter |
| 125 | 2 Channel OEE AC Current Production Monitor Sensor |
| 126 | 3 Channel OEE AC Current Production Monitor Sensor |
| 127 | Wireless Vibration, Ultrasound and Temperature Sensor |
| 128 | Wireless Water Detect Sensor |
| 129 | Two Channel Wireless Water Detect Sensor |
| 130 | Wireless Inclinometer Sensor |
| 518 | Custom Air Velocity |
| 536 | Wireless Oxygen Flow Meter |
| 539 | RS485 Modbus Wireless Converter |
| 540 | Wireless Ultrasonic Flow Meter FD-Q32C |
| 541 | Custom Inline Flow Sensor |
| 545 | Fox Thermal Flow Sensor |
| 547 | Wireless Hydrogen Enviorment Sensor |
| 554 | Custom 400-50,000 PPM CO2 Sensor |
That list is a snapshot, and it keeps growing. The direction is for every sensor to sync on its own, and types get added as firmware ships, so a sensor missing from it today is usually a matter of time rather than a limitation to design around. In the meantime nothing is lost. The same settings still apply to it, somebody just has to put the sensor into configuration mode by hand at the device, using the button sequence in its user guide.
And get the wire type right before you walk away. A three wire probe told to behave like a two wire probe reads, and keeps reading, and is wrong the entire time. There is no alarm for a plausible number.
5. Do not judge it by the first hour
Open the dashboard and the sensor tells you who it is: name, location, asset, firmware, and when it was last heard from.
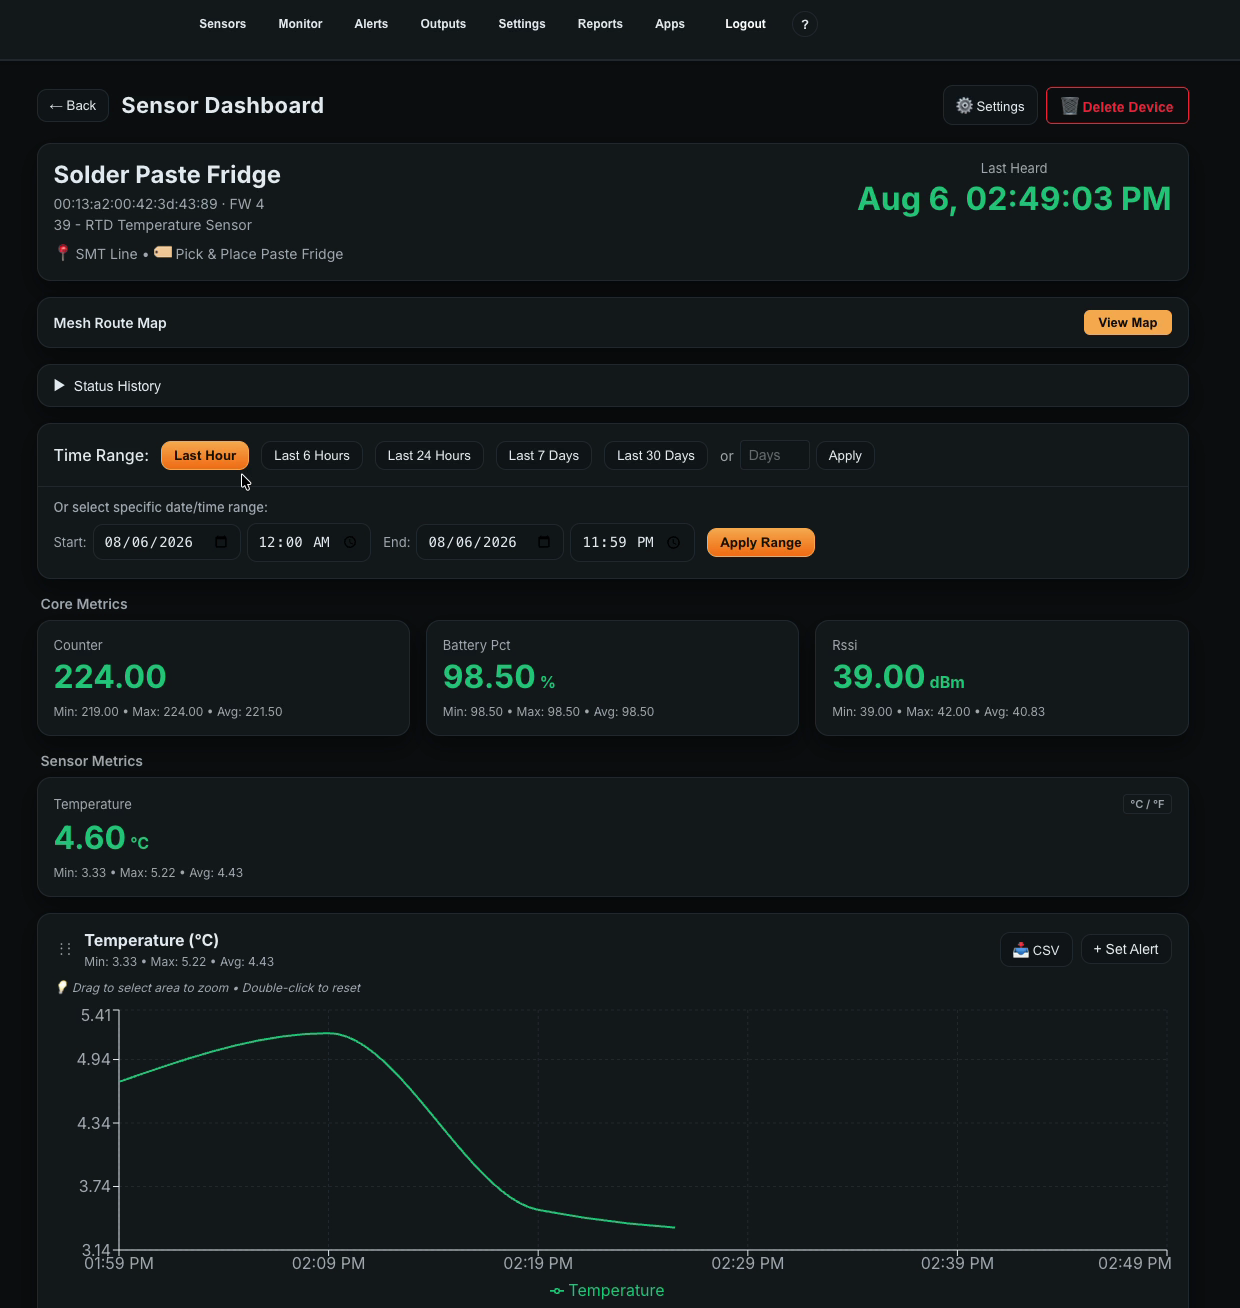
An hour of a 10 minute sensor is six readings. The chart draws a confident curve through them and it means almost nothing. You can see the reporting rate in the Counter tile if you look. That counter is the sensor’s own, it climbs by one with every transmission and rolls over at 255, and across that hour it went from 219 to 224. Six readings, five ten minute gaps between them, which is the 600 seconds you typed in step 3 doing exactly what it said it would. Those are data reports, incidentally, not the hourly configuration sync from step 4. Different message, different job.
That is all the first hour is good for. Confirming it is alive, that the battery and signal are sane, and that the reporting rate matches what you told the gateway to expect.
6. A month later, the naming pays for itself
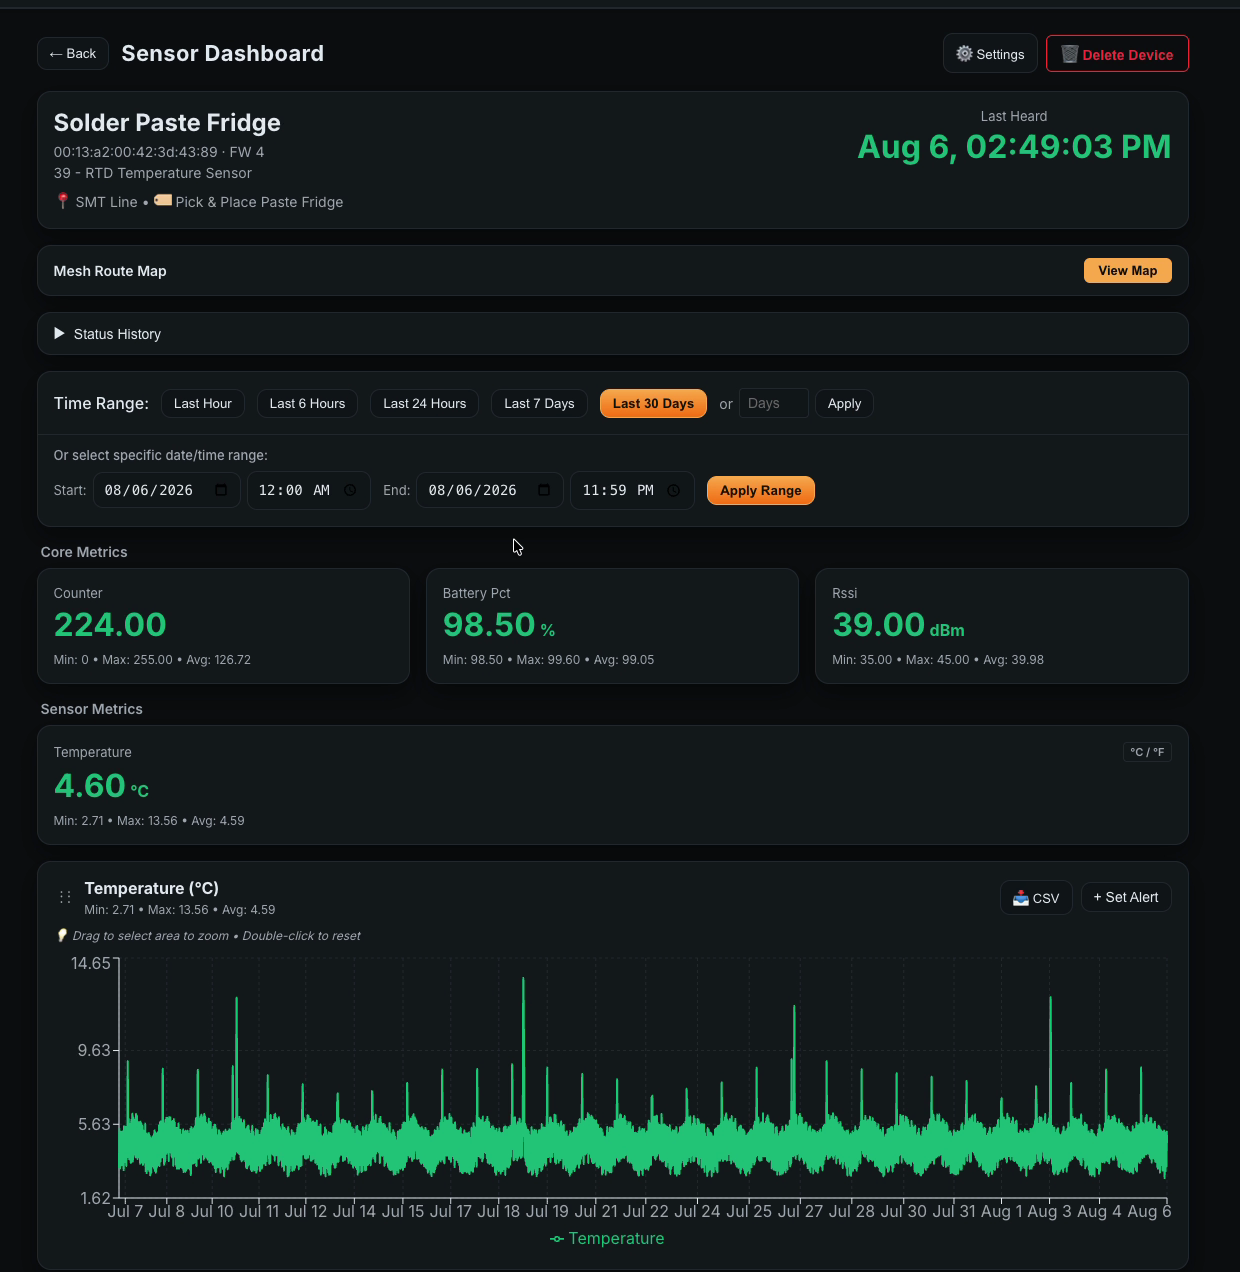
Same sensor, same fridge, one month. It sits at 4.59 C on average and cycles inside a band about two degrees wide, which is a thermostat and a compressor doing their jobs. Then there are the spikes, up to 13.56 C.
The obvious reading is the door. Somebody comes for solder paste, warm room air reaches the probe, the box pulls itself back down. That is what we assumed, until we counted them.
There are 29 spikes in 30 days. The gap between them is 24 hours. They land at the same time each night, within about a quarter of an hour, and they are all close to the same height, a little over 8 C. They happen on Saturdays and Sundays exactly like they happen on Tuesdays.
Nobody opens a door that punctually. A person fetching paste turns up on weekdays, at scattered times, for varying lengths of time. What that regularity means is a timer, not a person, and on a refrigerator the timer that warms things up on purpose is almost always the defrost cycle. Either way it is the fridge’s own housekeeping, and it had been running every night of the month while nothing at all was wrong.
That is the argument for a month of history instead of an afternoon of it, in one picture. And it is why you do not set thresholds on day one. Look back at that first hour: the entire world was between 3.33 and 5.22 degrees. A threshold picked from it fires on every one of those nightly cycles, and an alarm that goes off every night gets muted inside a week.
So what deserves an alarm here is not the spike. Look for the ones that do not fit the routine. This month had four: 12.10 to 13.56 C, each one hotter than the nightly cycle and lasting longer, between roughly an hour and a half and four hours, and not one of them at the nightly hour. Every one fell outside working hours, and three of the four on a weekend. Those are the shape worth an alert, because that is what a door left open, a seal that stops sealing, or a compressor that quit while everybody was at lunch all look like: a spike that goes higher than the routine and does not come back down on schedule.
Thirty days is what lets you describe that condition instead of guessing at it. Set the threshold above the routine with + Set Alert, and use CSV on the same chart if you would rather work the numbers out in a spreadsheet.
The five minutes, as a checklist
- Set the sensor up out of the pending list instead of leaving it there.
- Name it what the floor calls it. Fill in location and asset so filtering works later.
- Put the install date in now, while you know it.
- Set the report interval to what the sensor actually does, and turn on the offline alert.
- Fix the hardware settings that decide whether the reading is correct, and expect them to land at the next hourly sync. Press and release the reset button if you are standing there and want them now.
- Come back in a month before you set your thresholds.
None of it is hard. All of it is the kind of thing that gets skipped on a Friday afternoon, and it is the difference between 40 sensors you can read at a glance and 40 rows of dashes.