Managing vibration data from multiple sensors can often present significant challenges, from organizing diverse data streams to ensuring local storage and effective visualization. To address these complexities, we are excited to introduce a powerful Node-RED subflow Dashboard specifically designed for the Generation 4 Vibration Sensors.
This comprehensive dashboard provides a centralized solution for efficient vibration monitoring. It allows users to seamlessly manage data from multiple Gen4 Vibration Sensors within a single interface, overcoming the limitations of monitoring individual sensors. Beyond simple data display, the dashboard automatically saves all incoming sensor data into organized CSV files, ensuring a robust record for historical analysis and compliance. Furthermore, it offers integrated plotting capabilities to visualize sensor data in interactive charts, providing immediate insights into machine health. Primarily designed to work with the Enterprise IIoT Gateway, this dashboard empowers users to easily download the generated CSV files directly to their local PC when connected to the same network, facilitating deeper offline analysis and reporting. This subflow streamlines the entire data management process, making advanced vibration monitoring more accessible and actionable for all users.
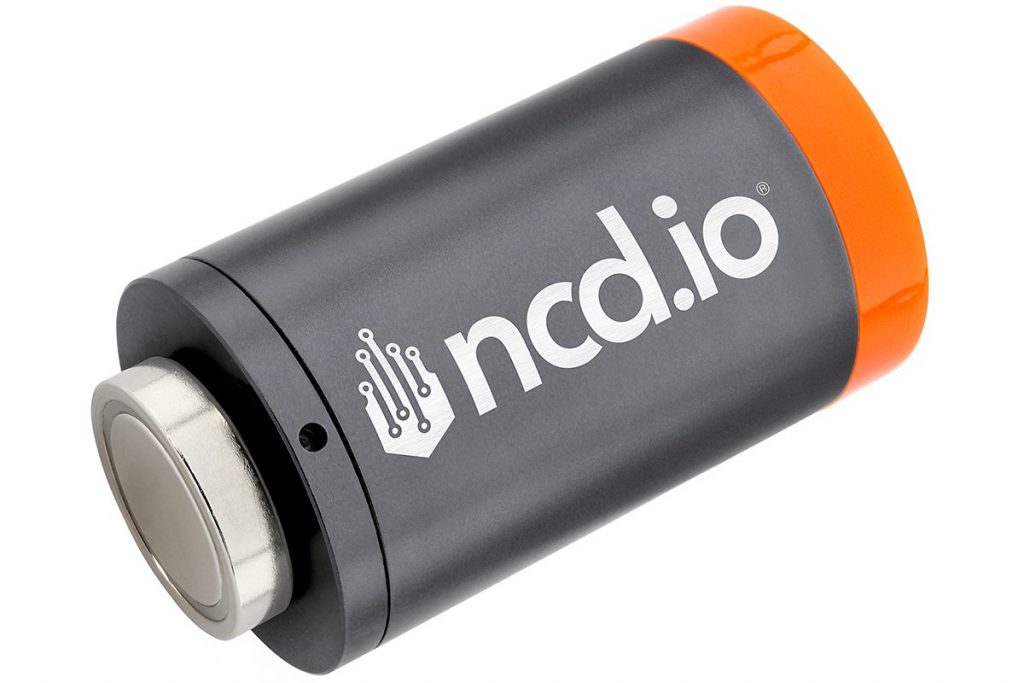
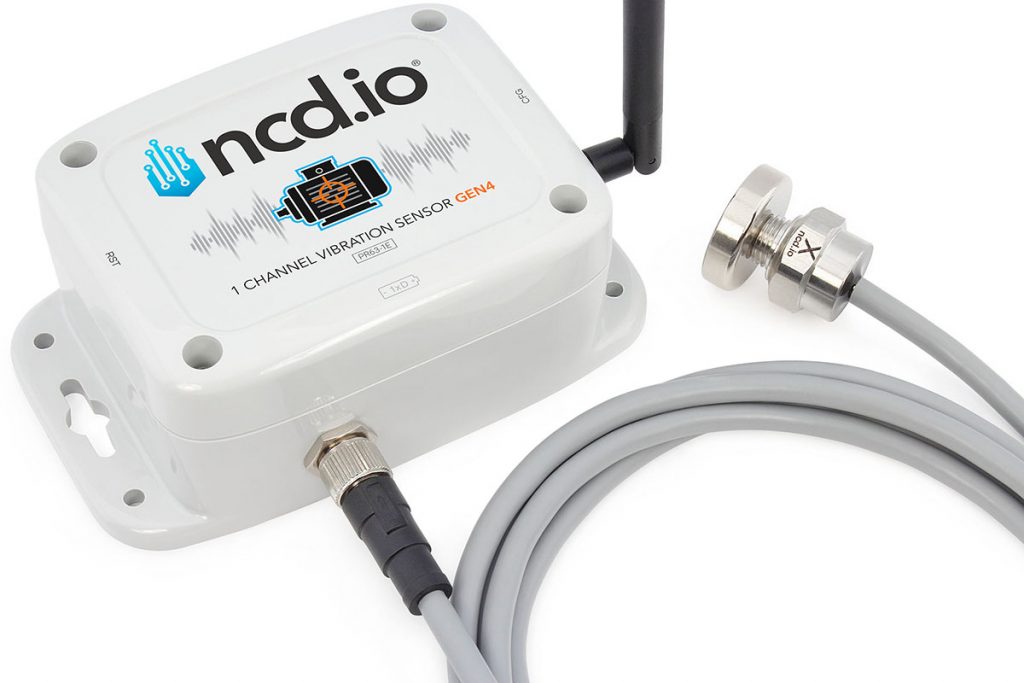
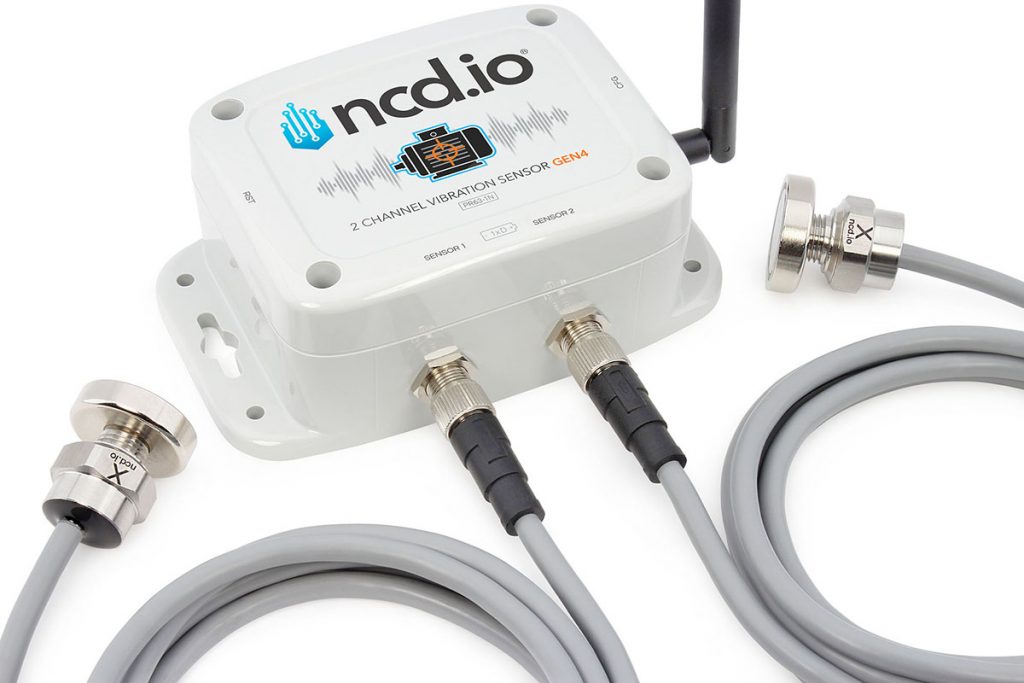
Vibration Sensor Gen 4
The Gen4 Wireless Vibration & Temperature Sensor is a cutting-edge solution designed for full-spectrum machine health monitoring in the toughest industrial environments. By fusing triaxial MEMS accelerometers with a precision surface temperature element this sensor captures a holistic signature of your machine’s condition.
Click to explore the sensor
Click to explore the sensor
Click to explore the sensor
Overview
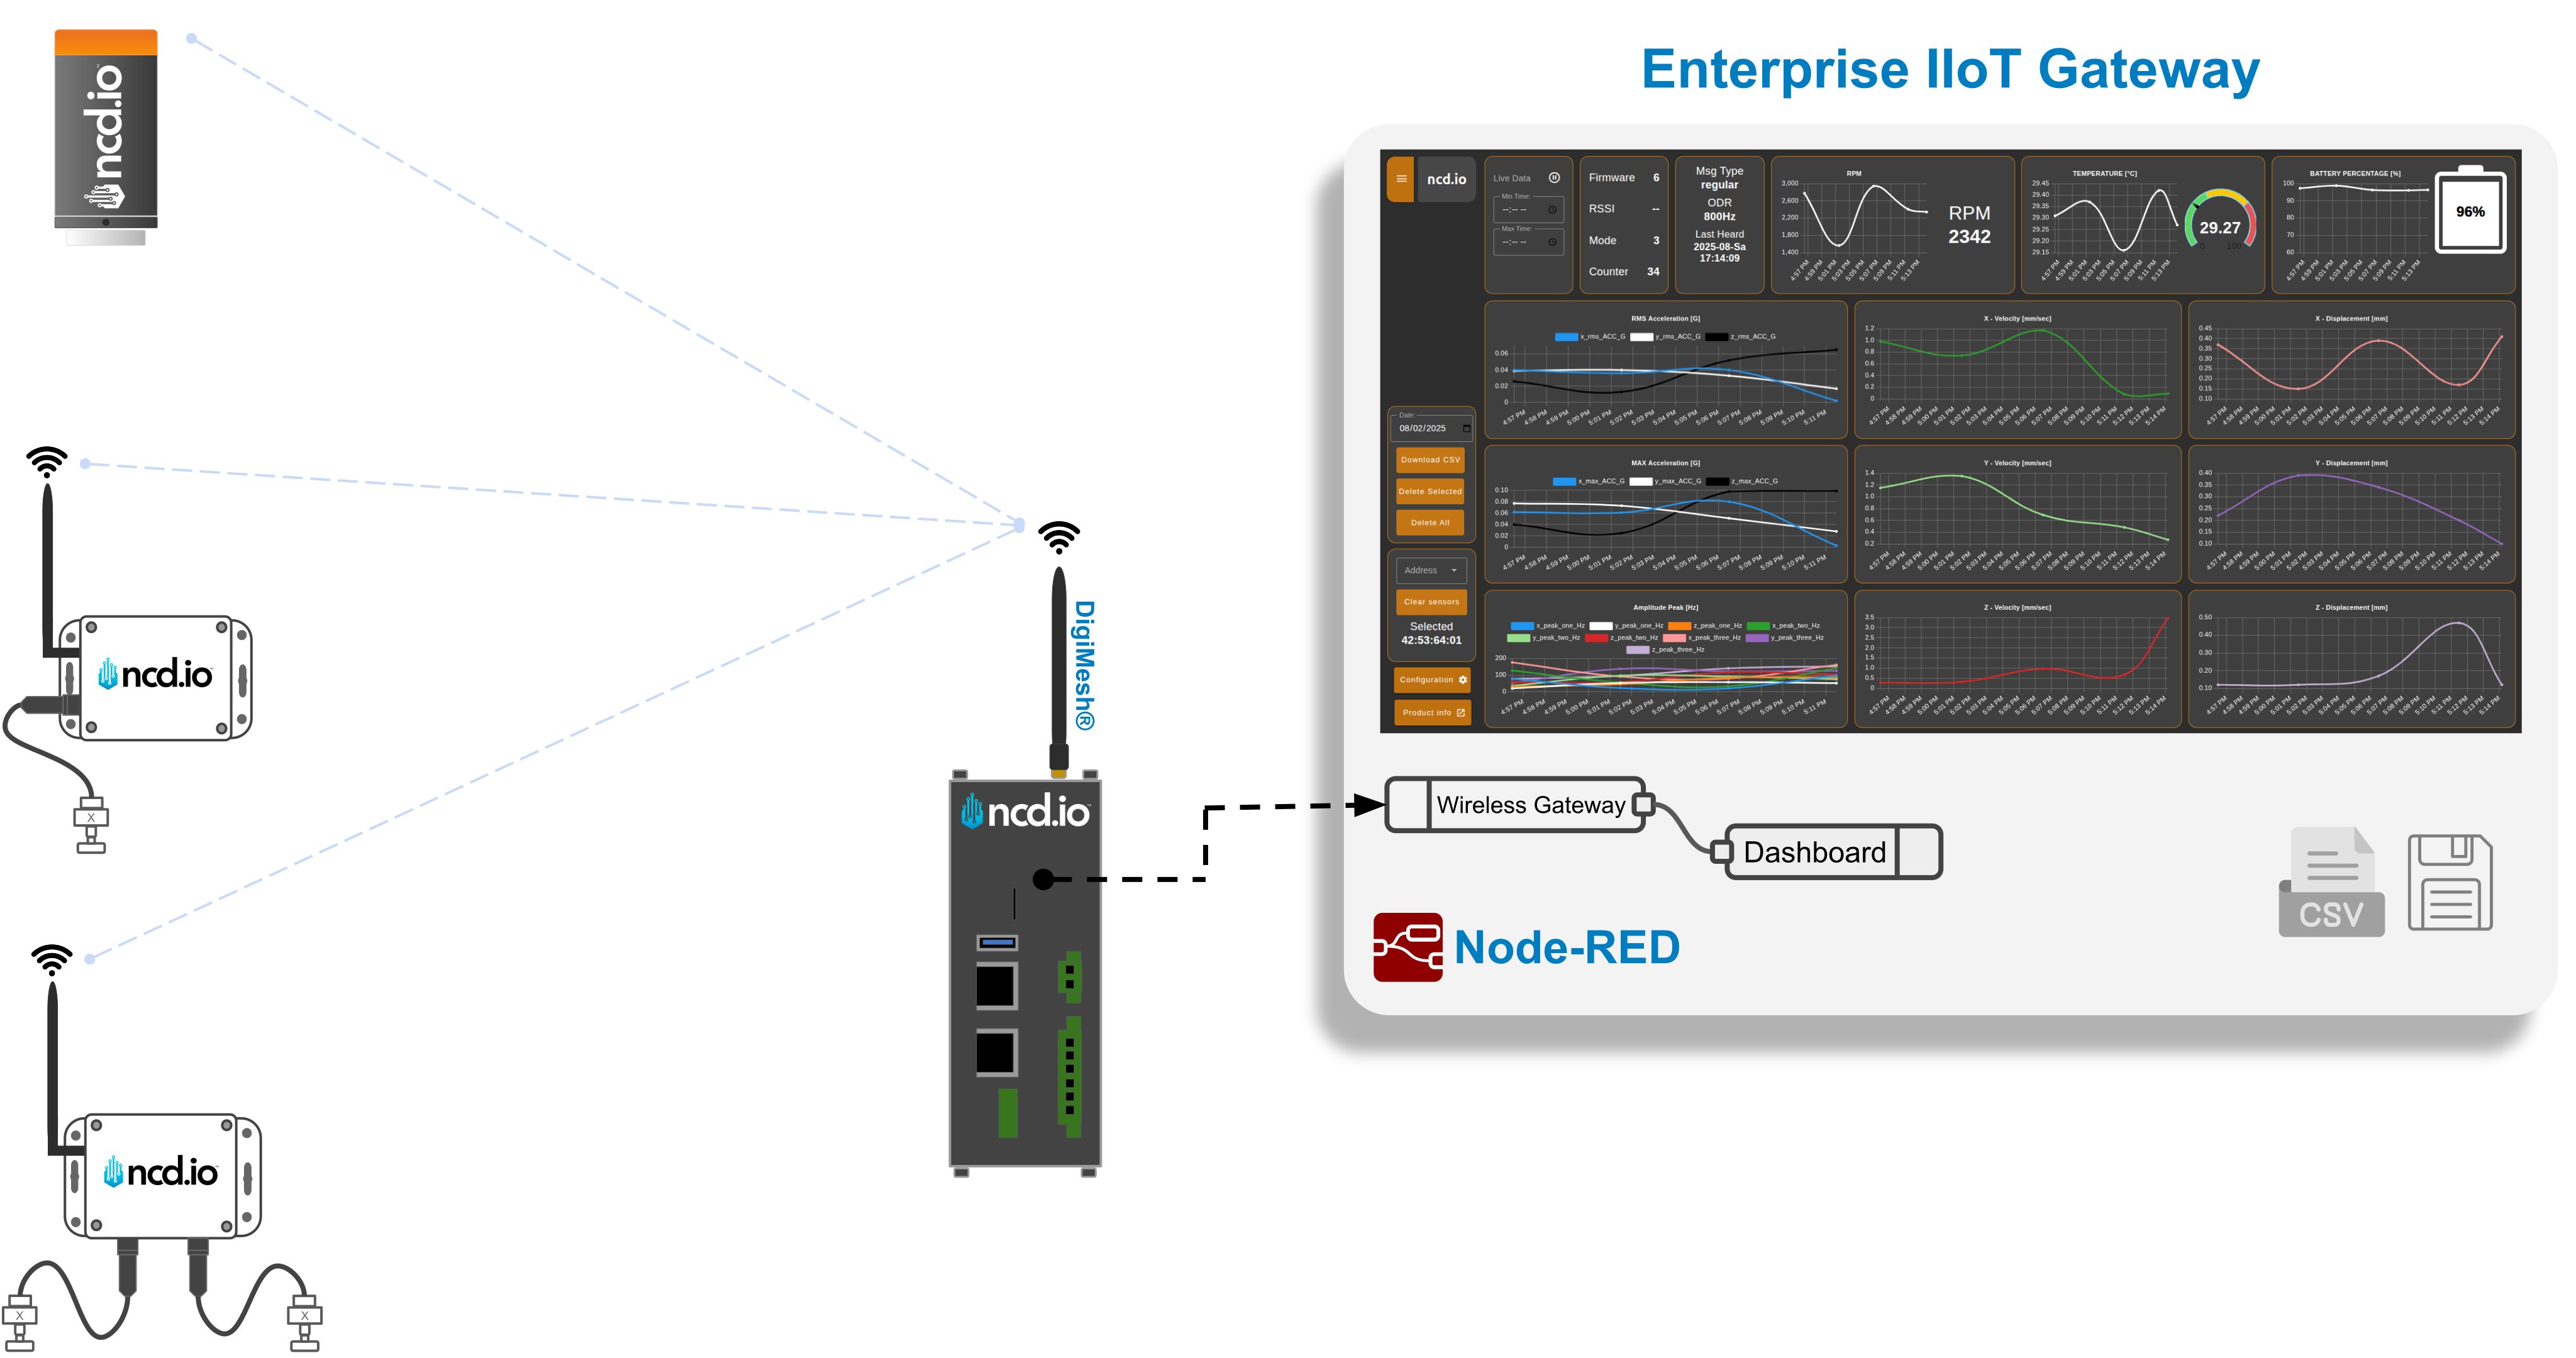
The following image provides a visual representation of the NCD Dashboard, showcasing its integration with the Generation 4 Smart Vibration Sensors. These advanced sensors are deployed in the field to collect critical vibration and temperature data directly from your assets. The collected data is then transmitted wirelessly via Digi-Mesh technology to either the Enterprise IIoT Gateway or an Industrial IoT Wireless Modem. Upon receipt, this data is efficiently processed within Node-RED, utilizing our dedicated NCD Library, before being sent to the NCD-Dashboard for secure storage and intuitive Real-Time visualization. This seamless flow enables comprehensive condition monitoring and allows for proactive insights into your machinery’s health.
NoteIf you are using the Industrial Wireless to USB Modem or the Industrial IoT Wireless to Ethernet Modem, you should install Node-RED and the NCD Library on your own PC/Gateway.
Highlights
Real-Time Data: Real-time display of the variables emitted by the sensor.
Historical Data: Historical data visualization of the values of the variables emitted by the sensor.
Local Datalogger: Generation and storage in local (or user-defined) path of CSV file with data from the sensor(s).
NoteThe data itself must be stored locally on the Gateway or machine running the Node-RED.
Dynamic Sensor Selection via MAC Address.
Dynamic Data Loading: This feature allows your NCD Dashboard to automatically update the displayed information based on user selection.
Sensor Selection via MAC Address: Users can choose the sensor they want to see data from using a dropdown menu that lists sensors by their unique MAC address.
Automatic Data Update: Once a sensor is selected, the NCD Dashboard automatically retrieves and displays the relevant data for that specific sensor.
On-Demand Download
Convenient Data Export: Download sensor data as CSV files directly from your web browser.
Local File Access Not Required: Download the CSV file to any device within your local network, regardless of where the dashboard is hosted.
Delete Local CSV Files: The dashboard includes a feature to manage local CSV files. This option allows you to either delete a selected local CSV file or clear all CSV files logged on the Enterprise IIoT Gateway. This helps prevent the Gateway’s memory from becoming full.
Explore actual sensor configuration: This option allows you to save and display the current sensor configurations using the FLY reported_config message.
Live and Stand-by Modes The dashboard features distinct Live and Stand-by modes to control data visualization.
Stand-by Mode: This mode allows you to pause the real-time data acquisition and select a specific time range of historical sensor data to display on the charts.
Live Mode: In Live Mode, the dashboard continuously displays real-time sensor data, showing the latest 20 sensor data values directly on the charts as they arrive.
ImportantThis Dashboard can display the Processed sensor data, it can not display the Time-Domain Data.
Requirements
To successfully follow and implement the steps outlined in this guide, you will need the following components and software:
Hardware:
An Industrial IoT Wireless Vibration Gen 4 Sensor.
A computer equipped with Wi-Fi or Ethernet connectivity to connect to the Enterprise IIoT Gateway and access Node-RED.
Software:
Node-RED: (Pre-installed on the Enterprise IIoT Gateway)
NCD Library: (Pre-installed on the Enterprise IIoT Gateway)
FlowFuse Dashboard 2: This must be installed as per the instructions provided in its documentation.
FlowFuse Dashboard 2
FlowFuse Dashboard 2.0 is an easy to use collection of nodes for Node-RED that allows you to create data-driven Dashboards & data visualizations. Installation procedure is similar to the previous one, FlowFuse’s Node-RED Dashboard 2.0 is also available in the Node-RED Palette Manager.
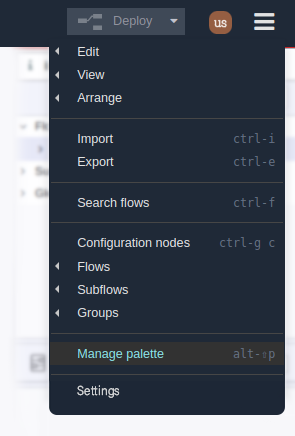
Step 1.- Open the menu in the top-right of Node-RED, then Click “Manage Palette”:
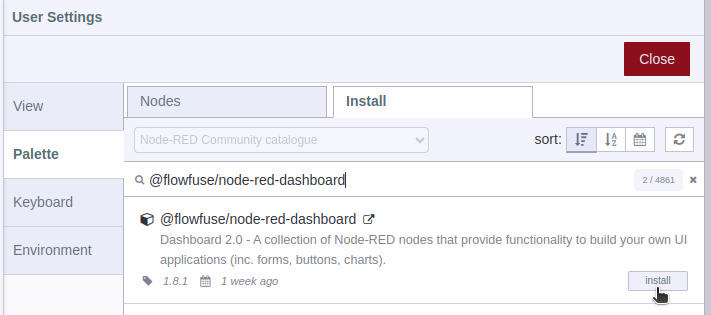
Step 2.- Switch to the “Install” tab, Search “@flowfuse/node-red-dashboard”, Install the package:
Click to Expand
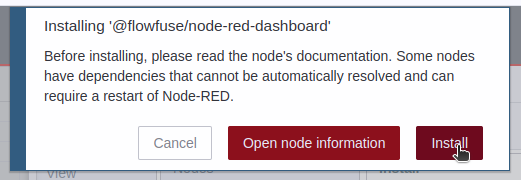
Step 3.- You must confirm the installation by clicking on the Install button in the pop-up window.
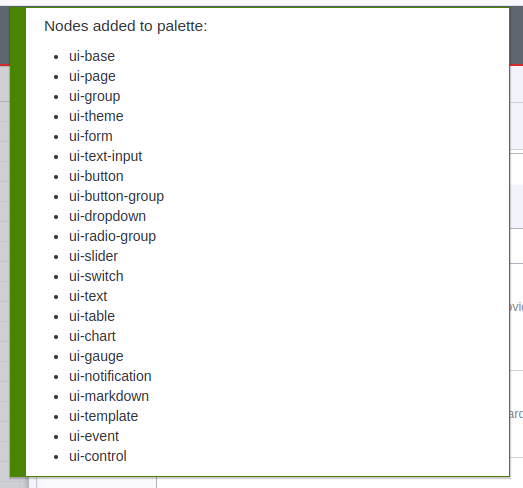
Step 4.- You will see a list of the dashboard 2 nodes that have been installed.
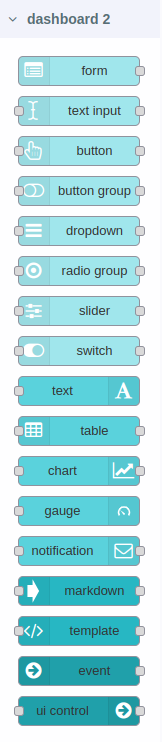
Step 5.- In workspace you can see the available nodes in the nodes palette, as shown in the following image:
See the following GIF for a visual demonstration of the installation process:
Click to Expand
Importing Dashboard Flow
Now you are ready to import the NCD Dashboard subflow, which has been specifically designed and optimized for seamless integration with NCD sensors. The import process is straightforward; however, it is essential to follow these steps carefully:
Copy the JSON: First, locate and copy the contents of the NCD Dashboard JSON file.
Import the JSON: Within your Node-RED workspace, utilize the import function (typically found in the Node-RED menu) to bring in the copied JSON data.
Successfully completing these steps will import the NCD Dashboard elements directly into your Node-RED workspace, enabling you to visualize and interact with your NCD sensor data effectively.
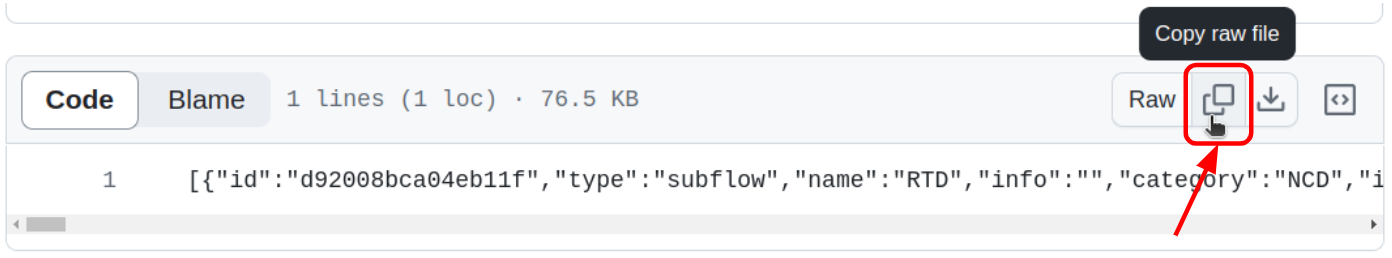
Step 1. Click on the following link to access the NCD Dashboard source code:
Step 2. Once the repository is open, locate the button that allows you to copy the raw code of the NCD Dashboard. Refer to the following image for a visual reference:
Click to expand
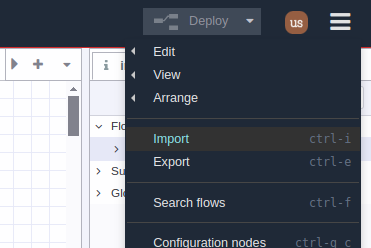
Step 3. Head back to the Node-RED editor and go to the Main Menu (icon in the upper right corner) then click on “Import” option, as shown in picture:
Click to expand
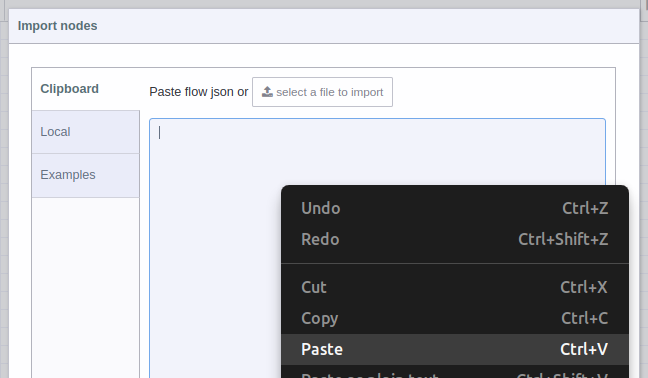
Step 4. A text-box will be opened. Right click and paste the code you just copied from GitHub, as shown in picture:
Click to expand
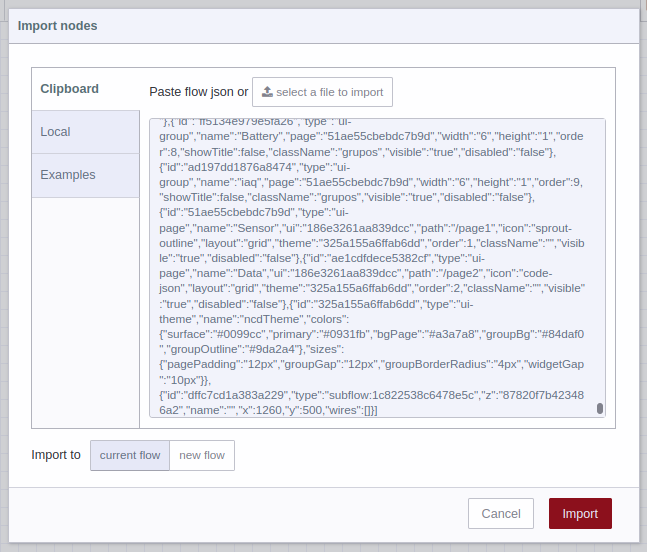
Step 5. You should see the JSON code in text-box, now you can press the red “Import” button at the bottom right (by default the “current flow” option is selected):
Click to expand
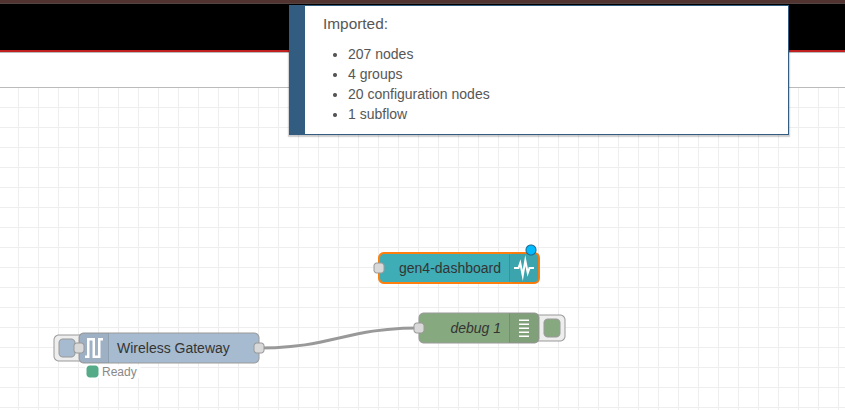
Step 6. In the top of the Node-RED editor, you will see information of the NCD-Dashboard you just imported, and automatically you will have the node available inside the node editor, now you can position it inside the editor or workspace by left clicking:
Configuring
This section delves into configuring and connecting nodes within the Node-RED editor. Here, we’ll explore:
Node Connections: Learn how to establish connections between your nodes to create the desired data flow.
Properties and Data Storage Configuration: Discover the property that allows you to define the path where sensor data will be stored within the NCD-Dashboard node.
NCD Dashboard Node Status: Understand how to utilize the visual node status feature to monitor the operational state of each node.
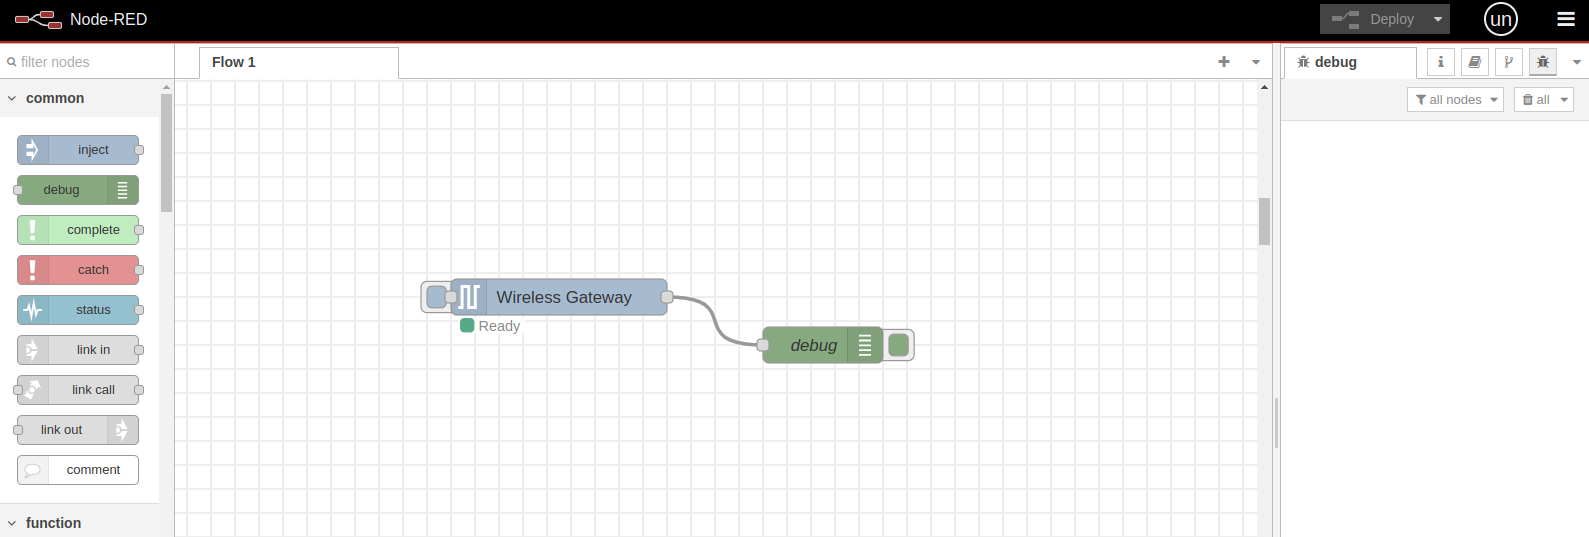
When you first access the Node-RED interface from the Enterprise IIoT Gateway, you will see the flow on the right side. This flow consists of two nodes: the Wireless Gateway node and the Debug node.
Wireless Gateway Node: This node is primarily used for debugging and configuring sensors. It is equipped with a button on the flow that switches the modem between configuration and listening modes. Whenever sensor data is received from any sensor on the network, this node will output a message containing all relevant information, as shown in the example below.
Debug Node: The Debug node will receive messages from the Wireless Gateway node and display them in the Debug tab.
Click to expand
Connection
The NCD Dashboard node is designed to work with the output messages from the Wireless Gateway node. Therefore, when importing the NCD Dashboard into your current project, you will need to connect the output of the Wireless Gateway node to the input of the NCD Dashboard node by adding a new connection, as shown in the image on the right
Click to expand
Note
Each time an NCD sensor sends data to the Wireless Gateway node, and it is connected to an NCD Dashboard node, the Dashboard node stores the sensor’s MAC address. This allows you to have multiple sensors connected to the network and access their data within the dashboard using their MAC address.
When a new sensor sends data, you will automatically see a message indicating that data has been received from a new sensor. The message will display the device’s MAC address, and the sensor will be automatically added to the list of available devices in the Address Dropdown (if it corresponds to a sensor type supported by the current dashboard).
Properties and Data Storage Configuration
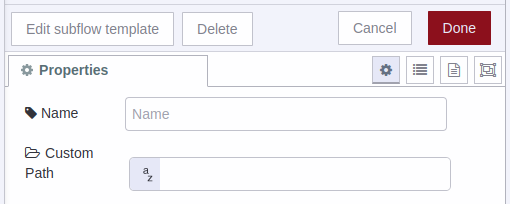
If you double left click on the NCD Dashboard node you can open the Properties.
Name: You can assign an identifier to the NCD-Dashboard node. This name only helps distinguish your specific node within the node editor (from other nodes).
Custom Path: By default, this property is set to a fixed location. The NCD-Dashboard retrieves data from your sensor and stores it locally within Node-RED.
Data Storage: The NCD-Dashboard automatically saves the generated CSV files from the sensor(s) within the Node-RED folder:
/home/ncdio/.node-red/ncd_dashboard/log/
Click to expand
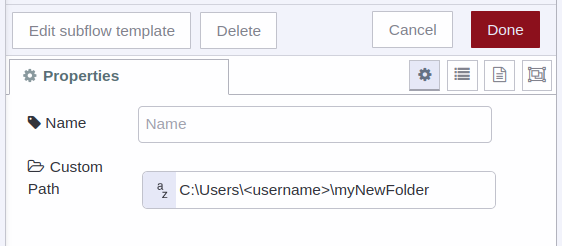
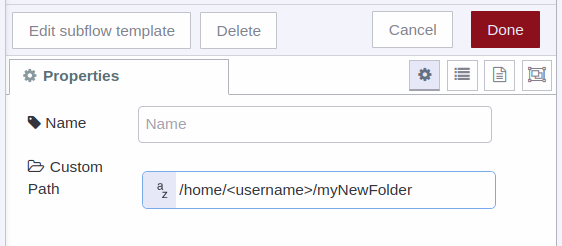
NoteBy default, the NCD-Dashboard stores sensor data in its default location. However, you have the flexibility to specify a different valid local path for data storage. To do this, simply assign the desired local directory path to the “Custom Path” property within the NCD-Dashboard node. The NCD-Dashboard will then use your designated path to store sensor data.
Click to expand
Click to expand
Node Status
The NCD Dashboard nodes are designed to provide visual feedback on their operational state. This status can vary depending on the node’s input data or configuration. Here are some common scenarios you might encounter:
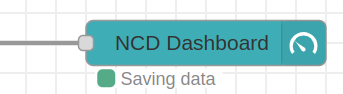
1. If the path you enter is correct, or if you leave the property field blank (using the default path), you should see a “Saving data” status when new sensor data arrives at the node input, indicating successful storage.
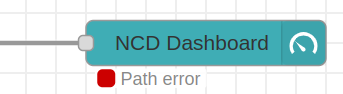
2. It’s important to assign a valid route. If the NCD-Dashboard detects an invalid route, it will display a “Path error” message.
Accessing Dashboard
After successfully configuring and connecting your nodes, the next step is to access the user interface. This is where the NCD Dashboard elements, such as gauges, charts, and buttons, are displayed.
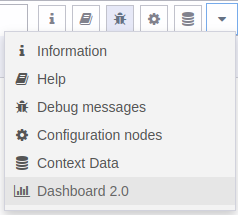
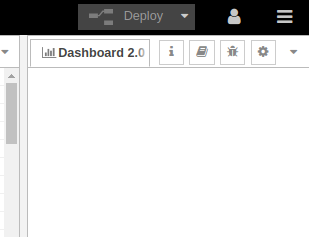
Step 1. Clic on the “Dashboard 2.0” option in the sidebar:
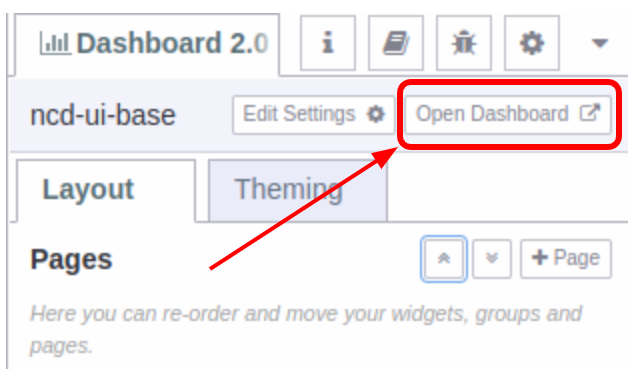
Step 2. Then click on the “Open Dashboard” option:
NoteIn case you have deployed and cannot see the “Dashboard 2.0” content, you should reload the current page of the web browser with the “F5” key or “Reload page”.
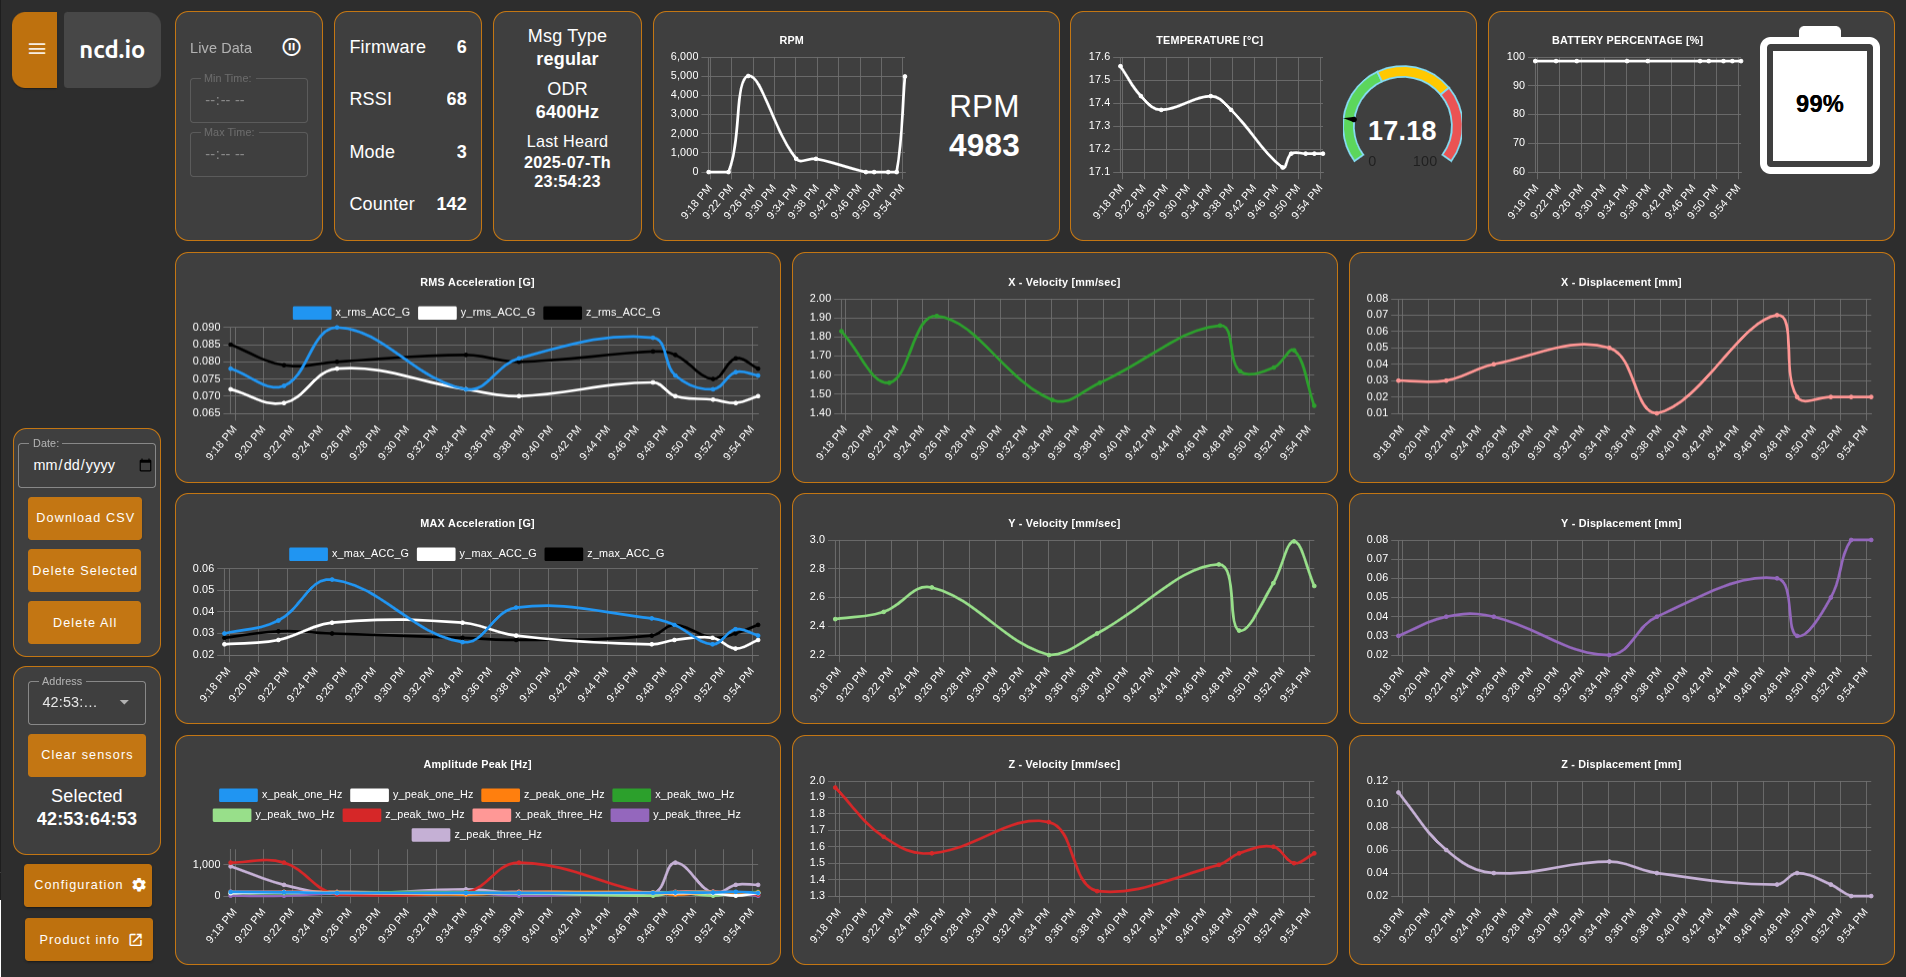
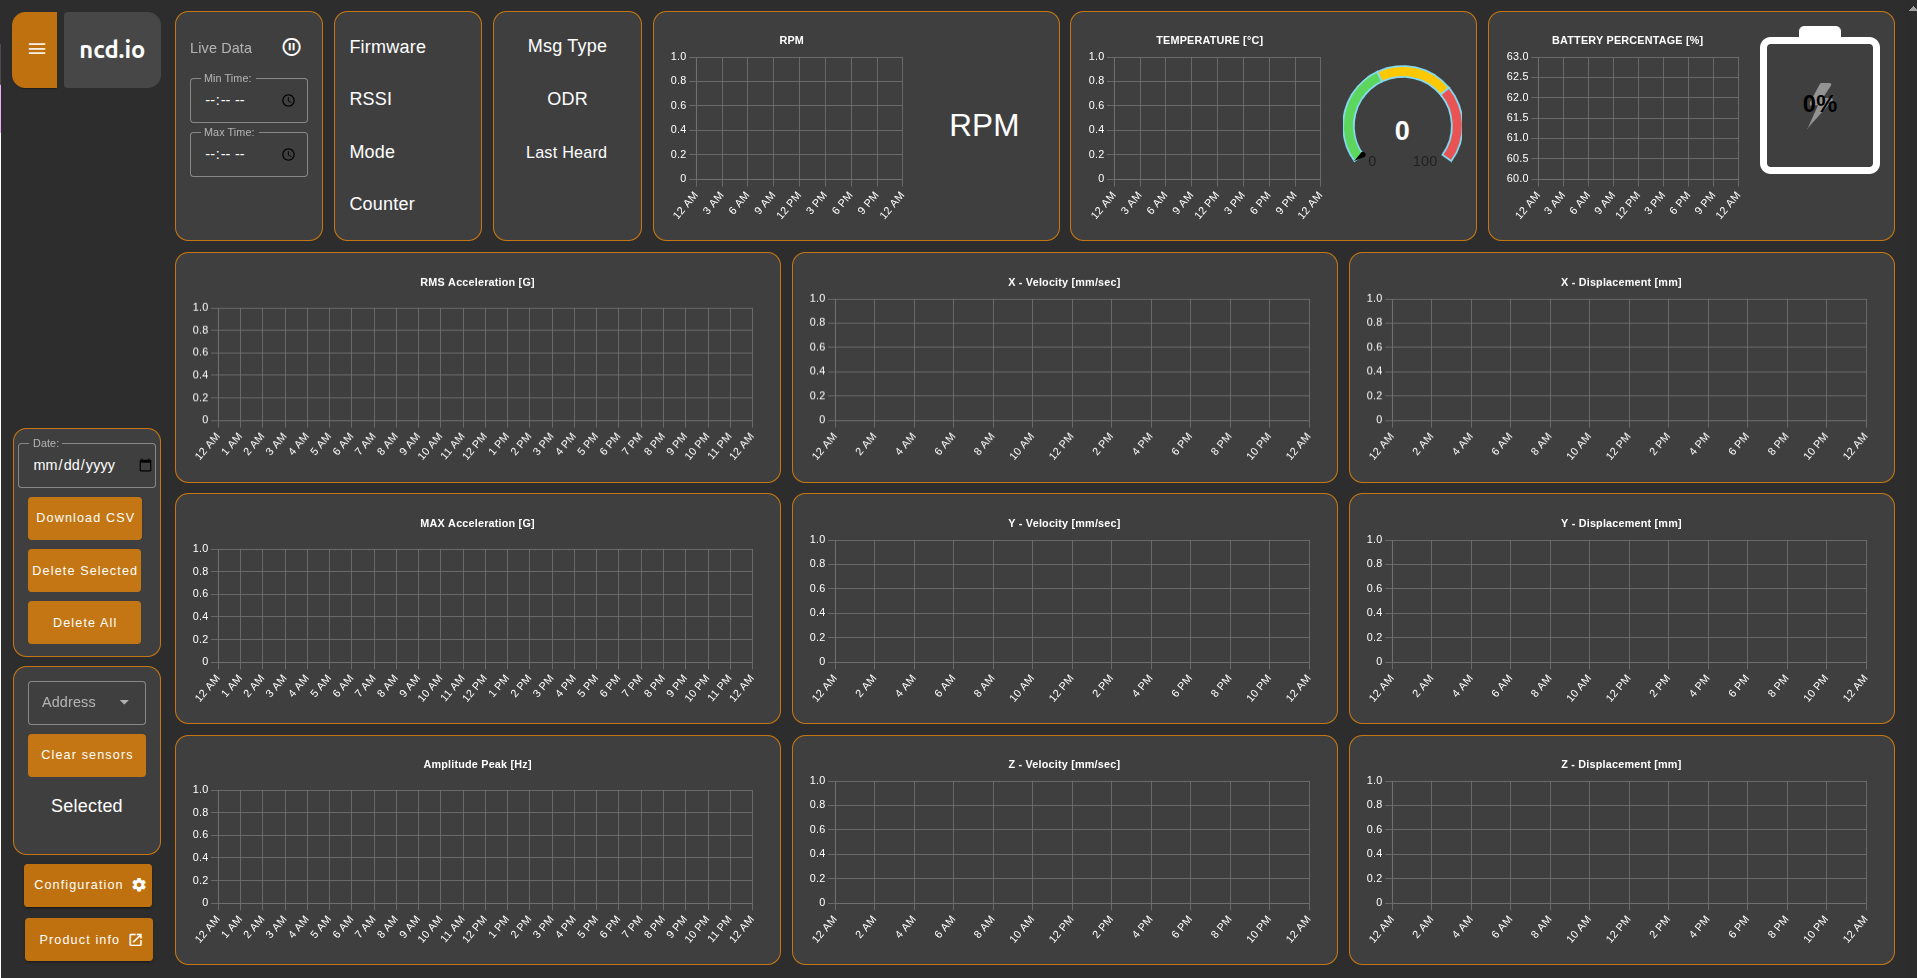
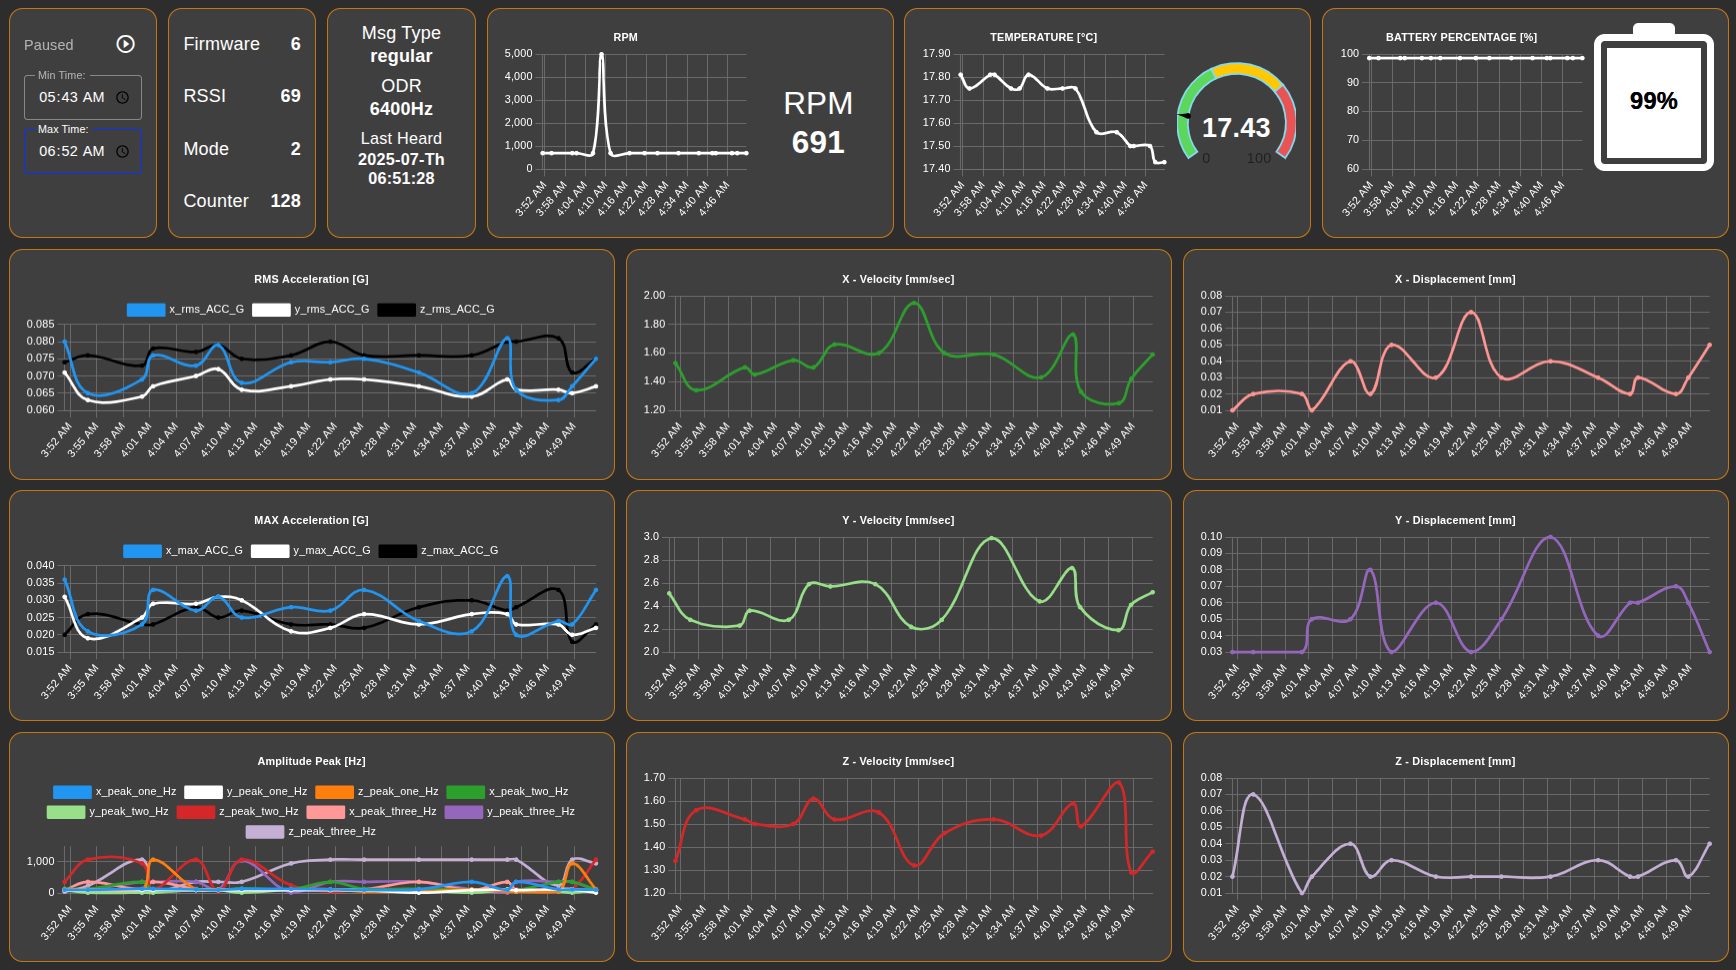
Step 3. Your NCD Dashboard will automatically open in a new window, displaying the following elements:
Click to expand
Features
The Node-RED subflow dashboard for Generation 4 Smart Vibration Sensors offers a robust set of features designed to enhance your monitoring experience:
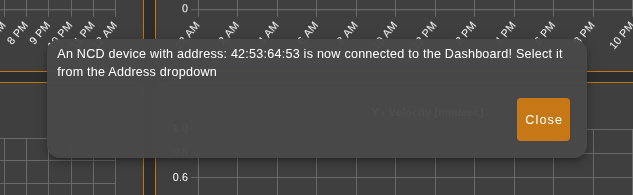
Multi-Sensor Management
The dashboard provides seamless management of multiple Vibration Gen4 Sensors.
Upon the arrival of new sensor data from the Wireless Gateway node, the dashboard automatically displays a pop-up window showing the sensor’s MAC address.
Click to expand
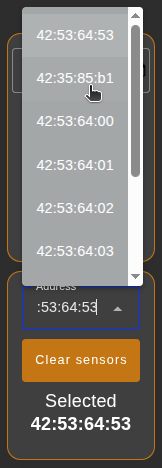
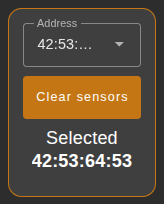
Each new sensor’s MAC address is automatically added to a dedicated Address dropdown menu. Users can then easily select a sensor’s MAC address from this dropdown to load and display its corresponding data.
Click to expand
A “Selected Indicator” prominently shows the MAC address of the currently chosen sensor, allowing for quick identification of which sensor’s data is being plotted on the charts and widgets at any given time.
Click to expand
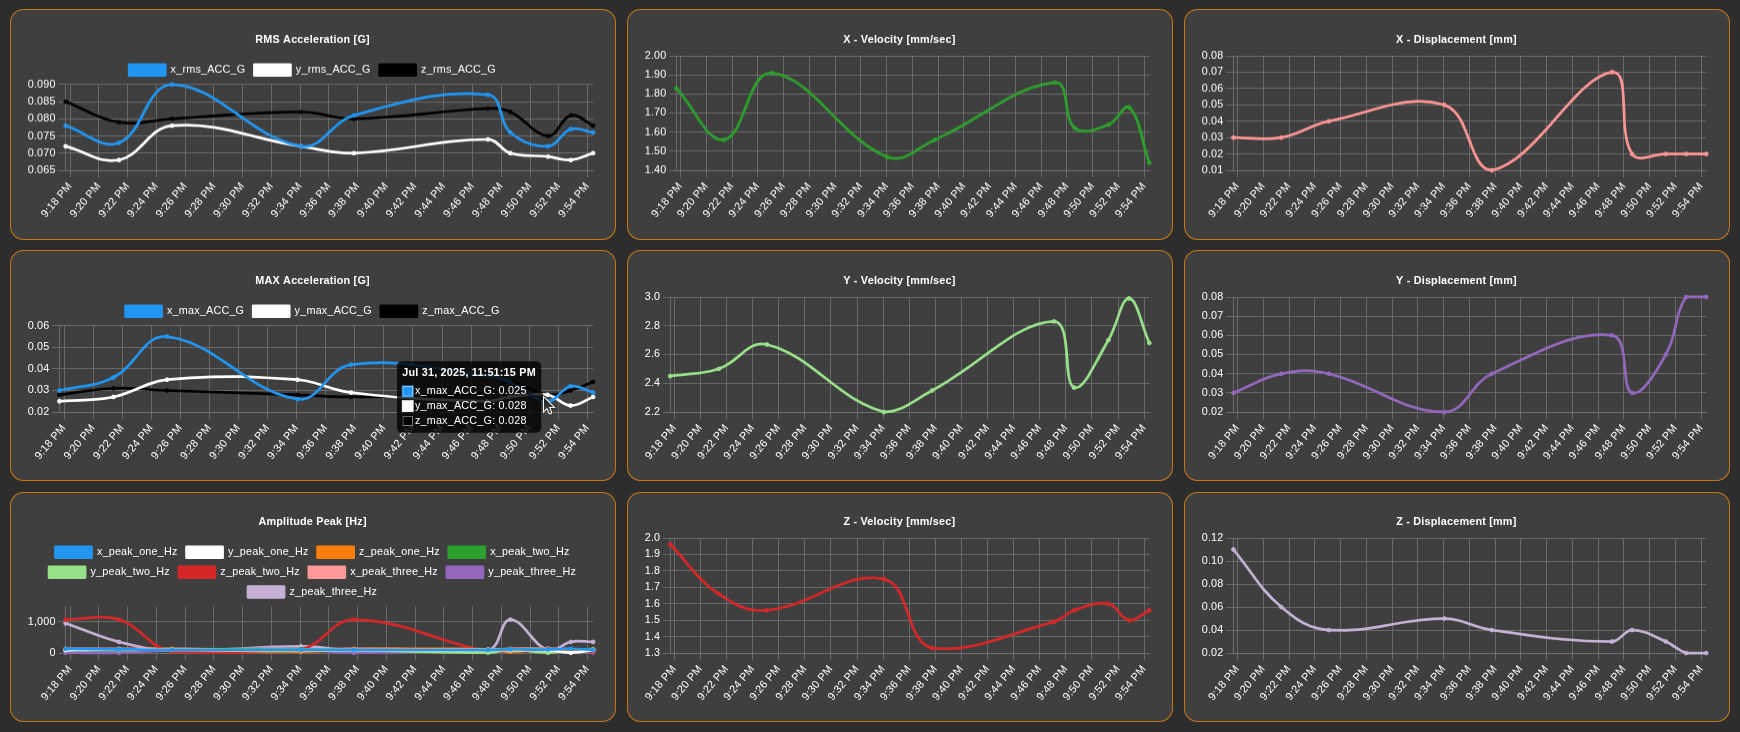
Main Vibration Data Charts
These charts are central to visualizing your vibration data.
Whenever a Vibration Gen4 sensor is selected via the MAC address dropdown, its corresponding stored data is automatically loaded and plotted on the main charts.
For live monitoring, the charts display the latest 20 sensor data values in real-time.
Click to expand
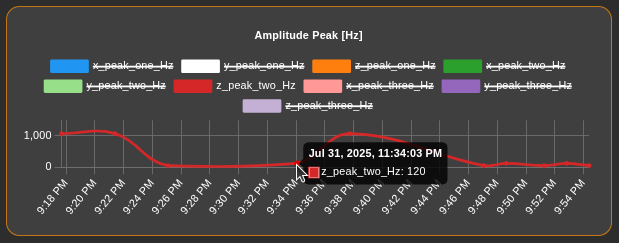
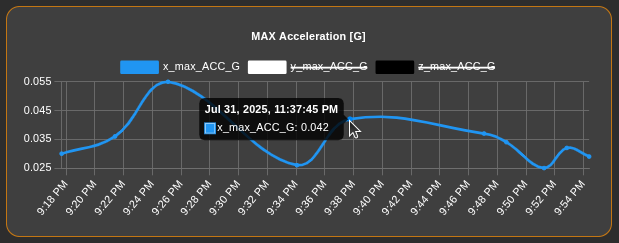
NoteUsers can easily show or hide individual chart lines for a more focused analysis by simply clicking on the corresponding label in the chart legend. This allows you to selectively view only the data of interest for in-depth analysis.
Click to expand
Click to expand
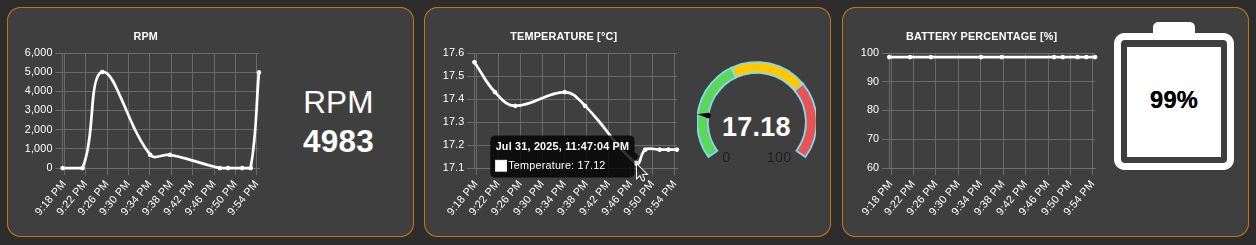
Main Widgets
Complementing the charts, a set of main widgets provides quick access to critical sensor parameters.
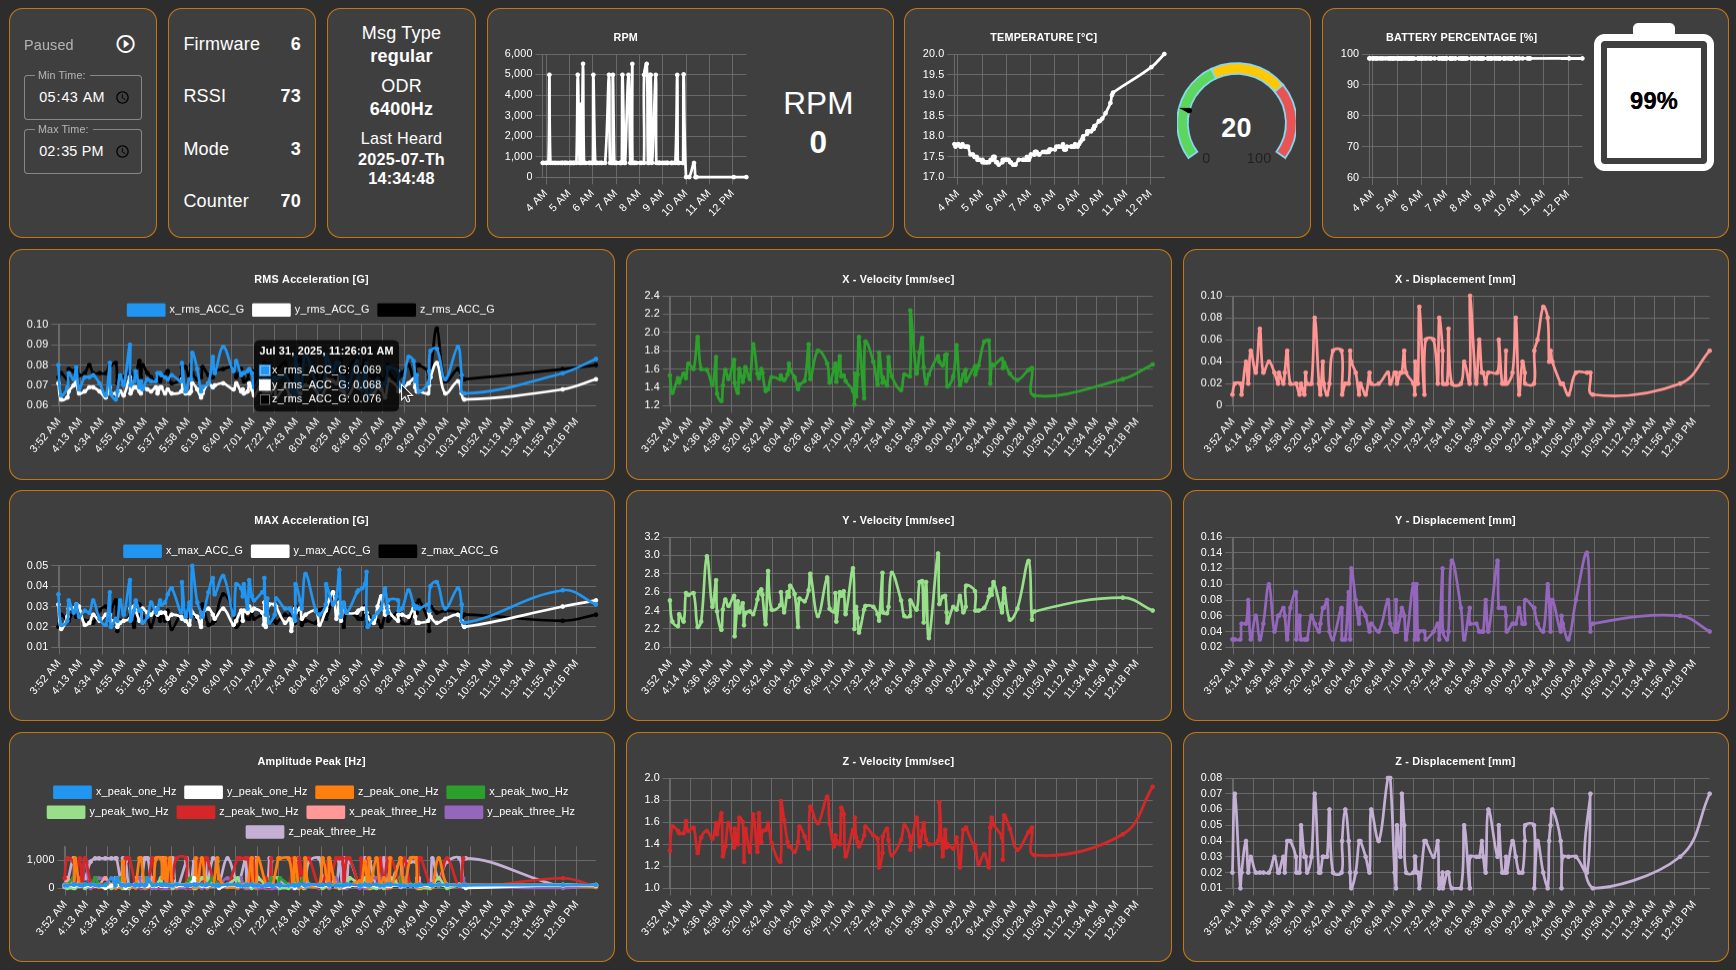
The dashboard incorporates widgets for RPM, temperature, and battery percentage, allowing for effortless monitoring of the latest values for these key sensor data points.
Click to expand
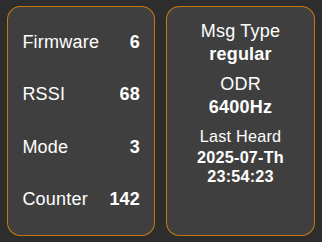
Sensor Data Details
Beyond the charts and widgets, the dashboard provides essential details about the selected sensor.
When a sensor is selected from the dropdown, the dashboard also displays important sensor-specific information, including firmware version, RSSI (Received Signal Strength Indicator), current operation mode, counter values, type of transmission, Output Data Rate (ODR), and “Last Heard” timestamp.
This data represents the latest values received from the selected sensor and is crucial for understanding its current settings and for data analysis context.
Click to expand
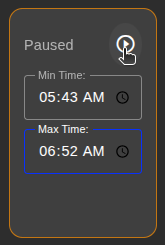
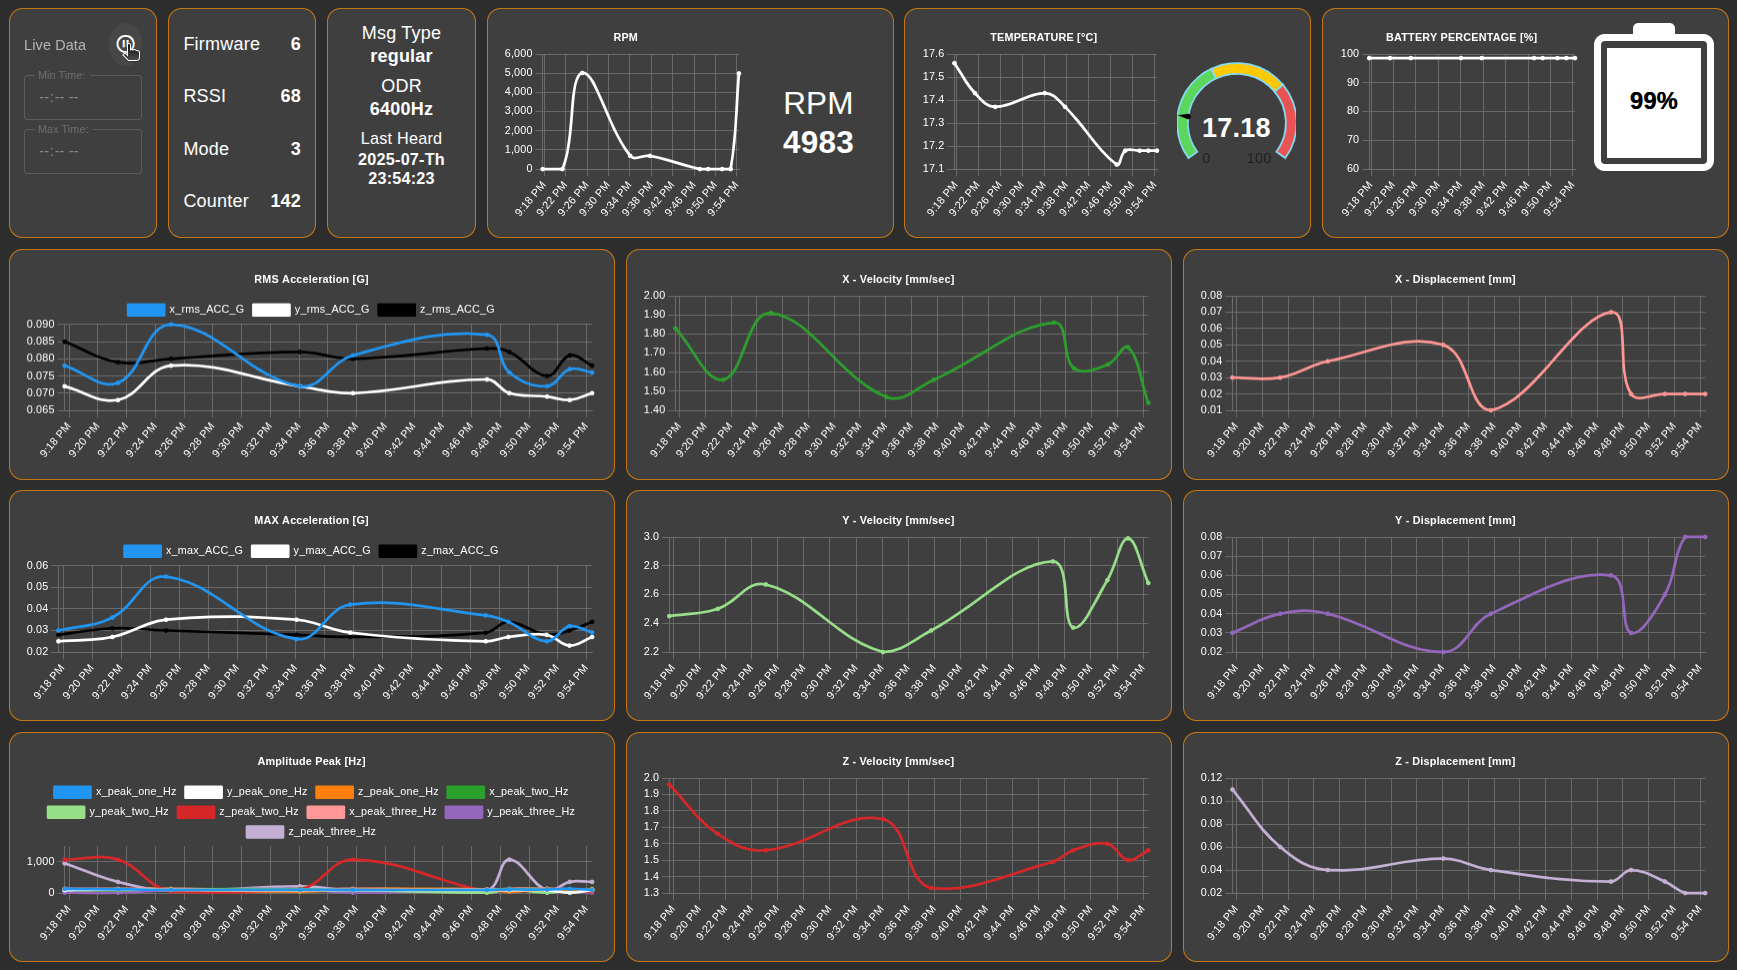
Live and Historical Sensor Data Analysis
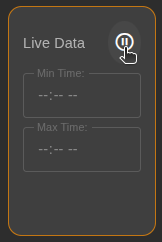
The dashboard supports both real-time monitoring and historical data review.
Live Mode: This is the default mode, designed for monitoring live sensor data. In Live Mode, the dashboard continuously plots the latest 20 sensor data values on the charts, and widgets display the most current single value.
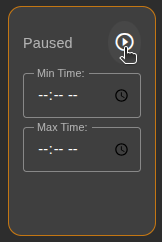
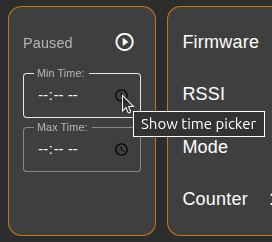
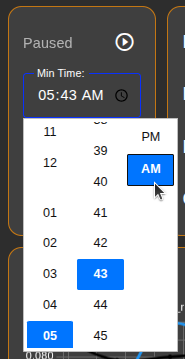
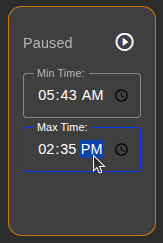
Stand-by Mode (Paused): Users can switch from Live to Stand-by (Paused) mode to analyze historical data. In this mode, the time date picker becomes active, allowing users to define a custom minimum and maximum time range for data to be loaded and plotted on the charts. Widgets will display the latest value within the selected maximum time.
Click to expand
Click to expand
Data Availability: If no data is stored within the user-defined time range in Stand-by Mode, no sensor data will be plotted on the charts or displayed in the widgets.
Click to expand
Click to expand
Click to expand
Click to expand
Click to expand
Returning to Live Mode: To revert to real-time monitoring, simply click the “Live” button. This will automatically plot the latest 20 sensor data values on the charts and update widgets with the most current values.
Click to expand
Click to expand
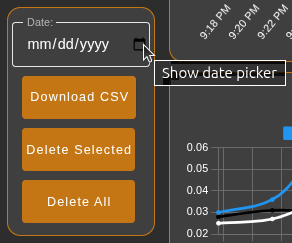
Download CSV File
The dashboard automates data logging and provides convenient download options.
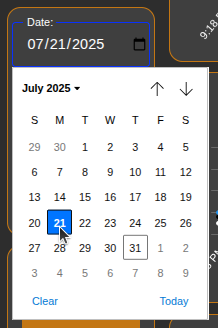
The dashboard automatically saves incoming sensor data into daily CSV files. Users can select a specific date using the integrated date picker (accessible via an icon) to download the CSV file for that day.
Click to expand
Click to expand
Clicking “Download CSV File” allows the user to download the file directly to a PC or laptop connected to the same network as the Enterprise Gateway, via a web browser.
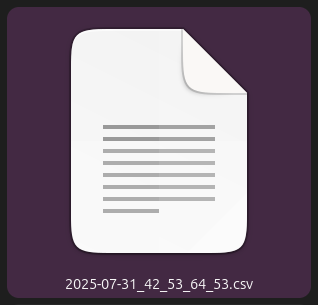
CSV files are named according to the selected date and the sensor’s MAC address:
YYY-MM-DD_XX_XX_XX_XX.csv
The CSV file incorporates important information, with the following columns representing the daily saved sensor data: (Here you would list the columns of the CSV file).
time
counter
battery_percent
rssi
sensor_type
mode
msg_type
odr
temperature
x_rms_ACC_G
x_max_ACC_G
x_velocity_mm_sec
x_displacement_mm
x_peak_one_Hz
x_peak_two_Hz
x_peak_three_Hz
y_rms_ACC_G
y_max_ACC_G
y_velocity_mm_sec
y_displacement_mm
y_peak_one_Hz
y_peak_two_Hz
y_peak_three_Hz
z_rms_ACC_G
z_max_ACC_G
z_velocity_mm_sec
z_displacement_mm
z_peak_one_Hz
z_peak_two_Hz
z_peak_three_Hz
rpm
firmware
received
addr
Reported Configuration
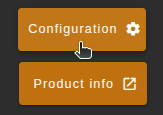
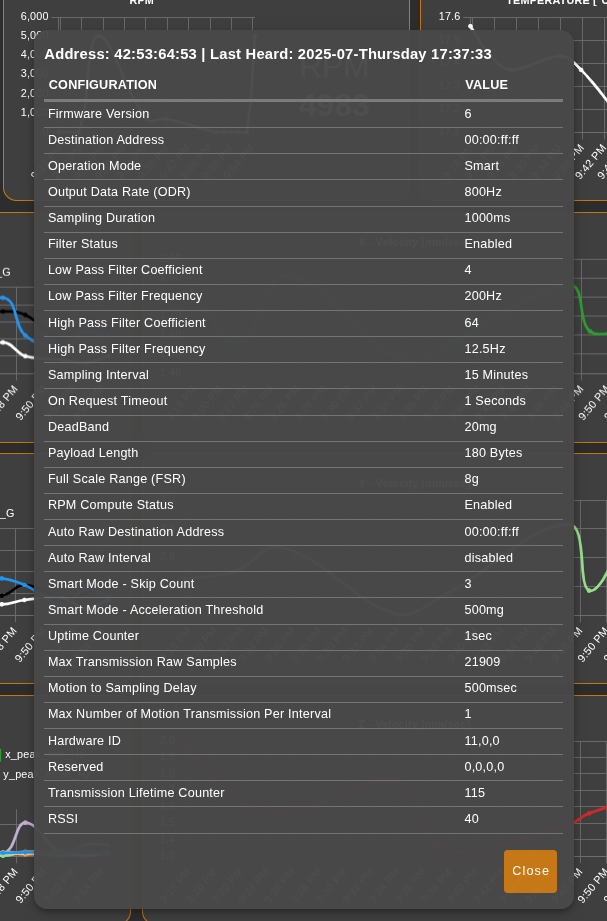
The dashboard automatically saves the latest FLY message transmitted by the vibration sensor. This feature allows users to easily verify the actual sensor configurations for the selected sensor by clicking on the “Configuration” button. A pop-up window will then display the most recently reported configuration values contained within the FLY message.
Click to expand
Click to expand
Summary
This article provided a step-by-step guide on how to import an NCD Dashboard for Vibration Gen4 Sensor. The main features of this dashboard were presented, along with each of the available elements. This dashboard is designed to simplify the integration of NCD sensors with a graphical interface, enabling the monitoring of field variables emitted by the sensor and providing a CSV record of each value.