
Node-RED Dashboard – Thermocouple Alert
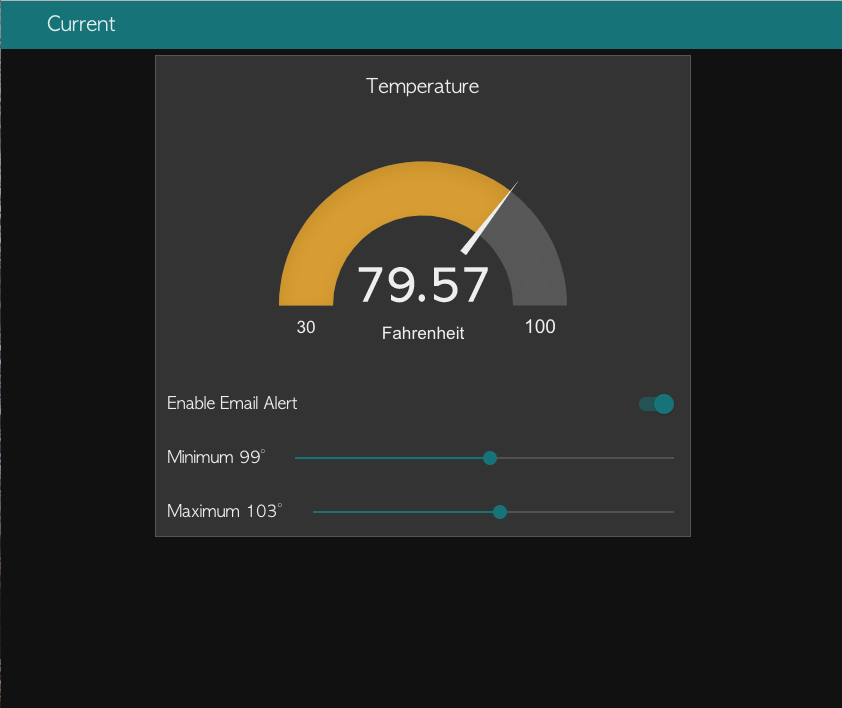
Learn how to set up a dashboard to view the temperature reported by this Wireless Enterprise Sensor, and optionally send an email when it drifts outside of a configurable range.
Node-RED Dashboard Flow The examples in this series are for use with Node-RED and our Wireless Enterprise line of products. If you haven’t already, check out this post, which will explain the packages required for this flow. This example will set up a dashboard with 2 tabs, one containing current readings, the other showing historical data. All telemetry reported from the sensor is displayed in both tabs. Usage Click on the flow below to copy it to your clipboard. From the hamburger menu on the top right of your flow window, hover over import, click clipboard, and paste in the
Features Industrial Grade Sensor with Ambient Temperature Range -200°C [-328°F] to 260°C [500°F]) Resolution 0.0625°C Accuracy of ±2.2°C 2 Mile Range with On-Board Antenna Superior LOS Range of up to 28 miles with High-Gain Antennas Interface to Raspberry Pi, Microsoft Azure, Arduino and More Example Software for Visual Studio and LabVIEW Wireless Mesh Networking using DigiMesh® 256 Sensor Nod e per Network Open Communication Protocol for custom interfacing applications Small Form Factor Wireless Sensor (3×3 inch) Two modes of Operation Configuration mode for Sensor and X-bee Settings Factory Default Option using combination of hardware buttons Power efficient Built-in Sleep mode