Table of Contents
Pre-requisites
Let’s take a look at Sensor Integration! For a Machine Uptime Monitor integration with Qubitro, we are going to be using the MQTT mechanic, pushing data to the Qubitro MQTT Broker. Thus, you would need a device that can transfer sensor data over MQTT.
NCD offer the Enterprise IIoT Gateway that has Node-Red built-in, and is pre-configured to ingest data – you only need to add a block for the sensor (this needs to be configured for the particular sensor) and one for the MQTT.
Additionally you will need to have a Qubitro account.
Connecting to the Gateway and Node-Red
For a quick refresher on how to set up your Gateway for the first time, please head to our article on the topic. Once you have it connected to your network and have it set up to connect to the Internet, you can connect directly to its Node-Red instance via the following address:
XX.XX.XX.XX:1880
Where xx.xx.xx.xx stands for the local IP address of the Gateway (for example the one assigned to it via your router, or manually set via its settings) and the port used is 1880 (this is the default for the Node-RED instance running on the NCD Edge gateway).
A freshly provisioned gateway will greet you with the following:

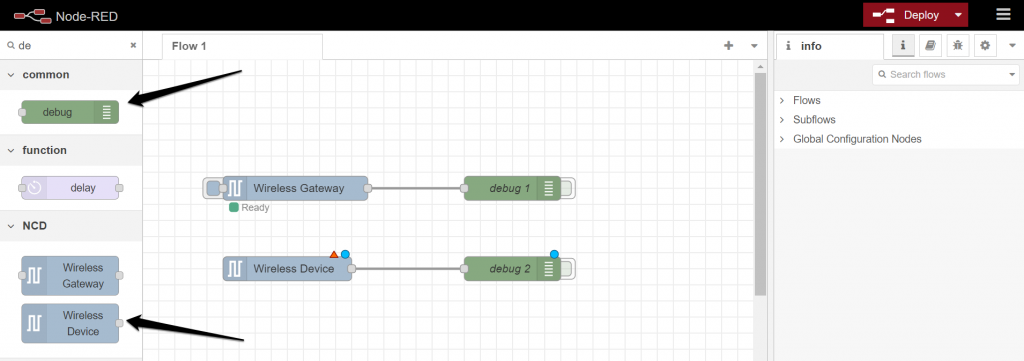
The Gateway itself should be set up and Node-RED should be pre-configured to connect to it (you should see the green “Ready” message below the block).
Additionally, it comes with the NCD library installed so you can quickly proceed to connecting the sensor. This part is very straight forward as the Gateway comes pre-configured. The next portion will require a bit more tinkering.
Connecting your Sensor to the Gateway
The next step in making a Machine Uptime Monitor integration with Qubitro is to connect the sensor to the Gateway. The Gateway will be the Edge Device that will forward the data to Qubitro, thus it needs to first receive it wirelessly from the sensor and properly handle it.
Pull in a Wireless Device block into the flow and attach a debug block to it. This will represent the sensor and the debug block will give you the ability to examine the sensor readings that are sent to the gateway. Your flow should look like this.

As every NCD sensor is different, you would need to configure the Wireless Device block specifically for the one you are using. This example will focus on the Machine Up Time Monitor.
Double click on the Wireless Device to get to its “Properties” window. You can give it a name (leaving it empty will populate it with the sensor type), configure the Serial Device interface and the Serial Device for Config interface and select the Sensor type.
As the Gateway block is pre-configured you should see its port listed in the two drop down menus for the Serial Device. Select whichever port is available to assign it. Leave the Mac Address empty for now (this would ingest data from any sensor, not filtering by MAC).
For Sensor Type select 108 – Machine Uptime Monitor(again this is specifically for this sensor, choose whichever matches your use-case).
Check the Auto Config and the OTF Config boxes so you can configure the sensor remotely. Submit your changes and deploy the flow and your sensor should be set up. If you power on the sensor at this point you should see data in the debug window (debug 2 node).

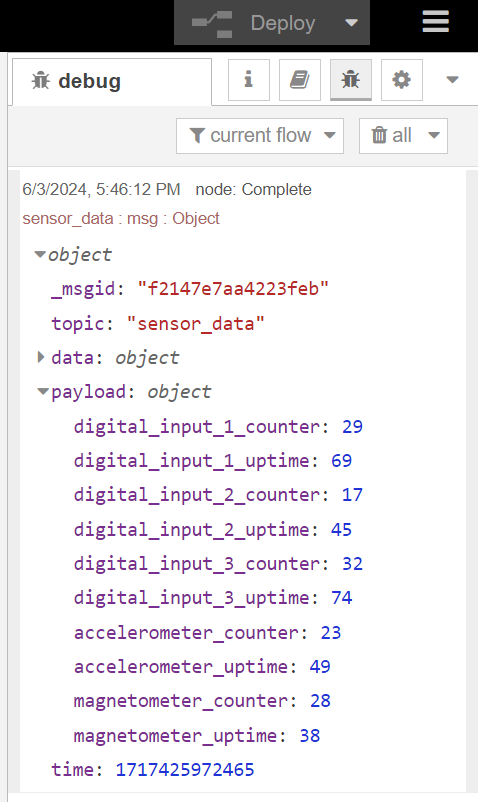
If the configuration was successful you should see data in the debug window. For this particular sensor you would see something similar to the following.

Now that the sensor is transmitting data and the gateway is ingesting it, we need to connect the gateway to the Qubitro MQTT broker.
Pushing the Data to Qubitro over MQTT
In order to push data from the Gateway to the platform, you would need to configure Node-RED to send it via MQTT to the Qubitro MQTT broker. The Gateway comes with the MQTT library pre-installed so you only need to drag the block into the flow and connect it to the output of the sensor.
Connecting things this way will forward the data only from this single sensor, thus you can choose to connect many sensors to one gateway. In this case, you might want to connect the Gateway to Qubitro itself (this would send data from any sensor connected to the Gateway). However for this example we will keep it simple. Check out the image below, you flow should look like it.

Creating Qubitro Integration
As you become more familiar with the platform and for creating the Machine Uptime Monitor integration with Qubitro, you will need to create an account, if not already done so. If you do not have one yet, follow the link.
Log in ad create a New Project.

Give it a name and press the create button and you will have you first project.

You need to add a new source to the project so data can be forwarded to it. Press on the New source button and create one.

You will be given a number of choices and as you might have guessed you need to select MQTT as this is what the Gateway will be utilizing to forward the data.

Fill in the required fields (use the following image as reference). You can make your own choice as far as naming goes, finalize with the “Create” button.

You should see your new source in your project – it should look like the image below (note that the last time data has been received from this source is displayed at the far right, next to the source type (MQTT in this case).

Click on your new source and expand the “Connection details” menu. This will give you access to the parameters we require for the MQTT out block in our Node-Red instance.

Note that these are all generated automatically – you cannot change them as they are pre-configured by Qubitro.
Configuring MQTT for the gateway/sensor
Go back to Node-RED and open up the MQTT block. Create a new “Server” via the Pen icon.

Give it a name and enter the “Server” address and “Port” (copy them over from the Connection details in Qubitro) We are going to use TLS, so you need to copy the PUBLIC TLS ADDRESS and separate the Port from it. As they are static and are the same for every user, we will list them below in order to avoid confusion
Server: broker.quibitro.com
Port: 8883
Check the “Connect automatically” and “Use TLS” boxes and leave the rest with the default values. Move to the Security tab.

Copy over your “Username” and “Password” from Qubitro (these are unique for your particular account/source). They should be of the format in the image below.

Update and close the “Properties” window. Deploy your flow and you should see green connections across the board.

At this point you have your sensor turned on and connected to the gateway. The sensor is sending data and the Gateway is receiving and forwarding it via Node-Red using MQTT to the Qubitro Cloud broker. The data has reached its end-point, now the only thing left is to visualize it.
Visualizing the Data (Payload and Dashboard)
After creating the Machine Uptime Monitor integration with Qubitro, you can quickly check if the sensor is sending and data is being ingested if you go to the “Cloud Storage” section of your newly created MQTT source. The received data should mirror what you see in the Node-RED debug window.

Great, you have all your readings! Now, you can create a dashboard to present them in a more user-friendly manner. Qubitro gives you many of choices in this regard! Make the best choice that suits you. However, we are going to make a suggestion – one you can use as a base to customize. You can use the following JSON file to import it. Simply select to “Create From a JSON file” when you make your dashboard. Copy over the code from the box below into a new JSON file, and you should see the dashboard.
{"widgets":[{"id":"3ae1a5d1-d339-4e69-8b5a-4d978c8bc1d8","name":"Accelerometer Counter","description":"","subtitle":"","type":"stat","showWidgetName":true,"showWidgetSubtitle":false,"showWidgetDescription":false,"ui":{"h":2,"i":"preview-1715524503362","maxH":16,"maxW":12,"minH":1,"minW":2,"moved":false,"static":false,"w":2,"x":7,"y":0},"data":[{"aggregation":"last","deviceName":"NCD Sensor Data","device_id":"d173d2b6-b1a3-4632-a887-0dbba60496a3","entity":"accelerometer_counter","entityType":"number","id":"preview-1715523782957","projectName":"NCD DigiMesh Sensor Data","project_id":"51a7e0fe-59e6-4e7a-ab3b-6b5490d91d37","ui":{"abbreviation":false,"aggregation":"last","backgroundColor":"#0797ef","color":"#000","decimals":0,"emptyTextValue":"No data received","fontSize":"medium","fontStyle":"regular","fontWeight":"bold","position":"middle","showBackground":true,"showUnit":false,"thresholdList":[],"unit":{"name":"Celsius (°C)","symbol":"°C"}}}],"dashboardId":"10d41378-bdc0-4bd2-a719-e8f18184ea6f","savedId":"3ae1a5d1-d339-4e69-8b5a-4d978c8bc1d8"},{"id":"a06378ac-ba9f-4b21-b074-42fb3b8be51b","name":"Digital Input 1 Uptime","description":"","subtitle":"","type":"stat","showWidgetName":true,"showWidgetSubtitle":false,"showWidgetDescription":false,"ui":{"h":2,"i":"preview-1715524041415","maxH":16,"maxW":12,"minH":1,"minW":2,"moved":false,"static":false,"w":3,"x":0,"y":2},"data":[{"aggregation":"last","deviceName":"NCD Sensor Data","device_id":"d173d2b6-b1a3-4632-a887-0dbba60496a3","entity":"digital_input_1_uptime","entityType":"number","id":"preview-1715524006505","projectName":"NCD DigiMesh Sensor Data","project_id":"51a7e0fe-59e6-4e7a-ab3b-6b5490d91d37","ui":{"abbreviation":false,"aggregation":"last","backgroundColor":"#0797ef","color":"#000","decimals":0,"emptyTextValue":"No data received","fontSize":"medium","fontStyle":"regular","fontWeight":"bold","position":"middle","showBackground":true,"showUnit":true,"thresholdList":[],"unit":{"name":"seconds (s)","symbol":"s"}}}],"dashboardId":"10d41378-bdc0-4bd2-a719-e8f18184ea6f","savedId":"a06378ac-ba9f-4b21-b074-42fb3b8be51b"},{"id":"dba53597-e9e4-42d5-a911-717e2a98fbf0","name":"Accelerometer Uptime","description":"","subtitle":"","type":"stat","showWidgetName":true,"showWidgetSubtitle":false,"showWidgetDescription":false,"ui":{"h":2,"i":"preview-1715524505162","maxH":16,"maxW":12,"minH":1,"minW":2,"moved":false,"static":false,"w":2,"x":7,"y":2},"data":[{"aggregation":"last","deviceName":"NCD Sensor Data","device_id":"d173d2b6-b1a3-4632-a887-0dbba60496a3","entity":"accelerometer_uptime","entityType":"number","id":"preview-1715524006505","projectName":"NCD DigiMesh Sensor Data","project_id":"51a7e0fe-59e6-4e7a-ab3b-6b5490d91d37","ui":{"abbreviation":false,"aggregation":"last","backgroundColor":"#0797ef","color":"#000","decimals":0,"emptyTextValue":"No data received","fontSize":"medium","fontStyle":"regular","fontWeight":"bold","position":"middle","showBackground":true,"showUnit":true,"thresholdList":[],"unit":{"name":"seconds (s)","symbol":"s"}}}],"dashboardId":"10d41378-bdc0-4bd2-a719-e8f18184ea6f","savedId":"dba53597-e9e4-42d5-a911-717e2a98fbf0"},{"id":"4be05987-a51e-436b-8e91-f782fd93269e","name":"Digital Input 2 Counter","description":"","subtitle":"","type":"stat","showWidgetName":true,"showWidgetSubtitle":false,"showWidgetDescription":false,"ui":{"h":2,"i":"preview-1715524259196","maxH":16,"maxW":12,"minH":1,"minW":2,"moved":false,"static":false,"w":2,"x":3,"y":0},"data":[{"aggregation":"last","deviceName":"NCD Sensor Data","device_id":"d173d2b6-b1a3-4632-a887-0dbba60496a3","entity":"digital_input_2_counter","entityType":"number","id":"preview-1715523782957","projectName":"NCD DigiMesh Sensor Data","project_id":"51a7e0fe-59e6-4e7a-ab3b-6b5490d91d37","ui":{"abbreviation":false,"aggregation":"last","backgroundColor":"#1a75ad","color":"#000","decimals":0,"emptyTextValue":"No data received","fontSize":"medium","fontStyle":"regular","fontWeight":"bold","position":"middle","showBackground":true,"showUnit":false,"thresholdList":[],"unit":{"name":"Celsius (°C)","symbol":"°C"}}}],"dashboardId":"10d41378-bdc0-4bd2-a719-e8f18184ea6f","savedId":"4be05987-a51e-436b-8e91-f782fd93269e"},{"id":"cc700f0a-3d59-4dd3-92a9-405d088f9be4","name":"Magnetometer Uptimer","description":"","subtitle":"","type":"stat","showWidgetName":true,"showWidgetSubtitle":false,"showWidgetDescription":false,"ui":{"h":2,"i":"preview-1715524508610","maxH":16,"maxW":12,"minH":1,"minW":2,"moved":false,"static":false,"w":3,"x":9,"y":2},"data":[{"aggregation":"last","deviceName":"NCD Sensor Data","device_id":"d173d2b6-b1a3-4632-a887-0dbba60496a3","entity":"magnetometer_uptime","entityType":"number","id":"preview-1715524006505","projectName":"NCD DigiMesh Sensor Data","project_id":"51a7e0fe-59e6-4e7a-ab3b-6b5490d91d37","ui":{"abbreviation":false,"aggregation":"last","backgroundColor":"#1a75ad","color":"#000","decimals":0,"emptyTextValue":"No data received","fontSize":"medium","fontStyle":"regular","fontWeight":"bold","position":"middle","showBackground":true,"showUnit":true,"thresholdList":[],"unit":{"name":"seconds (s)","symbol":"s"}}}],"dashboardId":"10d41378-bdc0-4bd2-a719-e8f18184ea6f","savedId":"cc700f0a-3d59-4dd3-92a9-405d088f9be4"},{"id":"048f770c-c059-45c3-9a74-9e611739669d","name":"Digital Input 2 Uptime","description":"","subtitle":"","type":"stat","showWidgetName":true,"showWidgetSubtitle":false,"showWidgetDescription":false,"ui":{"h":2,"i":"preview-1715524367902","maxH":16,"maxW":12,"minH":1,"minW":2,"moved":false,"static":false,"w":2,"x":3,"y":2},"data":[{"aggregation":"last","deviceName":"NCD Sensor Data","device_id":"d173d2b6-b1a3-4632-a887-0dbba60496a3","entity":"digital_input_2_uptime","entityType":"number","id":"preview-1715524006505","projectName":"NCD DigiMesh Sensor Data","project_id":"51a7e0fe-59e6-4e7a-ab3b-6b5490d91d37","ui":{"abbreviation":false,"aggregation":"last","backgroundColor":"#1a75ad","color":"#000","decimals":0,"emptyTextValue":"No data received","fontSize":"medium","fontStyle":"regular","fontWeight":"bold","position":"middle","showBackground":true,"showUnit":true,"thresholdList":[],"unit":{"name":"seconds (s)","symbol":"s"}}}],"dashboardId":"10d41378-bdc0-4bd2-a719-e8f18184ea6f","savedId":"048f770c-c059-45c3-9a74-9e611739669d"},{"id":"7ef76f95-078e-4ca8-862b-06241c5d40aa","name":"Digital Input 3 Counter","description":"","subtitle":"","type":"stat","showWidgetName":true,"showWidgetSubtitle":false,"showWidgetDescription":false,"ui":{"h":2,"i":"preview-1715524266135","maxH":16,"maxW":12,"minH":1,"minW":2,"moved":false,"static":false,"w":2,"x":5,"y":0},"data":[{"aggregation":"last","deviceName":"NCD Sensor Data","device_id":"d173d2b6-b1a3-4632-a887-0dbba60496a3","entity":"digital_input_3_counter","entityType":"number","id":"preview-1715523782957","projectName":"NCD DigiMesh Sensor Data","project_id":"51a7e0fe-59e6-4e7a-ab3b-6b5490d91d37","ui":{"abbreviation":false,"aggregation":"last","backgroundColor":"#053e5f","color":"#000","decimals":0,"emptyTextValue":"No data received","fontSize":"medium","fontStyle":"regular","fontWeight":"bold","position":"middle","showBackground":true,"showUnit":false,"thresholdList":[],"unit":{"name":"Celsius (°C)","symbol":"°C"}}}],"dashboardId":"10d41378-bdc0-4bd2-a719-e8f18184ea6f","savedId":"7ef76f95-078e-4ca8-862b-06241c5d40aa"},{"id":"fc88d96e-439b-48aa-b137-1ed567a01ffd","name":"Digital Input 1 Counter","description":"","subtitle":"","type":"stat","showWidgetName":true,"showWidgetSubtitle":false,"showWidgetDescription":false,"ui":{"h":2,"i":"preview-1715523812329","maxH":16,"maxW":12,"minH":1,"minW":2,"moved":false,"static":false,"w":3,"x":0,"y":0},"data":[{"aggregation":"last","deviceName":"NCD Sensor Data","device_id":"d173d2b6-b1a3-4632-a887-0dbba60496a3","entity":"digital_input_1_counter","entityType":"number","id":"preview-1715523782957","projectName":"NCD DigiMesh Sensor Data","project_id":"51a7e0fe-59e6-4e7a-ab3b-6b5490d91d37","ui":{"abbreviation":false,"aggregation":"last","backgroundColor":"#0797ef","color":"#000","decimals":0,"emptyTextValue":"No data received","fontSize":"medium","fontStyle":"regular","fontWeight":"bold","position":"middle","showBackground":true,"showUnit":false,"thresholdList":[],"unit":{"name":"Celsius (°C)","symbol":"°C"}}}],"dashboardId":"10d41378-bdc0-4bd2-a719-e8f18184ea6f","savedId":"fc88d96e-439b-48aa-b137-1ed567a01ffd"},{"id":"1b069e5b-b86b-413c-8008-a73e65d9ead8","name":"Digital Input 3 Uptime","description":"","subtitle":"","type":"stat","showWidgetName":true,"showWidgetSubtitle":false,"showWidgetDescription":false,"ui":{"h":2,"i":"preview-1715524427390","maxH":16,"maxW":12,"minH":1,"minW":2,"moved":false,"static":false,"w":2,"x":5,"y":2},"data":[{"aggregation":"last","deviceName":"NCD Sensor Data","device_id":"d173d2b6-b1a3-4632-a887-0dbba60496a3","entity":"digital_input_3_uptime","entityType":"number","id":"preview-1715524006505","projectName":"NCD DigiMesh Sensor Data","project_id":"51a7e0fe-59e6-4e7a-ab3b-6b5490d91d37","ui":{"abbreviation":false,"aggregation":"last","backgroundColor":"#053e5f","color":"#000","decimals":0,"emptyTextValue":"No data received","fontSize":"medium","fontStyle":"regular","fontWeight":"bold","position":"middle","showBackground":true,"showUnit":true,"thresholdList":[],"unit":{"name":"seconds (s)","symbol":"s"}}}],"dashboardId":"10d41378-bdc0-4bd2-a719-e8f18184ea6f","savedId":"1b069e5b-b86b-413c-8008-a73e65d9ead8"},{"id":"0914deb1-943e-403e-aca5-b1311a3a3bb9","name":"Magnetometer Counter","description":"","subtitle":"","type":"stat","showWidgetName":true,"showWidgetSubtitle":false,"showWidgetDescription":false,"ui":{"h":2,"i":"preview-1715524507118","maxH":16,"maxW":12,"minH":1,"minW":2,"moved":false,"static":false,"w":3,"x":9,"y":0},"data":[{"aggregation":"last","deviceName":"NCD Sensor Data","device_id":"d173d2b6-b1a3-4632-a887-0dbba60496a3","entity":"magnetometer_counter","entityType":"number","id":"preview-1715523782957","projectName":"NCD DigiMesh Sensor Data","project_id":"51a7e0fe-59e6-4e7a-ab3b-6b5490d91d37","ui":{"abbreviation":false,"aggregation":"last","backgroundColor":"#1a75ad","color":"#000","decimals":0,"emptyTextValue":"No data received","fontSize":"medium","fontStyle":"regular","fontWeight":"bold","position":"middle","showBackground":true,"showUnit":false,"thresholdList":[],"unit":{"name":"Celsius (°C)","symbol":"°C"}}}],"dashboardId":"10d41378-bdc0-4bd2-a719-e8f18184ea6f","savedId":"0914deb1-943e-403e-aca5-b1311a3a3bb9"}],"expandable":true,"refresh_period":1}

Your sensor is now sending readings to the Gateway and they are visualized in a pleasing Qubitro Dashboard where you can view them online at any time.
This method can be applied to any NCD Enterprise Sensor utilizing DigiMesh and data from multiple sensors can be ingested by the same MQTT integration. You may also create separate ones in the same manner as we did for this one example sensor.
You can choose to separate the sensors with their own MQTT topics or forward the entirety of the data (connect the Gateway directly via MQTT) and separate in via Qubitro in the cloud. Whichever method you choose you have the base now.
