
Table of Contents
Pre-requisites
This tutorial is going to create an Integration between the NCD Machine Uptime Monitoring Sensor and two popular platforms – HiveMQ and DataCake. You will need the following NCD equipment (in addition to the Machine Uptime Sensor):
Enterprise IIoT Gateway or MQTT Micro Gateway – has Node-RED built-in, and is pre-configured to ingest data – you only need to add a block for the sensor ( this needs to be configured for the particular sensor) and one for the MQTT. We are going to use this option for our example as it is a more efficient process.
Connecting to the Gateway and Node-RED
For a quick refresher on how to set up your Gateway for the first time, please head to our article on the topic. Once you have it connected to your network and have it set up to connect to the Internet, you can connect directly to its Node-RED instance via the following address:
XX.XX.XX.XX:1880
Where xx.xx.xx.xx stands for the local IP address of the Gateway (for example the one assigned to it via your router, or manually set via its settings) and the port used is 1880 (this is the default for the Node-RED instance running on the NCD Edge gateway).
A freshly provisioned gateway will greet you with the following:
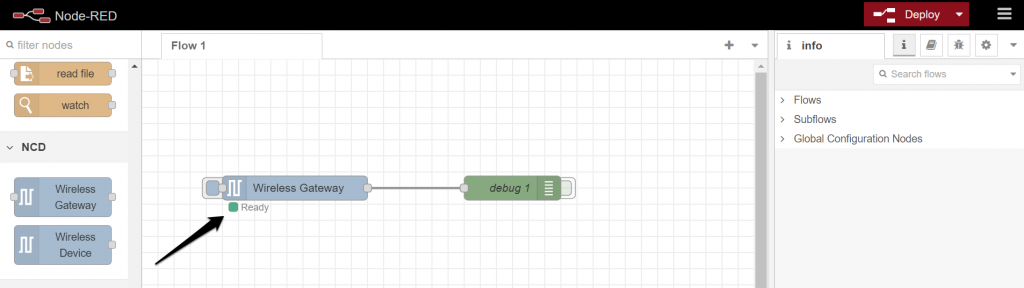
The Gateway itself should be set up and Node-RED should be pre-configured to connect to it (you should see the green “Ready” message below the block).
Additionally, it comes with the NCD library installed so you can quickly proceed to connecting the sensor. This part is very straight forward as the Gateway comes pre-configured. The next portion will require a bit more tinkering.
Connecting your Machine Uptime Sensor to the Gateway
The next step is to connect the machine uptime sensor to the Gateway. The Gateway will be the Edge Device that will forward the data to Qubitro, thus it needs to first receive it wirelessly from the sensor and properly handle it.
Pull in a Wireless Device block into the flow and attach a debug block to it. This will represent the sensor and the debug block will give you the ability to examine the sensor readings that are sent to the gateway. Your flow should look like this.
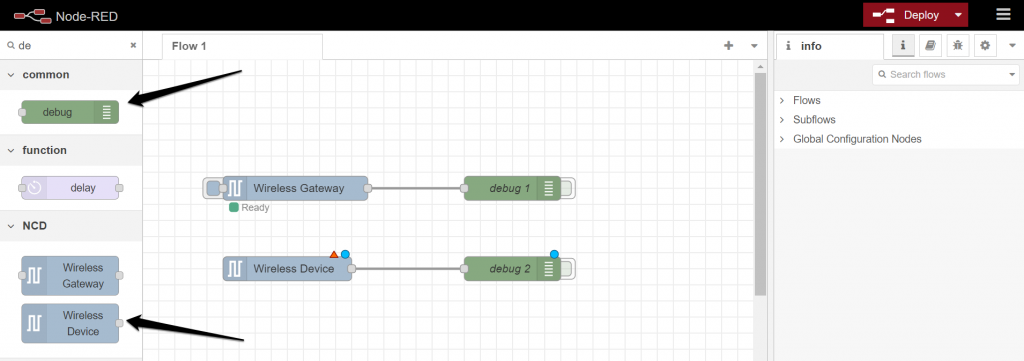
As every NCD sensor is different, you would need to configure the Wireless Device block specifically for the one you are using. This example will focus on the Machine Uptime Monitoring Sensor.
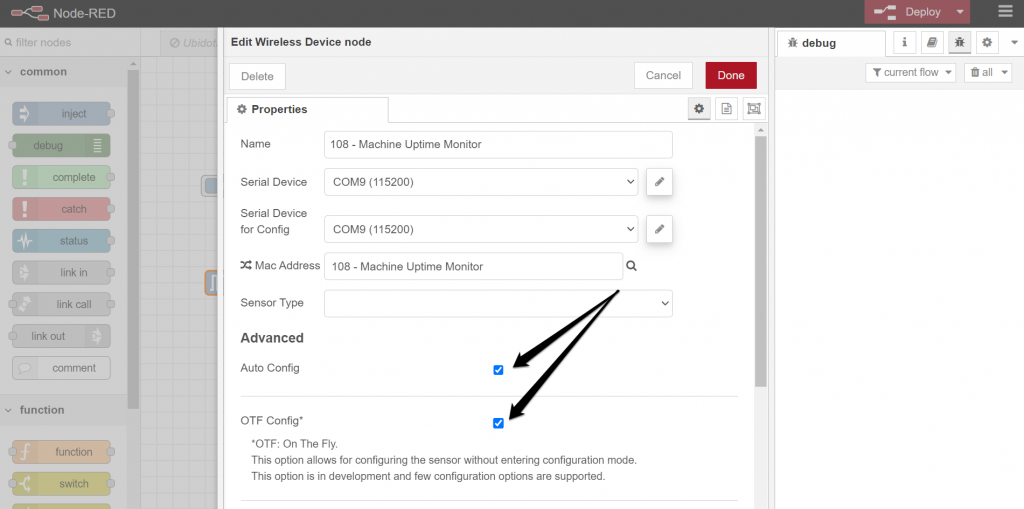
Double click on the Wireless Device to get to its “Properties” window. You can give it a name (leaving it empty will populate it with the sensor type), configure the Serial Device interface and the Serial Device for Config interface and select the Sensor type.
As the Gateway block is pre-configured you should see its port listed in the two drop down menus for the Serial Device. Select whichever port is available to assign it. Leave the Mac Address empty for now (this would ingest data from any sensor, not filtering by MAC).
For Sensor Type select 108 – Machine Uptime Monitor (again this is specifically for this sensor, choose whichever matches your use-case).
Check the Auto Config and the OTF Config boxes so you can configure the sensor remotely. Submit your changes and deploy the flow and your sensor should be set up. If you power on the sensor at this point you should see data in the debug window (debug 2 node).
If the configuration was successful you should see data in the debug window. For this particular sensor you would see something similar to the following.
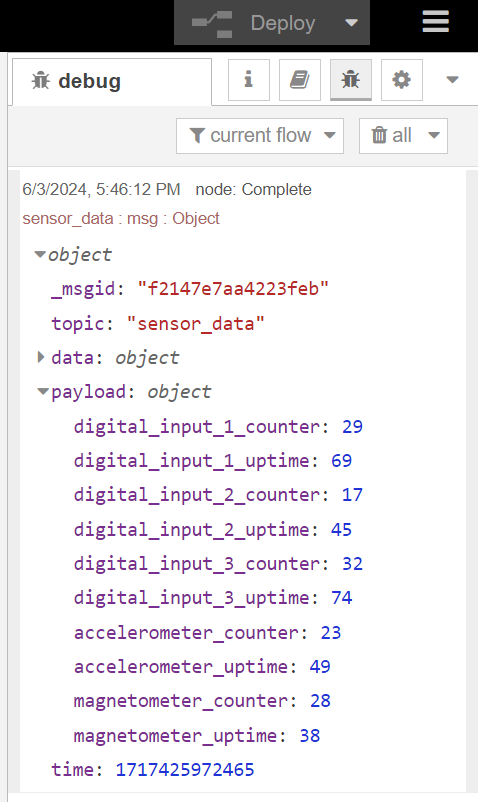
Now that the sensor is transmitting data and the gateway is ingesting it, we need to connect the gateway to the HiveMQ MQTT broker.
Pushing the Data to HiveMQ over MQTT
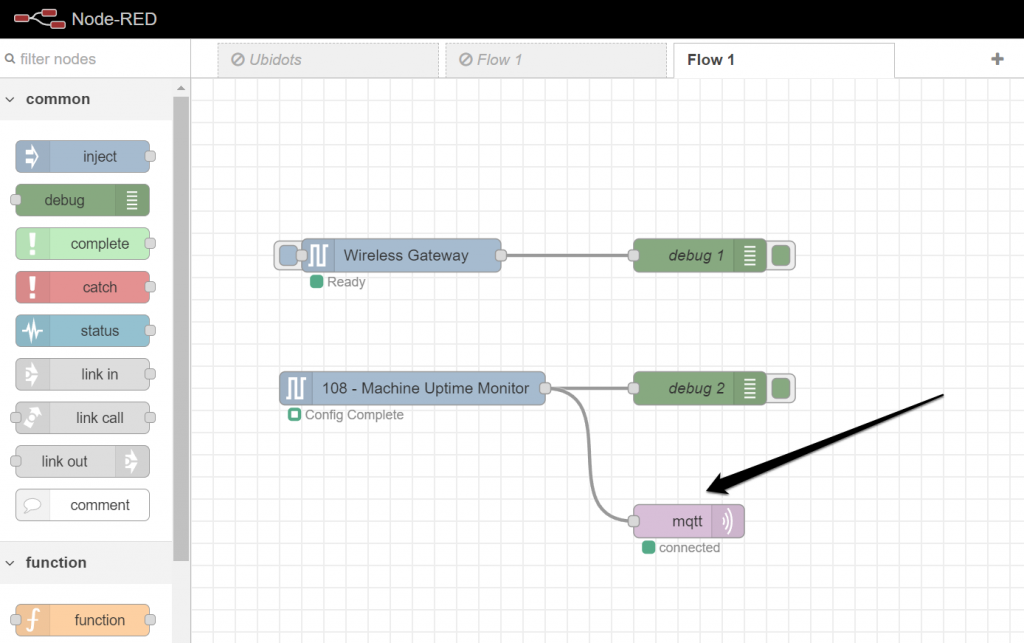
In order to push data from the Gateway to DataCake, you would need to configure Node-RED to send it via MQTT to the HiveMQ Broker first. The Gateway comes with the MQTT library pre-installed so you only need to drag the block into the flow and connect it to the output of the sensor.
Connecting things this way will forward the data only from this single sensor, thus you can choose to connect many sensors to one gateway. In this case, you might want to connect the Gateway to HiveMQ itself (this would send data from any sensor connected to the Gateway). However for this example we will keep it simple. Check out the image below, you flow should look like it.
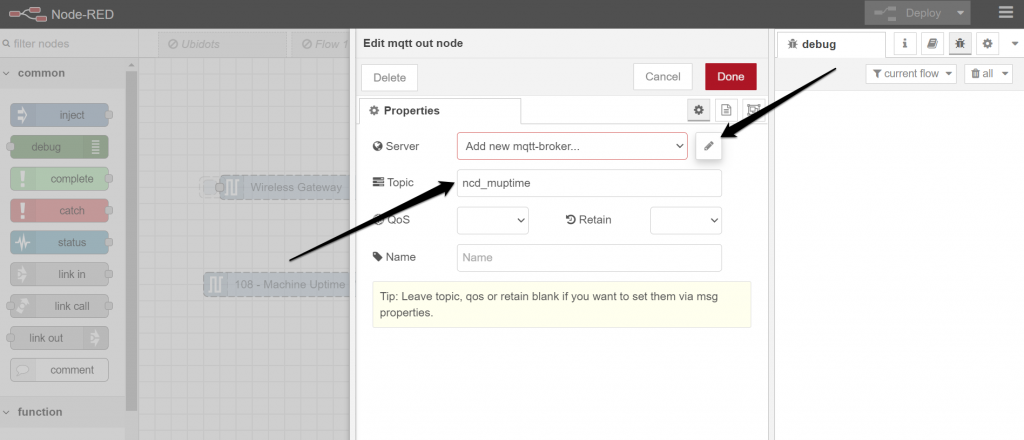
Now you need to configure the “mqtt out” node to send to the HiveMQ Broker. Open it up and enter a “Topic” name (we are using ncd_muptime, if you decide to use another it must be reflected in all subsequent fields where it exists). Press on the Pen icon to edit the connection configuration (refer to the image below).
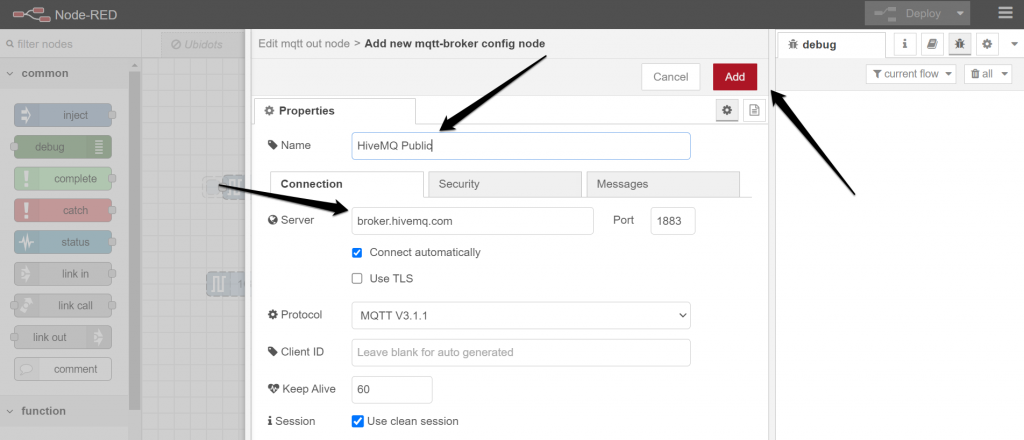
Enter the following (as per the image below):
Name: HiveMQ Public (you can choose another it won’t create an issue)
Server: broker.hivemq.com (this is the address of the HiveMQ Public broker, you can also get it from their dashboard here)
Leave the rest with the default values, press the “Add: button followed by the “Done” button and your node is configured.
If you Deploy your flow your Node-RED will connect with the broker and any data that the sensor sends will be forwarded to the ncd_muptime topic.
Forwarding the data to DataCake
Creating the Integration
As you become more familiar with the DataCake platform you will need to create an account, if not already done so. If you do not have one yet, follow the link.
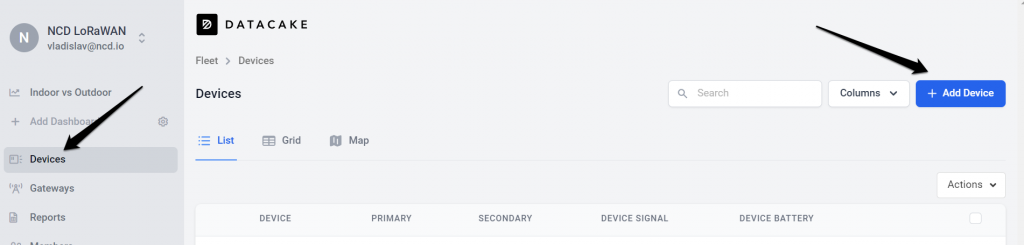
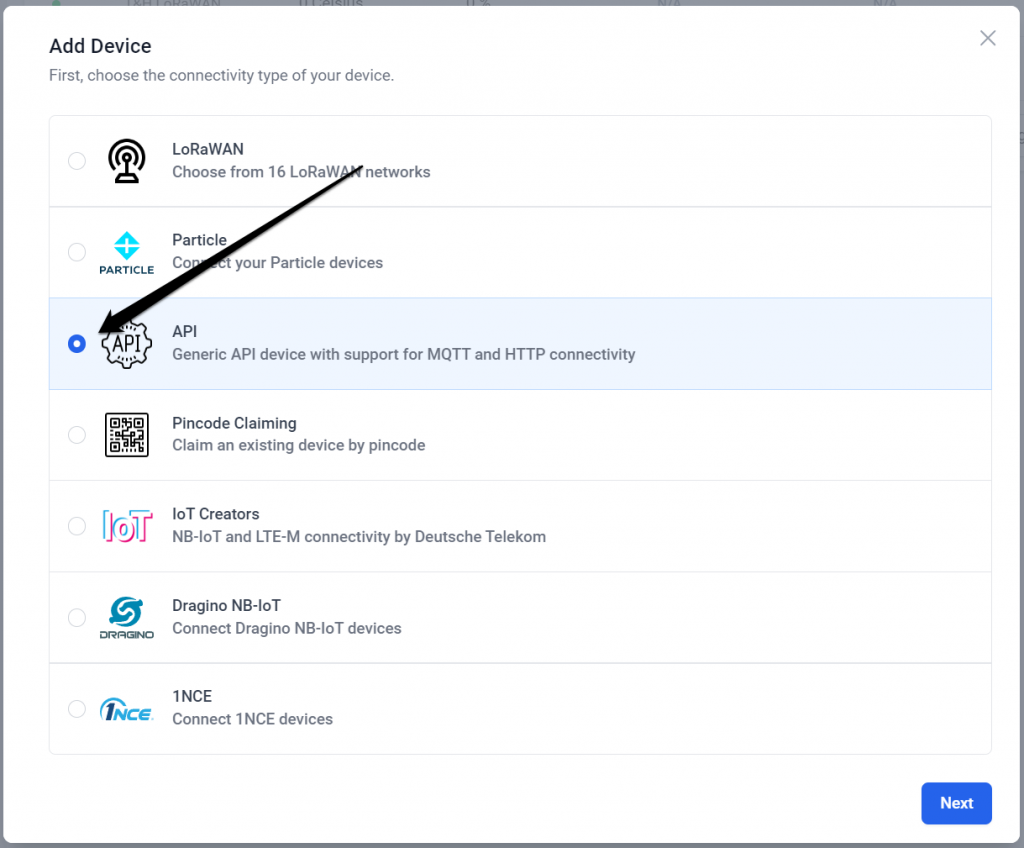
Log in and add a new device. This is required in order to get the data from the HiveMQTT broker, although the actual device sending the data will be the Sensor via the Gateway.
The type of device to select in this particular example is “API” and go to the next step.
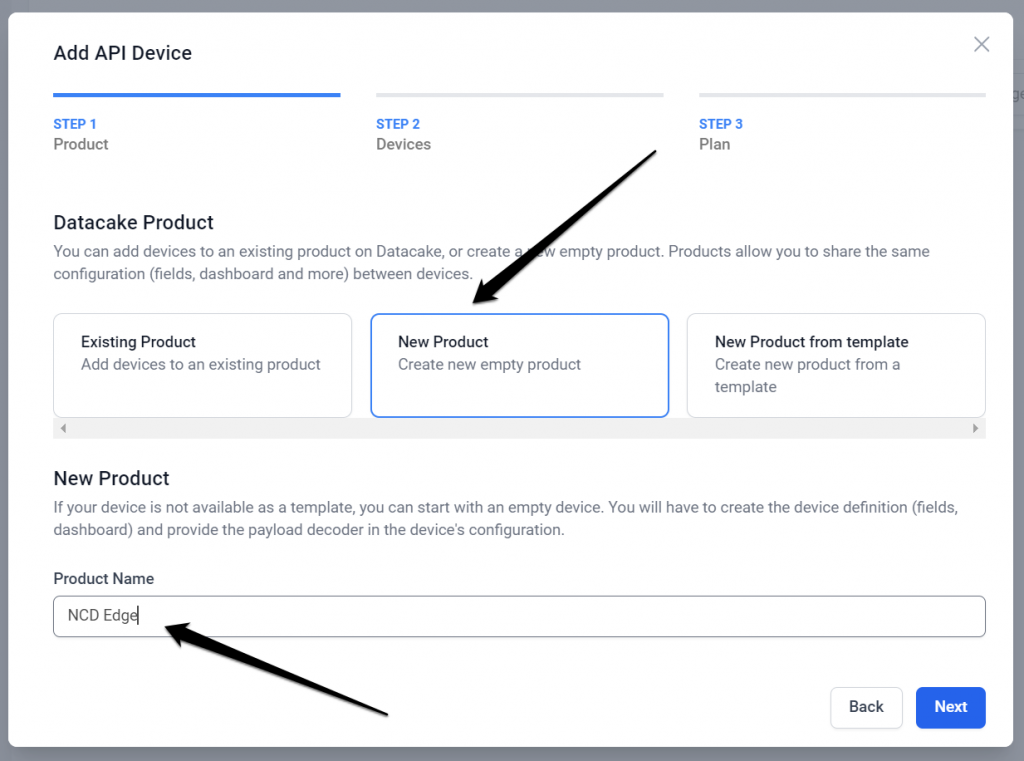
Select the “New Product” option, give it a name and go to the next step.
Note: We are naming it NCD Edge as we are using the Edge Gateway, which can easily be used to relay data from all NCD sensors. Thus, this tutorial can be updated to work with other sensors as well.
You can leave the next screen with its default values and proceed to the last one where you select your payment plan. Note that in order to use the MQTT functionality of DataCake you can’t go with the Free plan.
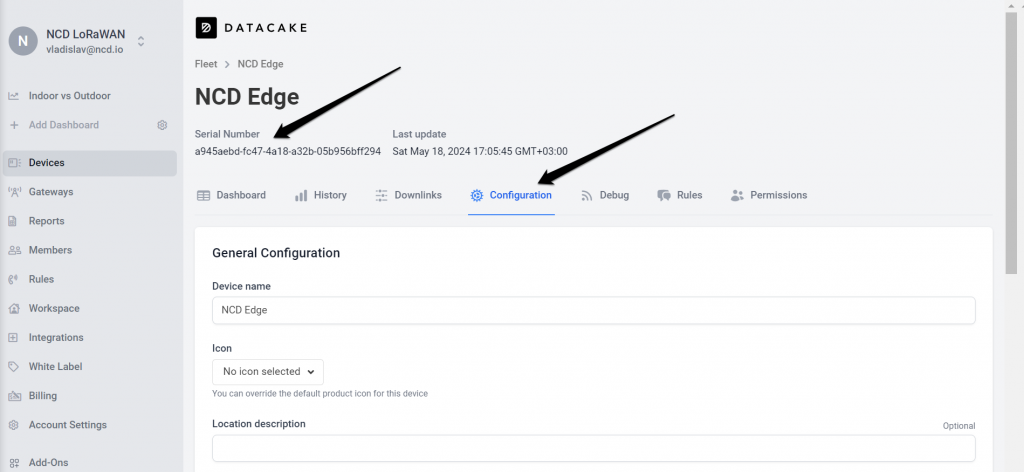
Now that you have your device create it will pop up in the table, click on it and lets start configuring it.
Go to the “Configuration” tab and note the Serial Number up top, you will need it for the Payload Decoder.
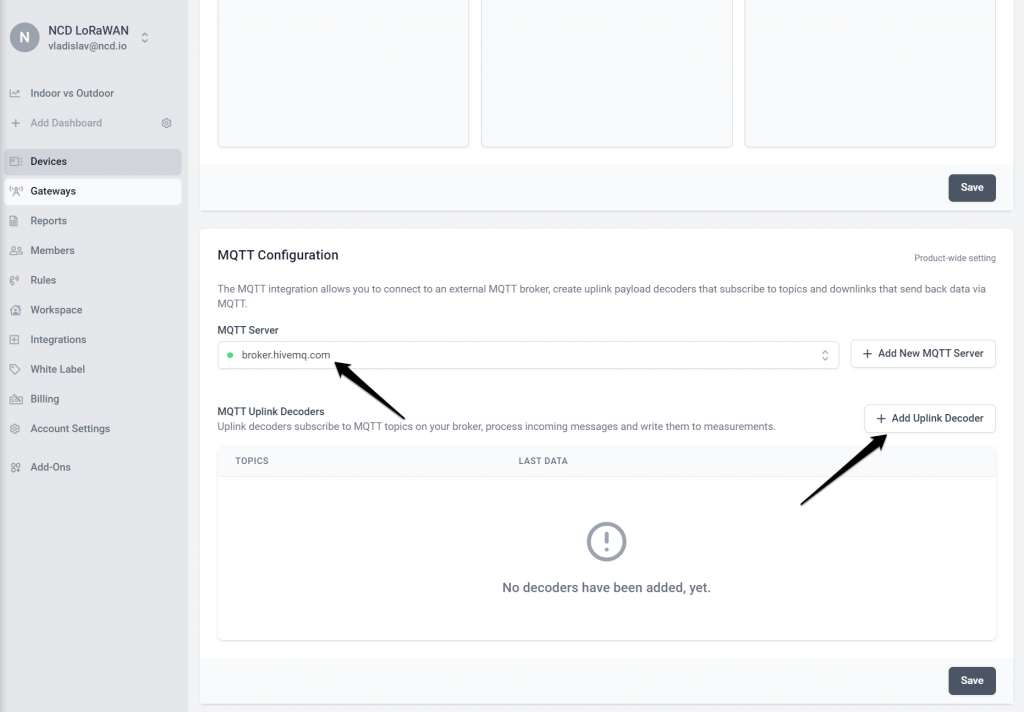
Scroll down to the MQTT Configuration section and “Add New MQTT Server.
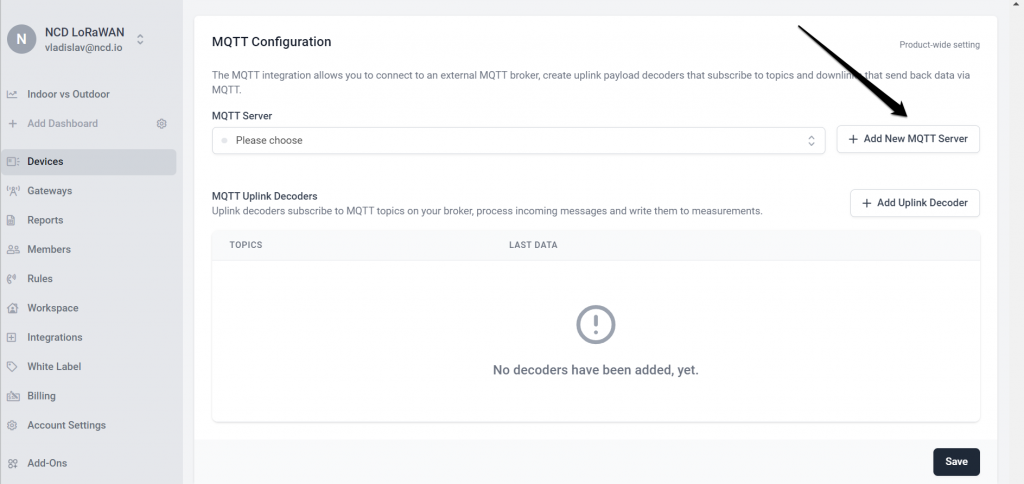
Enter the address of the HiveMQTT Broker (the same we used in Node-RED) into the Hostname field, leave the rest with the default values and finalize.
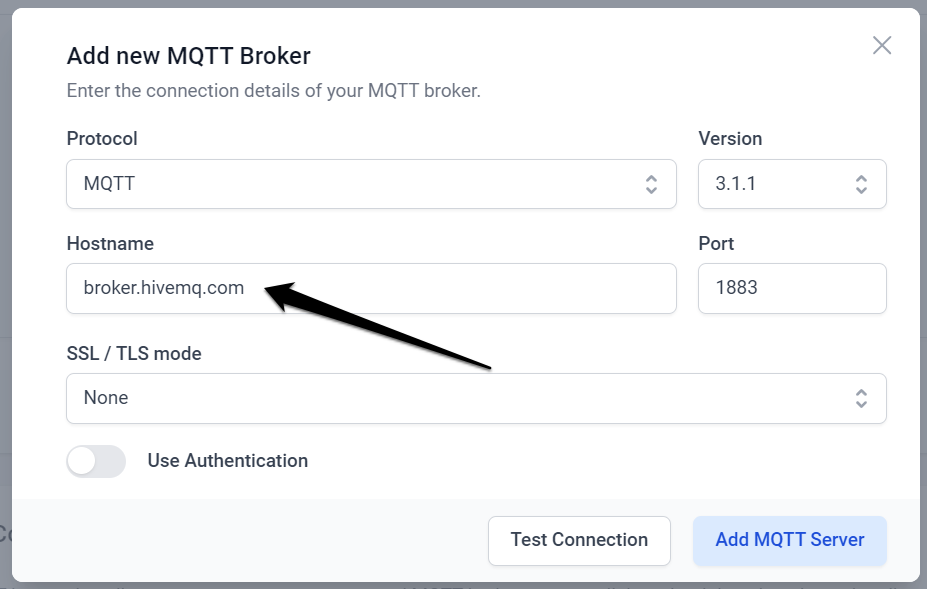
You should see your new MQTT server appear in the field (a green dot in front the name indicated the connection is good).
Now we need to add a decoder for the particular payload of the Machine Uptime Sensor.
Click on the Add Uplink Decoder button and lets proceed.
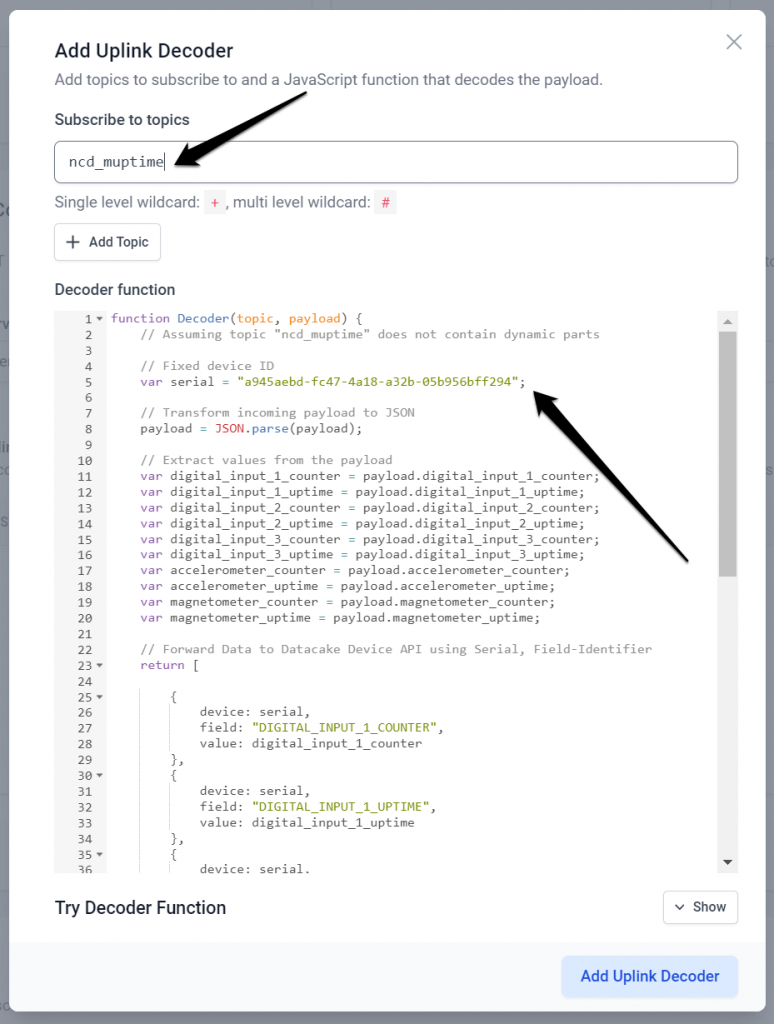
You need to replace the default example with the code below. And also Subscribe to the right topic (ncd_muptime) for this example.
Note: In the example code below the “var serial” variable contains the device ID (you need this for DataCake to properly process the data). This is for our example, you will have a different value (the one we asked you to note in the beginning of the tutorial). When you import the decoder, make sure to replace this value with yours.
					function Decoder(topic, payload) {
    // Assuming topic "ncd_muptime" does not contain dynamic parts

    // Fixed device ID
    var serial = "a945aebd-fc47-4a18-a32b-05b956bff294";

    // Transform incoming payload to JSON
    payload = JSON.parse(payload);

    // Extract values from the payload
    var digital_input_1_counter = payload.digital_input_1_counter;
    var digital_input_1_uptime = payload.digital_input_1_uptime;
    var digital_input_2_counter = payload.digital_input_2_counter;
    var digital_input_2_uptime = payload.digital_input_2_uptime;
    var digital_input_3_counter = payload.digital_input_3_counter;
    var digital_input_3_uptime = payload.digital_input_3_uptime;
    var accelerometer_counter = payload.accelerometer_counter;
    var accelerometer_uptime = payload.accelerometer_uptime;
    var magnetometer_counter = payload.magnetometer_counter;
    var magnetometer_uptime = payload.magnetometer_uptime;

    // Forward Data to Datacake Device API using Serial, Field-Identifier
    return [

        {
            device: serial,
            field: "DIGITAL_INPUT_1_COUNTER",
            value: digital_input_1_counter
        },
        {
            device: serial,
            field: "DIGITAL_INPUT_1_UPTIME",
            value: digital_input_1_uptime
        },
        {
            device: serial,
            field: "DIGITAL_INPUT_2_COUNTER",
            value: digital_input_2_counter
        },
        {
            device: serial,
            field: "DIGITAL_INPUT_2_UPTIME",
            value: digital_input_2_uptime
        },
        {
            device: serial,
            field: "DIGITAL_INPUT_3_COUNTER",
            value: digital_input_3_counter
        },
        {
            device: serial,
            field: "DIGITAL_INPUT_3_UPTIME",
            value: digital_input_3_uptime
        },
        {
            device: serial,
            field: "ACCELEROMETER_COUNTER",
            value: accelerometer_counter
        },
        {
            device: serial,
            field: "ACCELEROMETER_UPTIME",
            value: accelerometer_uptime
        },
        {
            device: serial,
            field: "MAGNETOMETER_COUNTER",
            value: magnetometer_counter
        },
        {
            device: serial,
            field: "MAGNETOMETER_UPTIME",
            value: magnetometer_uptime
        }
    ];
}
Your Uplink decoder should look similar to the image below:
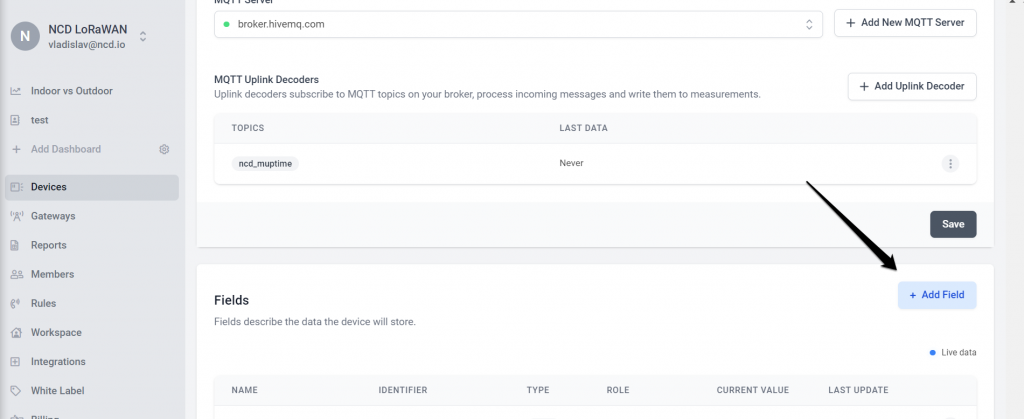
The last part of the configuration is to add the appropriate field to represent the sensor variables to be store in DataCake.
Each has to match one of the variables in the payload (it has the following structure, with example values):
| {“digital_input_1_counter”:56,”digital_input_1_uptime”:100,”digital_input_2_counter”:48,”digital_input_2_uptime”:106,”digital_input_3_counter”:67,”digital_input_3_uptime”:81,”accelerometer_counter”:55,”accelerometer_uptime”:79,”magnetometer_counter”:60,”magnetometer_uptime”:84} |
Thus you need to add them one after the other. We are going to give example with the 1st one, the rest are added in the same manner.
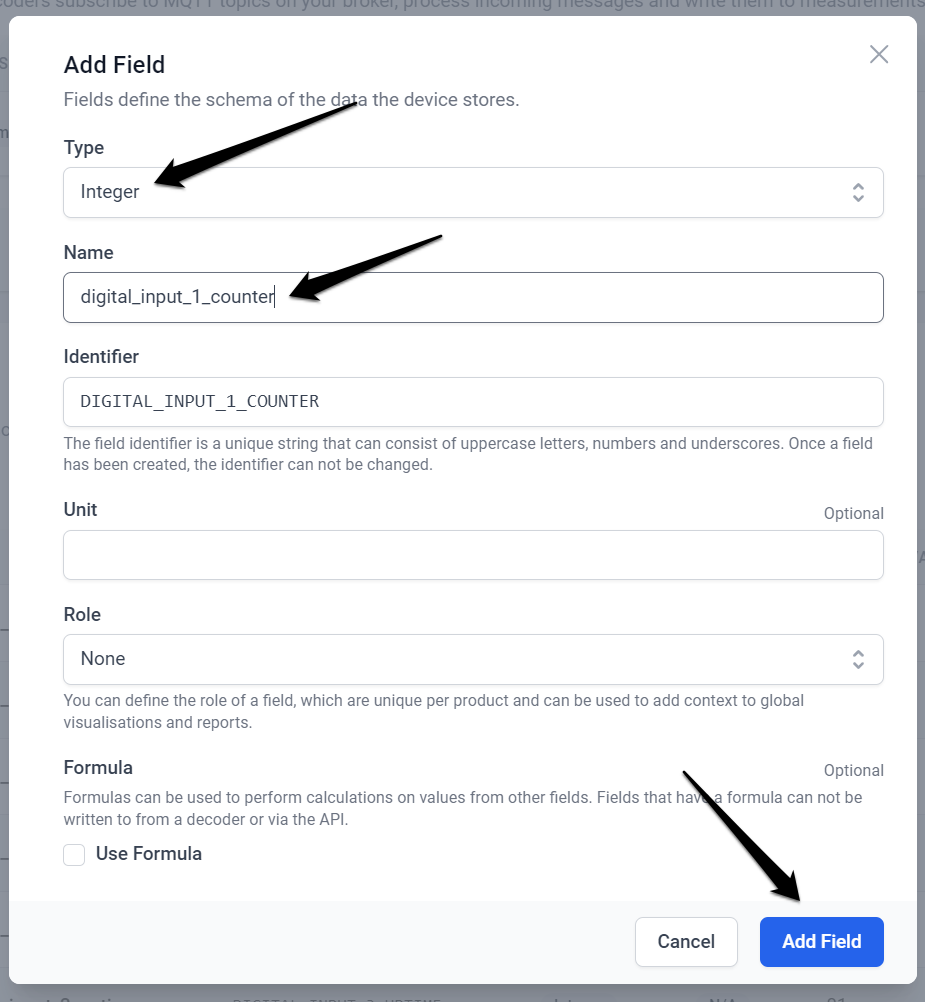
Click on the “Add Field” button (it is located after the Decoder Section):
Chose the Type to be “Integer” and enter the Name as per the payload above, in this case:
digital_input_1_counter
The Identifier will be populated automatically, leave the rest with the default values and and press the “Add Field” button.
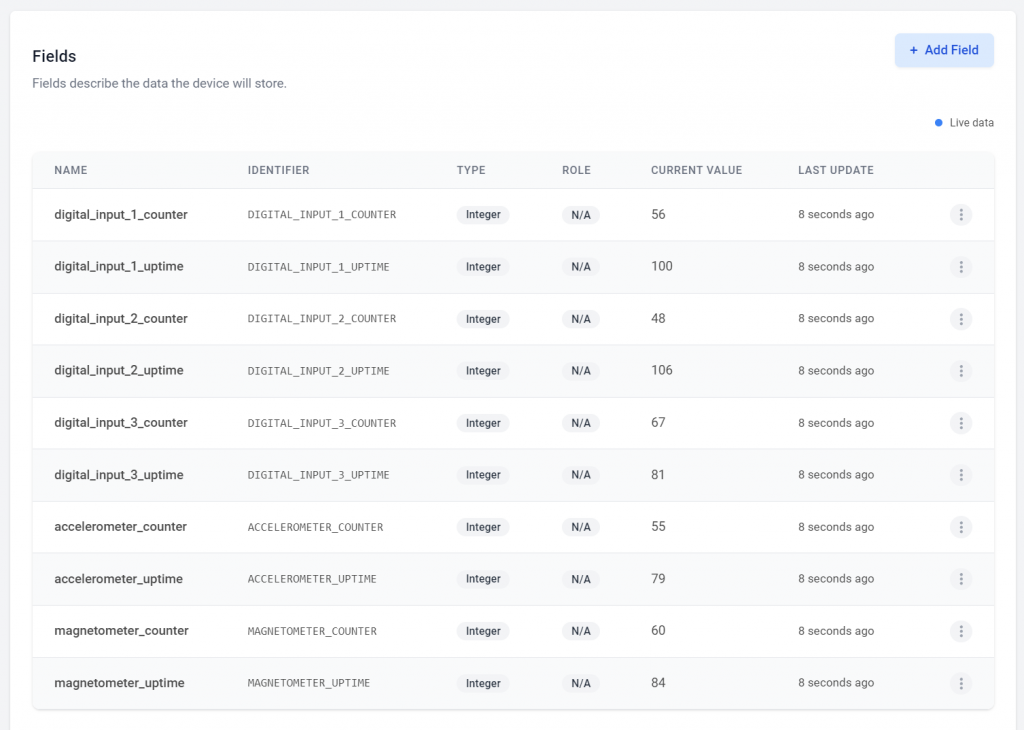
Your new field will pop up in the table, do the same for the rest (you can skip some if you decide you don’t need this particular data).
A complete list would look something like this:
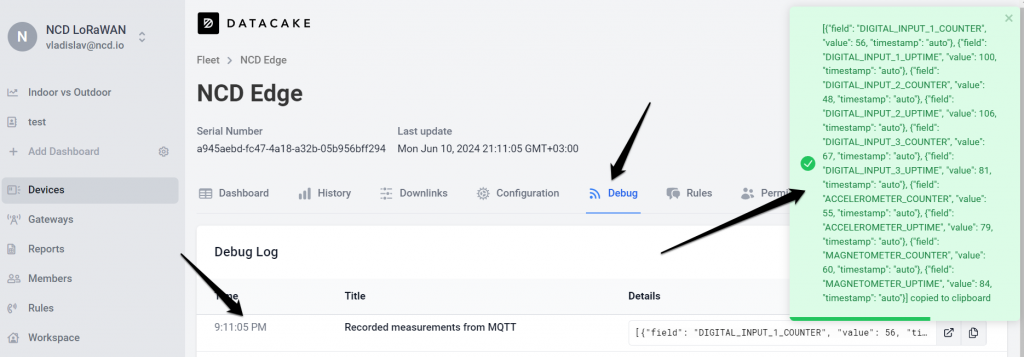
If you have properly configured the decode and the topic and fields you should be able to see the data payload being properly processed if you go to the “Debug” tab:
Visualizing the Data (Dashboard)
We are going to make things really simple for you and provide you with a ready to use Dashboard presenting all the measured metrics. If you want you can modify it in any way you like, but it is very complete and is a good start.
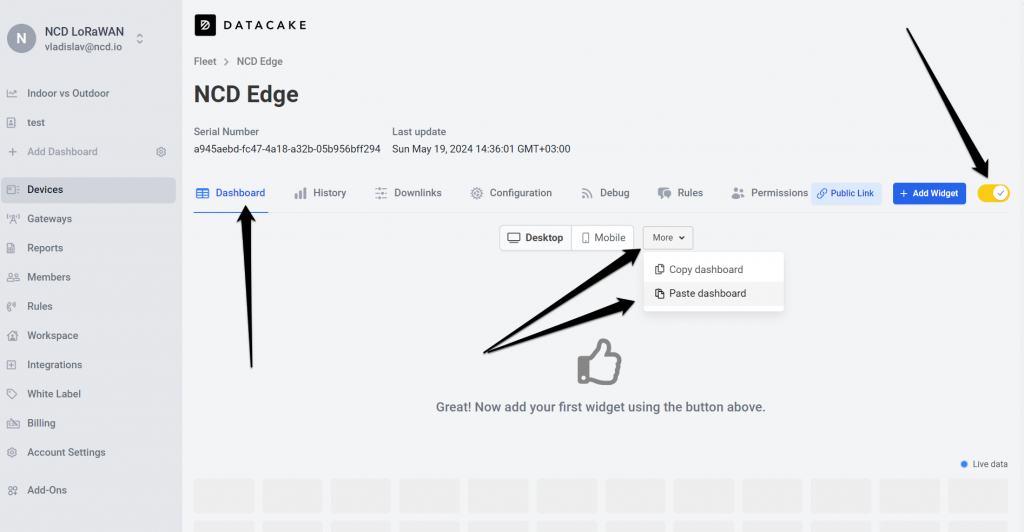
You simply need to import it. Go to the Dashboard section, Flip the switch to the right of the menus and this will let you edit your dashboard (this brings the Dasboard into Editing mode, any changes you implement need to be applies by flipping the switch again to Live Data mode).
Press on the “More” button and choose “Paste dashboard”:
Copy the code from the Code box below and paste it in the DataCake window:
eyJ3aWRnZXRzIjp7IjE0Y2ExZThkLWQzMmQtNDg0Ni04NTc5LTFiM2MxMTc3MTk3ZiI6eyJtZXRhIjp7ImZpZWxkIjp7ImRldmljZSI6IjliNDUxMzM1LTNlYjUtNGVhNS1hYmQ4LWMzNGYyYmQ0YjdlYiIsImZpZWxkTmFtZSI6IkRJR0lUQUxfSU5QVVRfMV9DT1VOVEVSIiwiZmllbGRUeXBlIjoiSU5UIn0sInRpdGxlIjp7ImRlIjoiZGlnaXRhbF9pbnB1dF8xX2NvdW50ZXIiLCJlbiI6IkRpZ2l0YWwgSW5wdXQgMSBDb3VudGVyIn0sImZvbnRTaXplIjo0MCwiZ2F1Z2VUeXBlIjoibm9uZSIsInNob3dEZWdyZWUiOmZhbHNlLCJoYXNBbmltYXRpb24iOmZhbHNlLCJkZWNpbWFsUGxhY2VzIjoyLCJoaWRlQmFja2dyb3VuZCI6ZmFsc2UsImhpZGVMYXN0VXBkYXRlIjpmYWxzZSwidmVydGljYWxEaXJlY3Rpb24iOiJhc2NlbmRpbmciLCJ0aW1lcmFuZ2VPcGVyYXRpb24iOnsiZW5kIjoiIiwib3RoZXIiOmZhbHNlLCJzdGFydCI6IiIsIm9wZXJhdG9yIjoiIiwidGltZXpvbmUiOiIifSwiaXNBYmJyZXZpYXRlZE51bWJlciI6ZmFsc2UsImlzVGV4dENvbG9yU3RhdGVCYXNlZCI6ZmFsc2V9LCJ3aWRnZXQiOiJWYWx1ZSIsImxheW91dHMiOnsibGciOnsiaCI6MywiaSI6IjE0Y2ExZThkLWQzMmQtNDg0Ni04NTc5LTFiM2MxMTc3MTk3ZiIsInciOjIsIngiOjIsInkiOjB9fX0sIjFlZTNhNjNhLWYwNmYtNDhiNS04MDc2LWU3MDMxYTQ5ODYyMSI6eyJtZXRhIjp7ImZpZWxkIjp7ImRldmljZSI6IjliNDUxMzM1LTNlYjUtNGVhNS1hYmQ4LWMzNGYyYmQ0YjdlYiIsImZpZWxkTmFtZSI6IkFDQ0VMRVJPTUVURVJfQ09VTlRFUiIsImZpZWxkVHlwZSI6IkZMT0FUIn0sInRpdGxlIjp7ImVuIjoiQWNjZWxlcm9tZXRlciBDb3VudGVyIn0sImZvbnRTaXplIjo0MCwiZ2F1Z2VUeXBlIjoibm9uZSIsInNob3dEZWdyZWUiOmZhbHNlLCJoYXNBbmltYXRpb24iOmZhbHNlLCJkZWNpbWFsUGxhY2VzIjoiMCIsImhpZGVCYWNrZ3JvdW5kIjpmYWxzZSwiaGlkZUxhc3RVcGRhdGUiOmZhbHNlLCJ2ZXJ0aWNhbERpcmVjdGlvbiI6ImFzY2VuZGluZyIsInRpbWVyYW5nZU9wZXJhdGlvbiI6eyJlbmQiOiIiLCJvdGhlciI6ZmFsc2UsInN0YXJ0IjoiIiwib3BlcmF0b3IiOiIiLCJ0aW1lem9uZSI6IiJ9LCJpc0FiYnJldmlhdGVkTnVtYmVyIjpmYWxzZSwiaXNUZXh0Q29sb3JTdGF0ZUJhc2VkIjpmYWxzZX0sIndpZGdldCI6IlZhbHVlIiwibGF5b3V0cyI6eyJsZyI6eyJoIjozLCJpIjoiMWVlM2E2M2EtZjA2Zi00OGI1LTgwNzYtZTcwMzFhNDk4NjIxIiwidyI6MiwieCI6OCwieSI6MH19fSwiNDFkMjQxOTMtMDJlMi00NGI2LWE4MDktZjkwZWIxYWRiY2E1Ijp7Im1ldGEiOnsiZmllbGQiOnsiZGV2aWNlIjoiOWI0NTEzMzUtM2ViNS00ZWE1LWFiZDgtYzM0ZjJiZDRiN2ViIiwiZmllbGROYW1lIjoiRElHSVRBTF9JTlBVVF8zX1VQVElNRSIsImZpZWxkVHlwZSI6IklOVCJ9LCJ0aXRsZSI6eyJlbiI6IkRpZ2l0YWwgSW5wdXQgMyBDb3VudGVyIn0sImZvbnRTaXplIjo0MCwiZ2F1Z2VUeXBlIjoibm9uZSIsInNob3dEZWdyZWUiOmZhbHNlLCJoYXNBbmltYXRpb24iOmZhbHNlLCJkZWNpbWFsUGxhY2VzIjoyLCJoaWRlQmFja2dyb3VuZCI6ZmFsc2UsImhpZGVMYXN0VXBkYXRlIjpmYWxzZSwidmVydGljYWxEaXJlY3Rpb24iOiJhc2NlbmRpbmciLCJ0aW1lcmFuZ2VPcGVyYXRpb24iOnsiZW5kIjoiIiwib3RoZXIiOmZhbHNlLCJzdGFydCI6IiIsIm9wZXJhdG9yIjoiIiwidGltZXpvbmUiOiIifSwiaXNBYmJyZXZpYXRlZE51bWJlciI6ZmFsc2UsImlzVGV4dENvbG9yU3RhdGVCYXNlZCI6ZmFsc2V9LCJ3aWRnZXQiOiJWYWx1ZSIsImxheW91dHMiOnsibGciOnsiaCI6MywiaSI6IjQxZDI0MTkzLTAyZTItNDRiNi1hODA5LWY5MGViMWFkYmNhNSIsInciOjIsIngiOjYsInkiOjN9fX0sIjRkNjRmNTNmLTM2N2EtNGMyNS05NTkwLTM2MzE3Yzk3MmYzMSI6eyJtZXRhIjp7ImZpZWxkIjp7ImRldmljZSI6IjliNDUxMzM1LTNlYjUtNGVhNS1hYmQ4LWMzNGYyYmQ0YjdlYiIsImZpZWxkTmFtZSI6Ik1BR05FVE9NRVRFUl9VUFRJTUUiLCJmaWVsZFR5cGUiOiJJTlQifSwidGl0bGUiOnsiZW4iOiJNYWduZXRvbWV0ZXIgVXB0aW1lIn0sImZvbnRTaXplIjo0MCwiZ2F1Z2VUeXBlIjoibm9uZSIsInNob3dEZWdyZWUiOmZhbHNlLCJoYXNBbmltYXRpb24iOmZhbHNlLCJkZWNpbWFsUGxhY2VzIjoyLCJoaWRlQmFja2dyb3VuZCI6ZmFsc2UsImhpZGVMYXN0VXBkYXRlIjpmYWxzZSwidmVydGljYWxEaXJlY3Rpb24iOiJhc2NlbmRpbmciLCJ0aW1lcmFuZ2VPcGVyYXRpb24iOnsiZW5kIjoiIiwib3RoZXIiOmZhbHNlLCJzdGFydCI6IiIsIm9wZXJhdG9yIjoiIiwidGltZXpvbmUiOiIifSwiaXNBYmJyZXZpYXRlZE51bWJlciI6ZmFsc2UsImlzVGV4dENvbG9yU3RhdGVCYXNlZCI6ZmFsc2V9LCJ3aWRnZXQiOiJWYWx1ZSIsImxheW91dHMiOnsibGciOnsiaCI6MywiaSI6IjRkNjRmNTNmLTM2N2EtNGMyNS05NTkwLTM2MzE3Yzk3MmYzMSIsInciOjIsIngiOjEwLCJ5IjozfX19LCI1ZmYyY2I0Ny00MDAzLTQ4YTUtYTAzYS04ZmEwOGIxOTc5ODMiOnsibWV0YSI6eyJzaXplIjoyLCJ0aXRsZSI6eyJkZSI6IiIsImVuIjoiTkNEIE1hY2hpbmUgVXB0aW1lIE1vbml0b3IifSwiY2VudGVyIjpmYWxzZSwidGludENvbG9yIjoiIzQyOTllMSIsImhpZGVCYWNrZ3JvdW5kIjpmYWxzZX0sIndpZGdldCI6IkhlYWRsaW5lIiwibGF5b3V0cyI6eyJsZyI6eyJoIjo2LCJpIjoiNWZmMmNiNDctNDAwMy00OGE1LWEwM2EtOGZhMDhiMTk3OTgzIiwidyI6MiwieCI6MCwieSI6MH19fSwiNzhjYmU4ZmMtM2Y1MS00N2JkLThkY2YtMDBiY2U1NTMxNTk5Ijp7Im1ldGEiOnsiZmllbGQiOnsiZGV2aWNlIjoiOWI0NTEzMzUtM2ViNS00ZWE1LWFiZDgtYzM0ZjJiZDRiN2ViIiwiZmllbGROYW1lIjoiRElHSVRBTF9JTlBVVF8yX0NPVU5URVIiLCJmaWVsZFR5cGUiOiJJTlQifSwidGl0bGUiOnsiZW4iOiJEaWdpdGFsIElucHV0IDIgQ291bnRlciJ9LCJmb250U2l6ZSI6NDAsImdhdWdlVHlwZSI6Im5vbmUiLCJzaG93RGVncmVlIjpmYWxzZSwiaGFzQW5pbWF0aW9uIjpmYWxzZSwiZGVjaW1hbFBsYWNlcyI6MiwiaGlkZUJhY2tncm91bmQiOmZhbHNlLCJoaWRlTGFzdFVwZGF0ZSI6ZmFsc2UsInZlcnRpY2FsRGlyZWN0aW9uIjoiYXNjZW5kaW5nIiwidGltZXJhbmdlT3BlcmF0aW9uIjp7ImVuZCI6IiIsIm90aGVyIjpmYWxzZSwic3RhcnQiOiIiLCJvcGVyYXRvciI6IiIsInRpbWV6b25lIjoiIn0sImlzQWJicmV2aWF0ZWROdW1iZXIiOmZhbHNlLCJpc1RleHRDb2xvclN0YXRlQmFzZWQiOmZhbHNlfSwid2lkZ2V0IjoiVmFsdWUiLCJsYXlvdXRzIjp7ImxnIjp7ImgiOjMsImkiOiI3OGNiZThmYy0zZjUxLTQ3YmQtOGRjZi0wMGJjZTU1MzE1OTkiLCJ3IjoyLCJ4Ijo0LCJ5IjowfX19LCI3Yzg1ZTM2NS1jZDg4LTQwMGMtYWQ1MC05MDc2OGI3MDY2OTgiOnsibWV0YSI6eyJmaWVsZCI6eyJkZXZpY2UiOiI5YjQ1MTMzNS0zZWI1LTRlYTUtYWJkOC1jMzRmMmJkNGI3ZWIiLCJmaWVsZE5hbWUiOiJBQ0NFTEVST01FVEVSX1VQVElNRSIsImZpZWxkVHlwZSI6IklOVCJ9LCJ0aXRsZSI6eyJlbiI6Ik1hZ25ldG9tZXRlciBVcHRpbWUifSwiZm9udFNpemUiOjQwLCJnYXVnZVR5cGUiOiJub25lIiwic2hvd0RlZ3JlZSI6ZmFsc2UsImhhc0FuaW1hdGlvbiI6ZmFsc2UsImRlY2ltYWxQbGFjZXMiOjIsImhpZGVCYWNrZ3JvdW5kIjpmYWxzZSwiaGlkZUxhc3RVcGRhdGUiOmZhbHNlLCJ2ZXJ0aWNhbERpcmVjdGlvbiI6ImFzY2VuZGluZyIsInRpbWVyYW5nZU9wZXJhdGlvbiI6eyJlbmQiOiIiLCJvdGhlciI6ZmFsc2UsInN0YXJ0IjoiIiwib3BlcmF0b3IiOiIiLCJ0aW1lem9uZSI6IiJ9LCJpc0FiYnJldmlhdGVkTnVtYmVyIjpmYWxzZSwiaXNUZXh0Q29sb3JTdGF0ZUJhc2VkIjpmYWxzZX0sIndpZGdldCI6IlZhbHVlIiwibGF5b3V0cyI6eyJsZyI6eyJoIjozLCJpIjoiN2M4NWUzNjUtY2Q4OC00MDBjLWFkNTAtOTA3NjhiNzA2Njk4IiwidyI6MiwieCI6OCwieSI6M319fSwiOGEyOTVlNmEtNTBiMC00Y2YwLTk0ZDItNjUyODcwMGZiZmM3Ijp7Im1ldGEiOnsiZmllbGQiOnsiZGV2aWNlIjoiOWI0NTEzMzUtM2ViNS00ZWE1LWFiZDgtYzM0ZjJiZDRiN2ViIiwiZmllbGROYW1lIjoiTUFHTkVUT01FVEVSX0NPVU5URVIiLCJmaWVsZFR5cGUiOiJGTE9BVCJ9LCJ0aXRsZSI6eyJlbiI6Ik1hZ25ldG9tZXRlciBDb3VudGVyIn0sImZvbnRTaXplIjo0MCwiZ2F1Z2VUeXBlIjoibm9uZSIsInNob3dEZWdyZWUiOmZhbHNlLCJoYXNBbmltYXRpb24iOmZhbHNlLCJkZWNpbWFsUGxhY2VzIjoiMCIsImhpZGVCYWNrZ3JvdW5kIjpmYWxzZSwiaGlkZUxhc3RVcGRhdGUiOmZhbHNlLCJ2ZXJ0aWNhbERpcmVjdGlvbiI6ImFzY2VuZGluZyIsInRpbWVyYW5nZU9wZXJhdGlvbiI6eyJlbmQiOiIiLCJvdGhlciI6ZmFsc2UsInN0YXJ0IjoiIiwib3BlcmF0b3IiOiIiLCJ0aW1lem9uZSI6IiJ9LCJpc0FiYnJldmlhdGVkTnVtYmVyIjpmYWxzZSwiaXNUZXh0Q29sb3JTdGF0ZUJhc2VkIjpmYWxzZX0sIndpZGdldCI6IlZhbHVlIiwibGF5b3V0cyI6eyJsZyI6eyJoIjozLCJpIjoiOGEyOTVlNmEtNTBiMC00Y2YwLTk0ZDItNjUyODcwMGZiZmM3IiwidyI6MiwieCI6MTAsInkiOjB9fX0sImFmMjNiZWQxLWYyMTEtNDhhNy04N2IxLWQ3MTAxY2I4YmVlMSI6eyJtZXRhIjp7ImZpZWxkIjp7ImRldmljZSI6IjliNDUxMzM1LTNlYjUtNGVhNS1hYmQ4LWMzNGYyYmQ0YjdlYiIsImZpZWxkTmFtZSI6IkRJR0lUQUxfSU5QVVRfMV9VUFRJTUUiLCJmaWVsZFR5cGUiOiJJTlQifSwidGl0bGUiOnsiZGUiOiIiLCJlbiI6IkRpZ2l0YWwgSW5wdXQgMSBVcHRpbWUifSwiZm9udFNpemUiOjQwLCJnYXVnZVR5cGUiOiJub25lIiwic2hvd0RlZ3JlZSI6ZmFsc2UsImhhc0FuaW1hdGlvbiI6ZmFsc2UsImRlY2ltYWxQbGFjZXMiOjIsImhpZGVCYWNrZ3JvdW5kIjpmYWxzZSwiaGlkZUxhc3RVcGRhdGUiOmZhbHNlLCJ2ZXJ0aWNhbERpcmVjdGlvbiI6ImFzY2VuZGluZyIsInRpbWVyYW5nZU9wZXJhdGlvbiI6eyJlbmQiOiIiLCJvdGhlciI6ZmFsc2UsInN0YXJ0IjoiIiwib3BlcmF0b3IiOiIiLCJ0aW1lem9uZSI6IiJ9LCJpc0FiYnJldmlhdGVkTnVtYmVyIjpmYWxzZSwiaXNUZXh0Q29sb3JTdGF0ZUJhc2VkIjpmYWxzZX0sIndpZGdldCI6IlZhbHVlIiwibGF5b3V0cyI6eyJsZyI6eyJoIjozLCJpIjoiYWYyM2JlZDEtZjIxMS00OGE3LTg3YjEtZDcxMDFjYjhiZWUxIiwidyI6MiwieCI6MiwieSI6M319fSwiY2YyZmYzNDQtNzVhOS00M2EwLThmN2ItODgzODBmOWNjNzIzIjp7Im1ldGEiOnsiZmllbGQiOnsiZGV2aWNlIjoiOWI0NTEzMzUtM2ViNS00ZWE1LWFiZDgtYzM0ZjJiZDRiN2ViIiwiZmllbGROYW1lIjoiRElHSVRBTF9JTlBVVF8yX1VQVElNRSIsImZpZWxkVHlwZSI6IklOVCJ9LCJ0aXRsZSI6eyJlbiI6IkRpZ2l0YWwgSW5wdXQgMiBVcHRpbWUifSwiZm9udFNpemUiOjQwLCJnYXVnZVR5cGUiOiJub25lIiwic2hvd0RlZ3JlZSI6ZmFsc2UsImhhc0FuaW1hdGlvbiI6ZmFsc2UsImRlY2ltYWxQbGFjZXMiOjIsImhpZGVCYWNrZ3JvdW5kIjpmYWxzZSwiaGlkZUxhc3RVcGRhdGUiOmZhbHNlLCJ2ZXJ0aWNhbERpcmVjdGlvbiI6ImFzY2VuZGluZyIsInRpbWVyYW5nZU9wZXJhdGlvbiI6eyJlbmQiOiIiLCJvdGhlciI6ZmFsc2UsInN0YXJ0IjoiIiwib3BlcmF0b3IiOiIiLCJ0aW1lem9uZSI6IiJ9LCJpc0FiYnJldmlhdGVkTnVtYmVyIjpmYWxzZSwiaXNUZXh0Q29sb3JTdGF0ZUJhc2VkIjpmYWxzZX0sIndpZGdldCI6IlZhbHVlIiwibGF5b3V0cyI6eyJsZyI6eyJoIjozLCJpIjoiY2YyZmYzNDQtNzVhOS00M2EwLThmN2ItODgzODBmOWNjNzIzIiwidyI6MiwieCI6NCwieSI6M319fSwiZjA1YmRmMTQtMzI2Ny00NmYyLTk0NGQtMWMyYjY1ZTRkMDcwIjp7Im1ldGEiOnsiZmllbGQiOnsiZGV2aWNlIjoiOWI0NTEzMzUtM2ViNS00ZWE1LWFiZDgtYzM0ZjJiZDRiN2ViIiwiZmllbGROYW1lIjoiRElHSVRBTF9JTlBVVF8zX0NPVU5URVIiLCJmaWVsZFR5cGUiOiJJTlQifSwidGl0bGUiOnsiZW4iOiJEaWdpdGFsIElucHV0IDMgQ291bnRlciJ9LCJmb250U2l6ZSI6NDAsImdhdWdlVHlwZSI6Im5vbmUiLCJzaG93RGVncmVlIjpmYWxzZSwiaGFzQW5pbWF0aW9uIjpmYWxzZSwiZGVjaW1hbFBsYWNlcyI6MiwiaGlkZUJhY2tncm91bmQiOmZhbHNlLCJoaWRlTGFzdFVwZGF0ZSI6ZmFsc2UsInZlcnRpY2FsRGlyZWN0aW9uIjoiYXNjZW5kaW5nIiwidGltZXJhbmdlT3BlcmF0aW9uIjp7ImVuZCI6IiIsIm90aGVyIjpmYWxzZSwic3RhcnQiOiIiLCJvcGVyYXRvciI6IiIsInRpbWV6b25lIjoiIn0sImlzQWJicmV2aWF0ZWROdW1iZXIiOmZhbHNlLCJpc1RleHRDb2xvclN0YXRlQmFzZWQiOmZhbHNlfSwid2lkZ2V0IjoiVmFsdWUiLCJsYXlvdXRzIjp7ImxnIjp7ImgiOjMsImkiOiJmMDViZGYxNC0zMjY3LTQ2ZjItOTQ0ZC0xYzJiNjVlNGQwNzAiLCJ3IjoyLCJ4Ijo2LCJ5IjowfX19fSwiaXNHbG9iYWwiOmZhbHNlfQ==
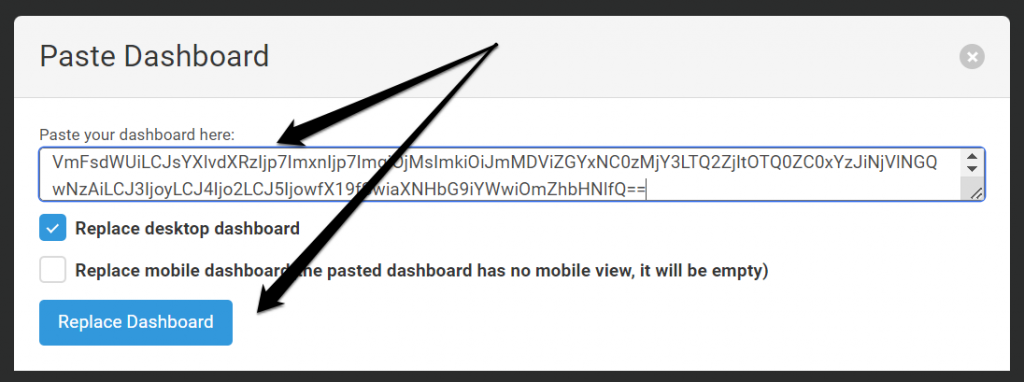
Once you hit the “Replace Dashboard” button the Dashboard will be imported and you should see it coming live (once you flip the aforementioned switch).
This will give you all the metrics the Machine Uptime Monitor sends in real time (together with a time chard for the measured AC current value.
It should looks like the one in the image below:
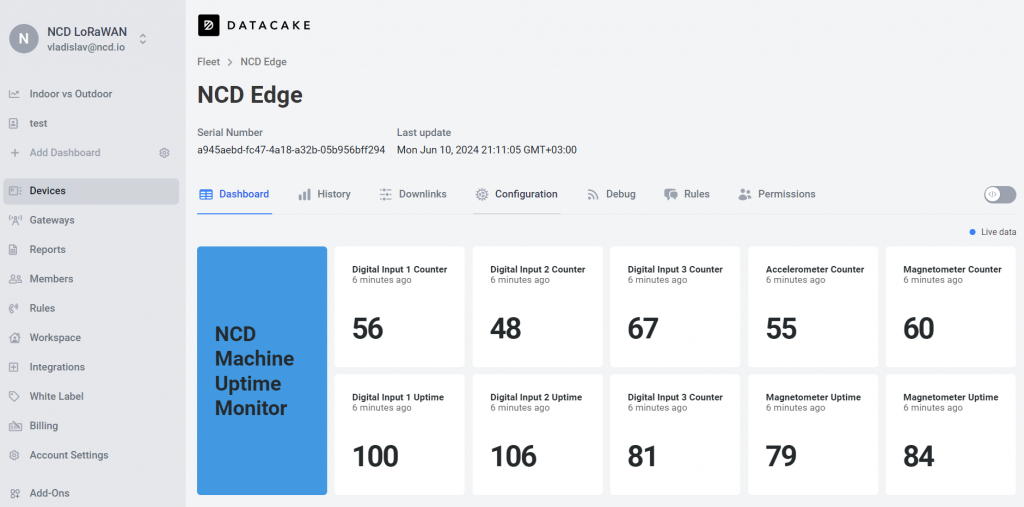
You can now observe your data in real time. Modify it any way you like (as long as you created the proper decoder and fields the complete data will be stored, so you can choose what to display and what not to).
Take a look at an example one at the link below (you can share a public dashboard via DataCake):
https://app.datacake.de/pd/ef7ce5f8-e132-47d9-bc10-95cf57ceb190