

Industrial Wireless Pressure and Temperature Gauge — 1/4″ NPT
Battery-powered wireless pressure and temperature monitoring built on a rugged 316L stainless steel, oil-filled piezoresistive transducer with a 1/4″ NPT process connection. Measures process pressure — plus on-board temperature — and transmits over a long-range wireless mesh to an Atrium IIoT Gateway. Six selectable pressure ranges from 0–20 PSI up to 0–10,000 PSI. SKU PR52-33P.
01Overview
The NCD Industrial Wireless Pressure and Temperature Gauge measures process pressure at a single point and reports it — along with on-board temperature — over a long-range wireless mesh network to an Atrium IIoT Gateway. It is built around a rugged, media-isolated piezoresistive transducer: a 316L stainless steel corrugated diaphragm with oil-filled construction, terminated in a standard 1/4″ NPT male fitting. That construction lets a single wetted port handle gas, liquid, or vapor, making the sensor a fit for line and tank pressure, hydraulic and pneumatic systems, pumps and compressors, liquid level by head pressure, and general process-pressure monitoring.
The pressure range is selected at time of order to suit your application (see the options table in Section 2). Readings are sampled at a user-defined interval and transmitted wirelessly, with the transducer connected to the wireless enclosure by a short shielded cable so the electronics can be mounted away from the process tap.
The sensor ships with one of three wireless communication modules. Choose the frequency band that matches your gateway and region — the sensor core, firmware, and Atrium integration are identical across all three. The 900 MHz and 868 MHz options run on NCD’s sub-GHz wireless mesh network, which cuts through industrial noise and interference for secure, long-range communication.
| Wireless Module | Region | Line-of-Sight Range | Indoor Range |
|---|---|---|---|
| 900 MHz | North & South America | ~2 miles | ~1,000 ft |
| 868 MHz | Europe | ~2 miles | ~1,000 ft |
| 2.4 GHz | Worldwide certified | ~1 mile | ~300 ft |
What’s in the Box
- Industrial Wireless Pressure and Temperature Gauge — wireless enclosure with a D-cell (LR20) lithium battery and integrated supercapacitor installed
- 316L stainless steel pressure transducer (1/4″ NPT male) on a shielded cable, per your selected pressure range
- Wireless communication module per your selection (900 MHz, 868 MHz, or 2.4 GHz), with antenna and U.FL-to-RP-SMA pigtail adapter
- On-board antenna connection — optional high-gain antenna and RP-SMA extension cables (1 m / 3 m / 6 m / 9 m) available separately
02Specifications
Full technical specifications for the Industrial Wireless Pressure and Temperature Gauge (SKU PR52-33P). Values are drawn from the product datasheet and user manual; where sources differ, both figures are noted.
| Parameter | Specification |
|---|---|
| Measurement Type | Single-point process pressure (range selected at order) + on-board temperature |
| Pressure Sensing Element | Media-isolated piezoresistive transducer — 316L stainless steel corrugated diaphragm, oil-filled construction |
| Pressure Range (selectable) | 0–20 PSI, 0–100 PSI, 0–500 PSI, 0–1,000 PSI, 0–5,000 PSI, or 0–10,000 PSI (see options table below) |
| Pressure Accuracy | ±0.5% of full span (%FS) — includes offset/span error, nonlinearity, hysteresis, and repeatability |
| Long-Term Stability | ±0.3% FS per year |
| Sensor Response | ~1.5 ms transducer measurement response |
| Media Compatibility | Gas, liquid, or vapor compatible with 316L stainless steel and the oil-filled diaphragm |
| Temperature Measurement Range | −40°C to +85°C (−40°F to +185°F) |
| Temperature Accuracy | ±1.5°C |
| Enclosure Operating Temp | −40°C to 85°C (enclosure / electronics) |
| Wireless Module | Select 900 MHz (North & South America), 868 MHz (Europe), or 2.4 GHz (worldwide) at time of order |
| Line-of-Sight Range | Up to ~2 miles (900/868 MHz); ~1 mile (2.4 GHz) |
| Antenna | On-board (U.FL to RP-SMA pigtail included) — optional high-gain antenna and RP-SMA extension cables available |
| Encryption | 128-bit AES |
| Enclosure Material | Impact-resistant, UV-stabilized polycarbonate with a silicone cover gasket and stainless steel hardware |
| Enclosure Rating | IP65 (NEMA 1, 2, 4, 4X, 12, 13; UL 508) |
| Process Fitting | 1/4″ NPT male (on the stainless transducer) |
| Dimensions (enclosure) | ~3.54″ W × 4.52″ L × 2.16″ H |
| Mounting | Wall-mount tabs or optional magnetic mounting hardware; transducer threads into the process via 1/4″ NPT |
| Power Supply | D-cell (LR20) lithium battery with integrated supercapacitor or external power supply via barrel connector — selectable with the 3-position Battery / Off / External switch (external power supported with battery backup) |
| Battery Life | Up to 5 years — varies with configuration. Estimate for your settings with the battery life calculator |
| Default Transmission Interval | 600 seconds / 10 minutes (configurable via the Delay setting) |
| SKU | PR52-33P |
Pressure Range Options
Select the range at time of order to match your application. Lower ranges give finer resolution for low line pressure; higher ranges cover hydraulic and high-pressure systems. Choose a range whose full span comfortably exceeds your maximum expected pressure — running near the top of the span protects headroom and accuracy. Additional special-order ranges are available — contact NCD.
| Pressure Range | Typical Use |
|---|---|
| 0–20 PSI | Low line/tank pressure, HVAC, pneumatics |
| 0–100 PSI | General process, tank, and line pressure |
| 0–500 PSI | Compressed air, process lines, pump discharge |
| 0–1,000 PSI | Hydraulic systems, higher line pressure |
| 0–5,000 PSI | Heavy hydraulics, high-pressure process |
| 0–10,000 PSI | Very high pressure hydraulic / test systems |
03Prerequisites
Before installing this sensor, make sure you have the following in place.
Hardware Required
- NCD Atrium IIoT Gateway — powered on and connected to your local network
- Industrial Wireless Pressure and Temperature Gauge (this unit)
- A process tap with a 1/4″ NPT (or suitable adapter) fitting to thread the transducer into, plus PTFE thread-sealant tape
- A mounting point for the enclosure (white-box) — a flat wall surface, or a ferrous surface if using the optional magnetic mounting hardware
- A Phillips screwdriver — to open the enclosure lid and switch the sensor on via the internal power switch
Software / Network
- A current version of Atrium running on your gateway
- A computer or mobile device on the same local network as the gateway
- A modern web browser (Chrome recommended)
04Mounting & Installation
Installation has two parts: thread the stainless transducer into the process tap, and mount the wireless enclosure nearby. Keep the transducer within its rated pressure, seal the NPT threads properly, and mount the enclosure so the cable is not strained.
Powering On
-
1
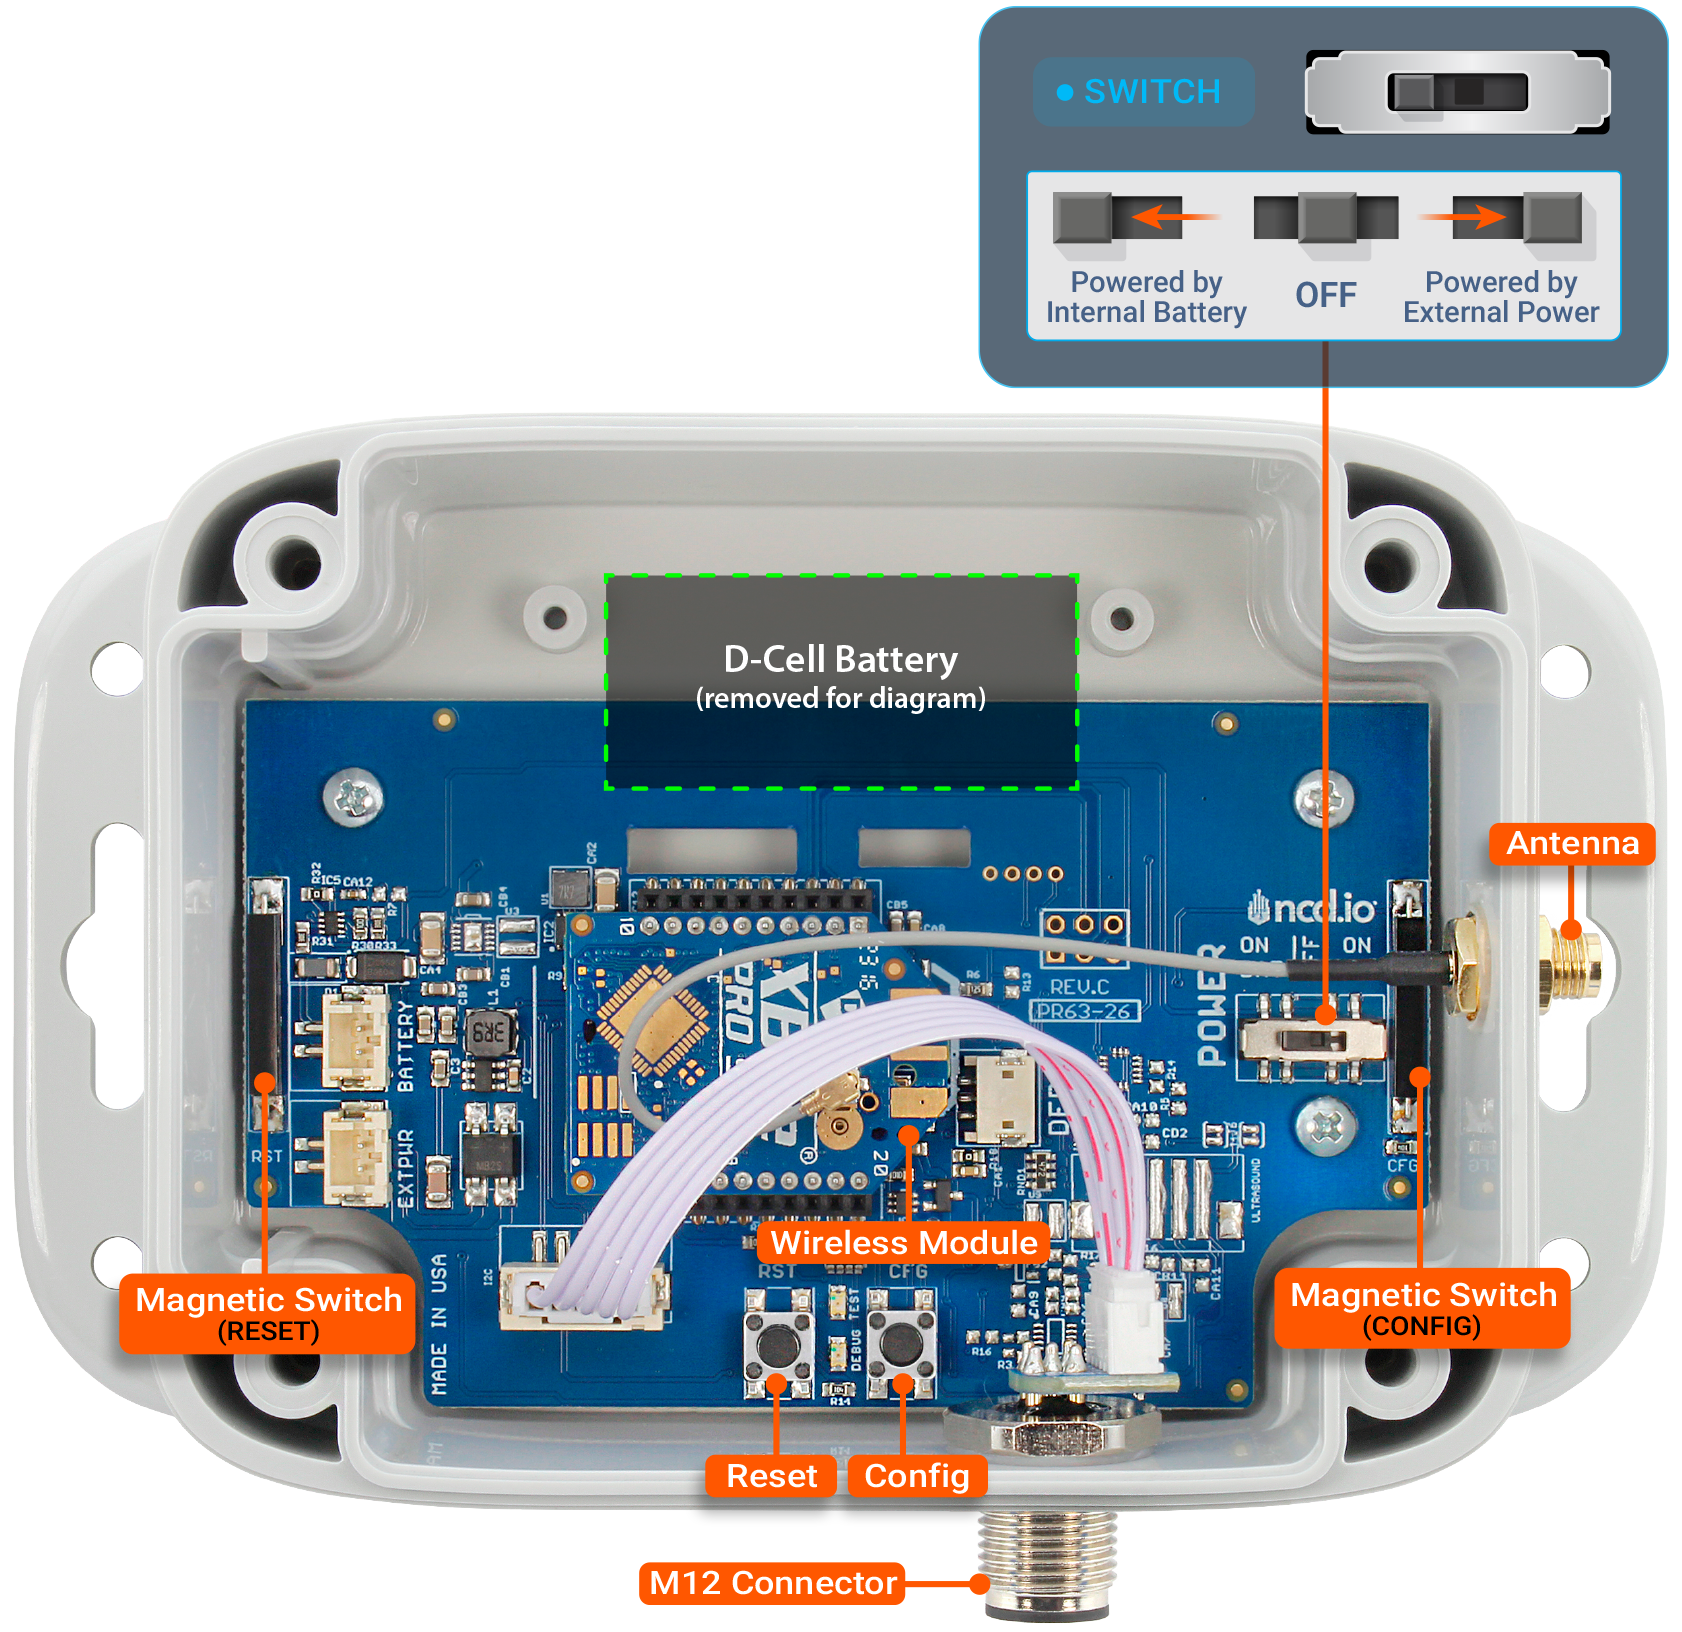
Open the enclosureRemove the four screws on the top of the enclosure and lift the lid to access the PCB, the power switch, the RESET and CFG buttons, and the TEST LED.
-
2
Set the power switchSlide the 3-position power switch to Battery Power, or to External Power if you are powering the sensor from the barrel-connector supply (external power runs with battery backup). The Off position disconnects power for storage.
-
3
Confirm powerActivate the CFG magnetic switch by holding a magnet to it — or, with the lid off, press the on-board CFG button. The TEST LED illuminates while activated, confirming the board has power. If it does not light, re-check the power switch position and the battery or external supply.
Installing the Pressure Transducer
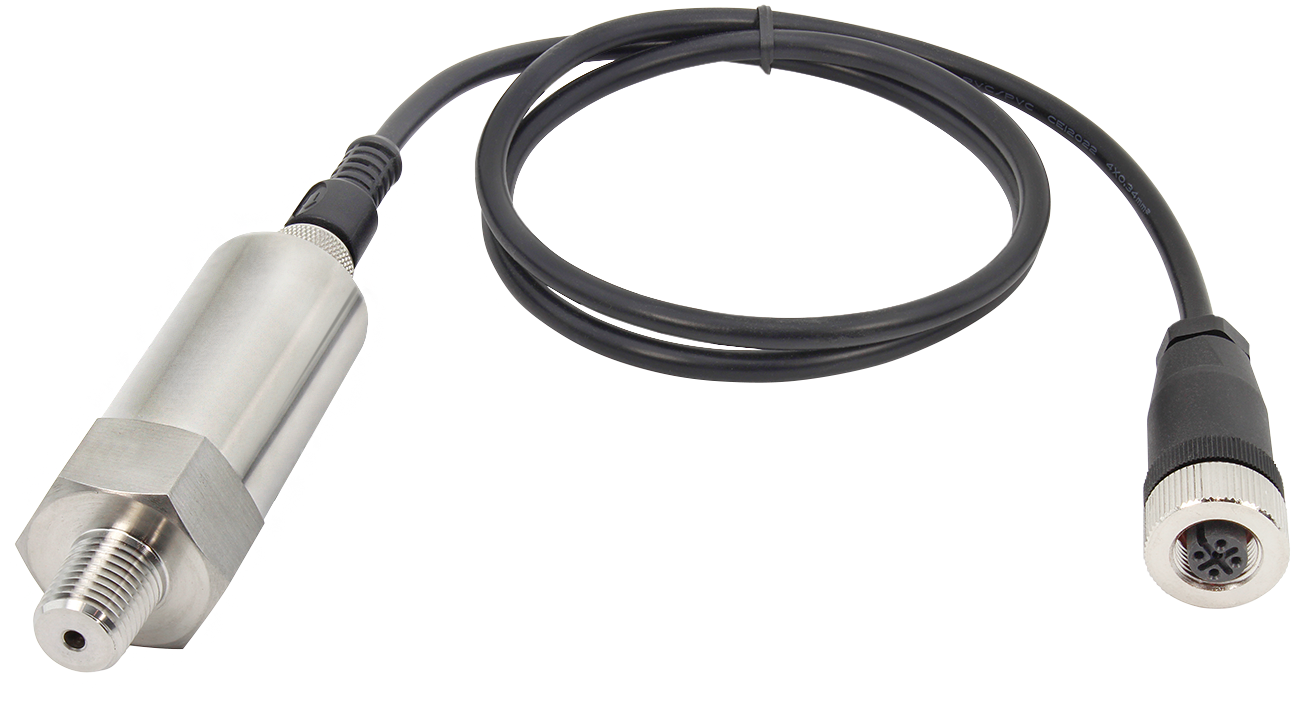
- Thread into the process tap. Apply PTFE thread-sealant tape to the 1/4″ NPT male threads and thread the transducer into your process port. Tighten on the wrench flats of the fitting — do not tighten by twisting the cable or the transducer body.
- Orient to shed condensate. Where the media can condense, position the transducer so liquid drains away from the diaphragm rather than pooling against it.
- Route and secure the cable. Keep the shielded cable clear of hot surfaces, sharp edges, and moving equipment, and leave a small service loop so the connection is not under tension.
- Respect media limits. The wetted parts are 316L stainless steel and the oil-filled diaphragm. Use with gases, liquids, or vapors that are compatible with those materials; avoid media that attacks stainless steel.
Connecting the Pressure Probe (M12 / PG9)
The wireless enclosure carries a 5-pin M12 connector, and the pressure transducer’s cable is terminated in a mating PG9 connector. NCD assembles this connector for you, so the probe arrives ready to plug in — align the connector with the enclosure port, push it on, and hand-tighten the coupling until snug so it cannot work loose under vibration. If you ever need to re-terminate the cable, land the four leads on the PG9 terminal block following the M12 pinout below. The connector consists of a gland nut, a sealing insert, the body, and a terminal block where the leads are screwed down.
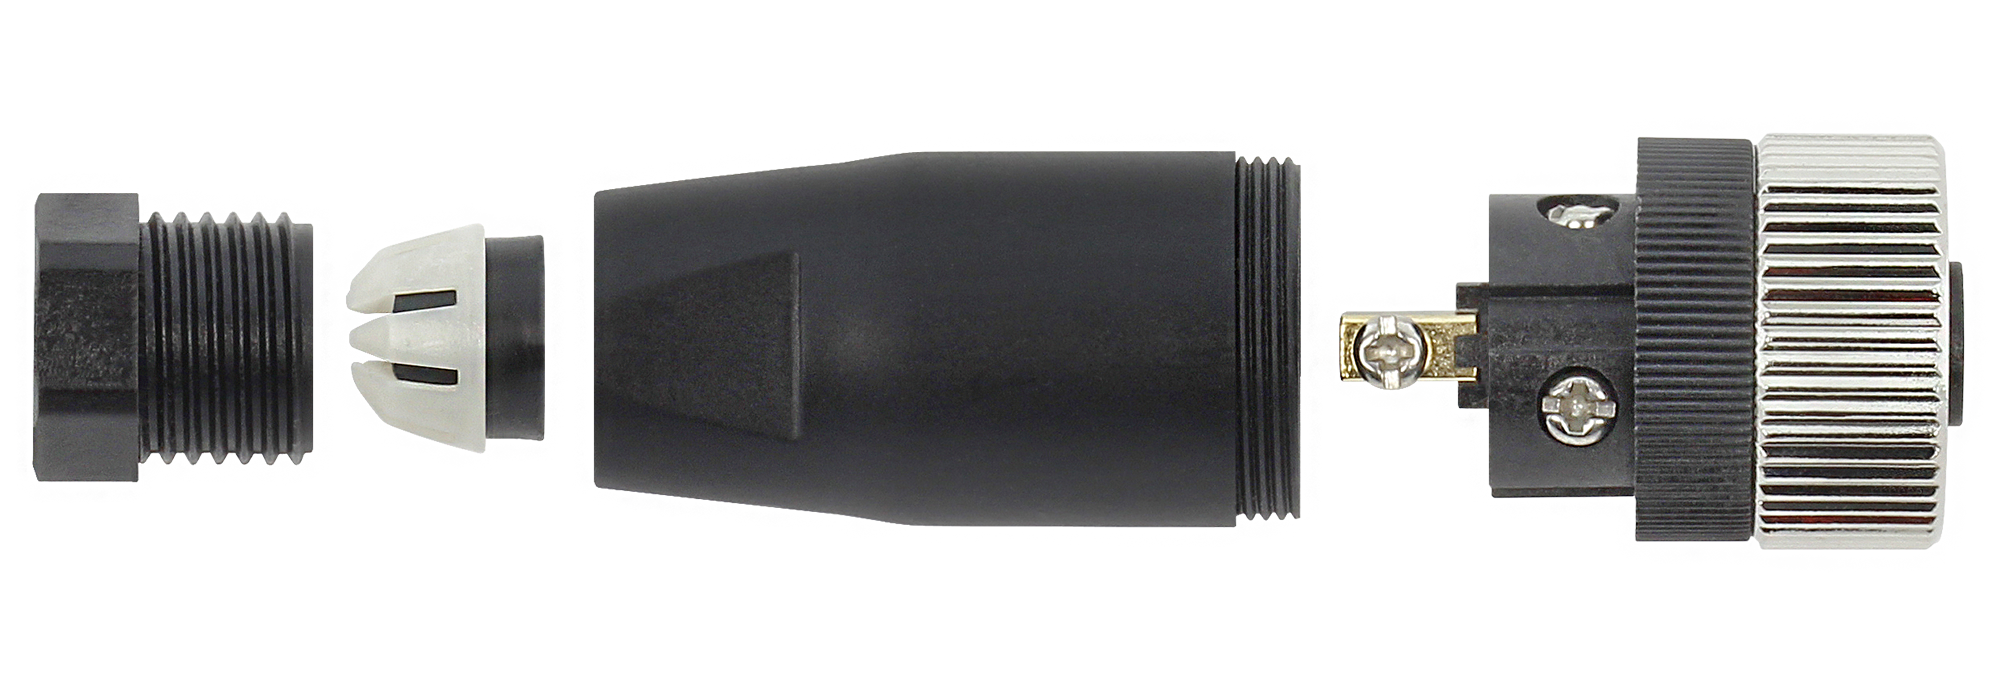
Only four of the five M12 positions are used. The pinout is:
| M12 Pin | Wire Color |
|---|---|
| 1 | Black |
| 2 | Brown |
| 3 | Blue |
| 4 | White |
| 5 | — (no connection) |
Mounting the Enclosure
- Wall mount: Fasten the enclosure to a flat surface using the mounting tabs, within cable reach of the transducer.
- Magnetic mount: With the optional magnetic mounting hardware, attach the enclosure to a clean, flat ferrous surface for tool-free placement.
05Pairing with Atrium
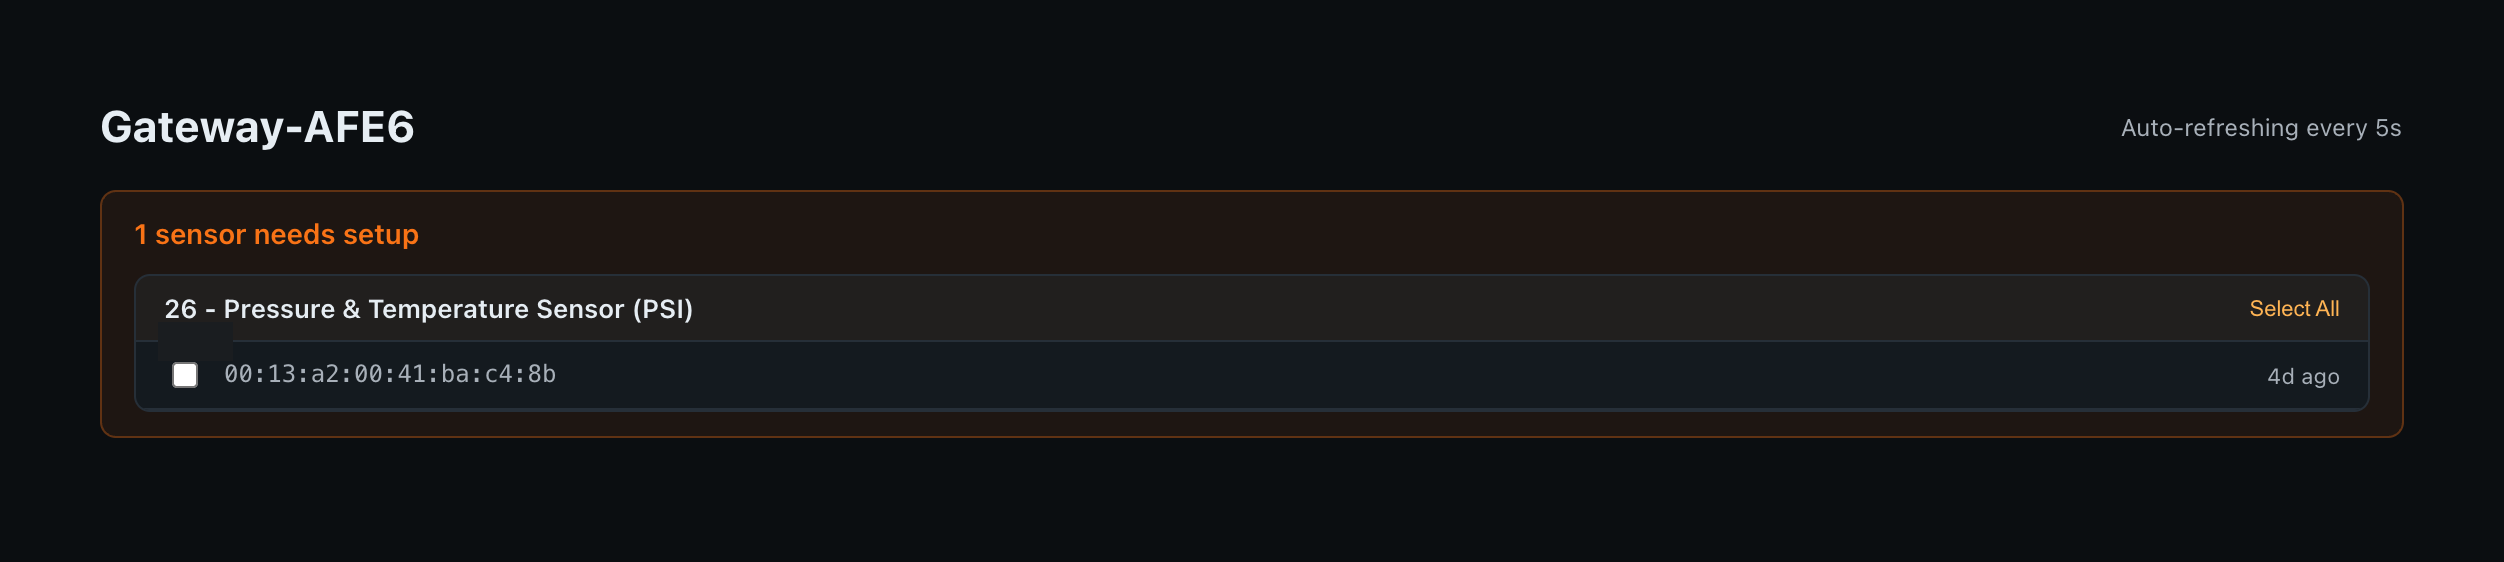
Once powered on, the sensor transmits over its long-range wireless mesh and the gateway begins hearing it. New sensors are held pending (blacklisted) until you whitelist them through the Sensor Details wizard — data is not logged until a sensor is whitelisted. The wizard walks you through naming and whitelisting each detected sensor.
-
1
Power on and install the sensorConfirm the sensor is powered (activate the CFG magnetic switch — or press the CFG button — and check that the TEST LED illuminates) and that the transducer is connected. Within one transmission interval — up to 10 minutes at the default 600-second Delay — the gateway will begin receiving its transmissions.
-
2
Open Atrium and go to SensorsNavigate to your gateway’s local address (e.g.
http://ncd-[last-4-of-MAC].local) and click Sensors in the top navigation. A banner shows “X sensors need setup” with detected sensors grouped by type. Your unit appears under the Pressure sensor type. -
3
Open the Sensor Details wizardClick the sensor in the banner (or in the Sensors table) to open the Sensor Details wizard. New sensors start pending (blacklisted) — completing the wizard whitelists the sensor so Atrium begins logging its data.
-
4
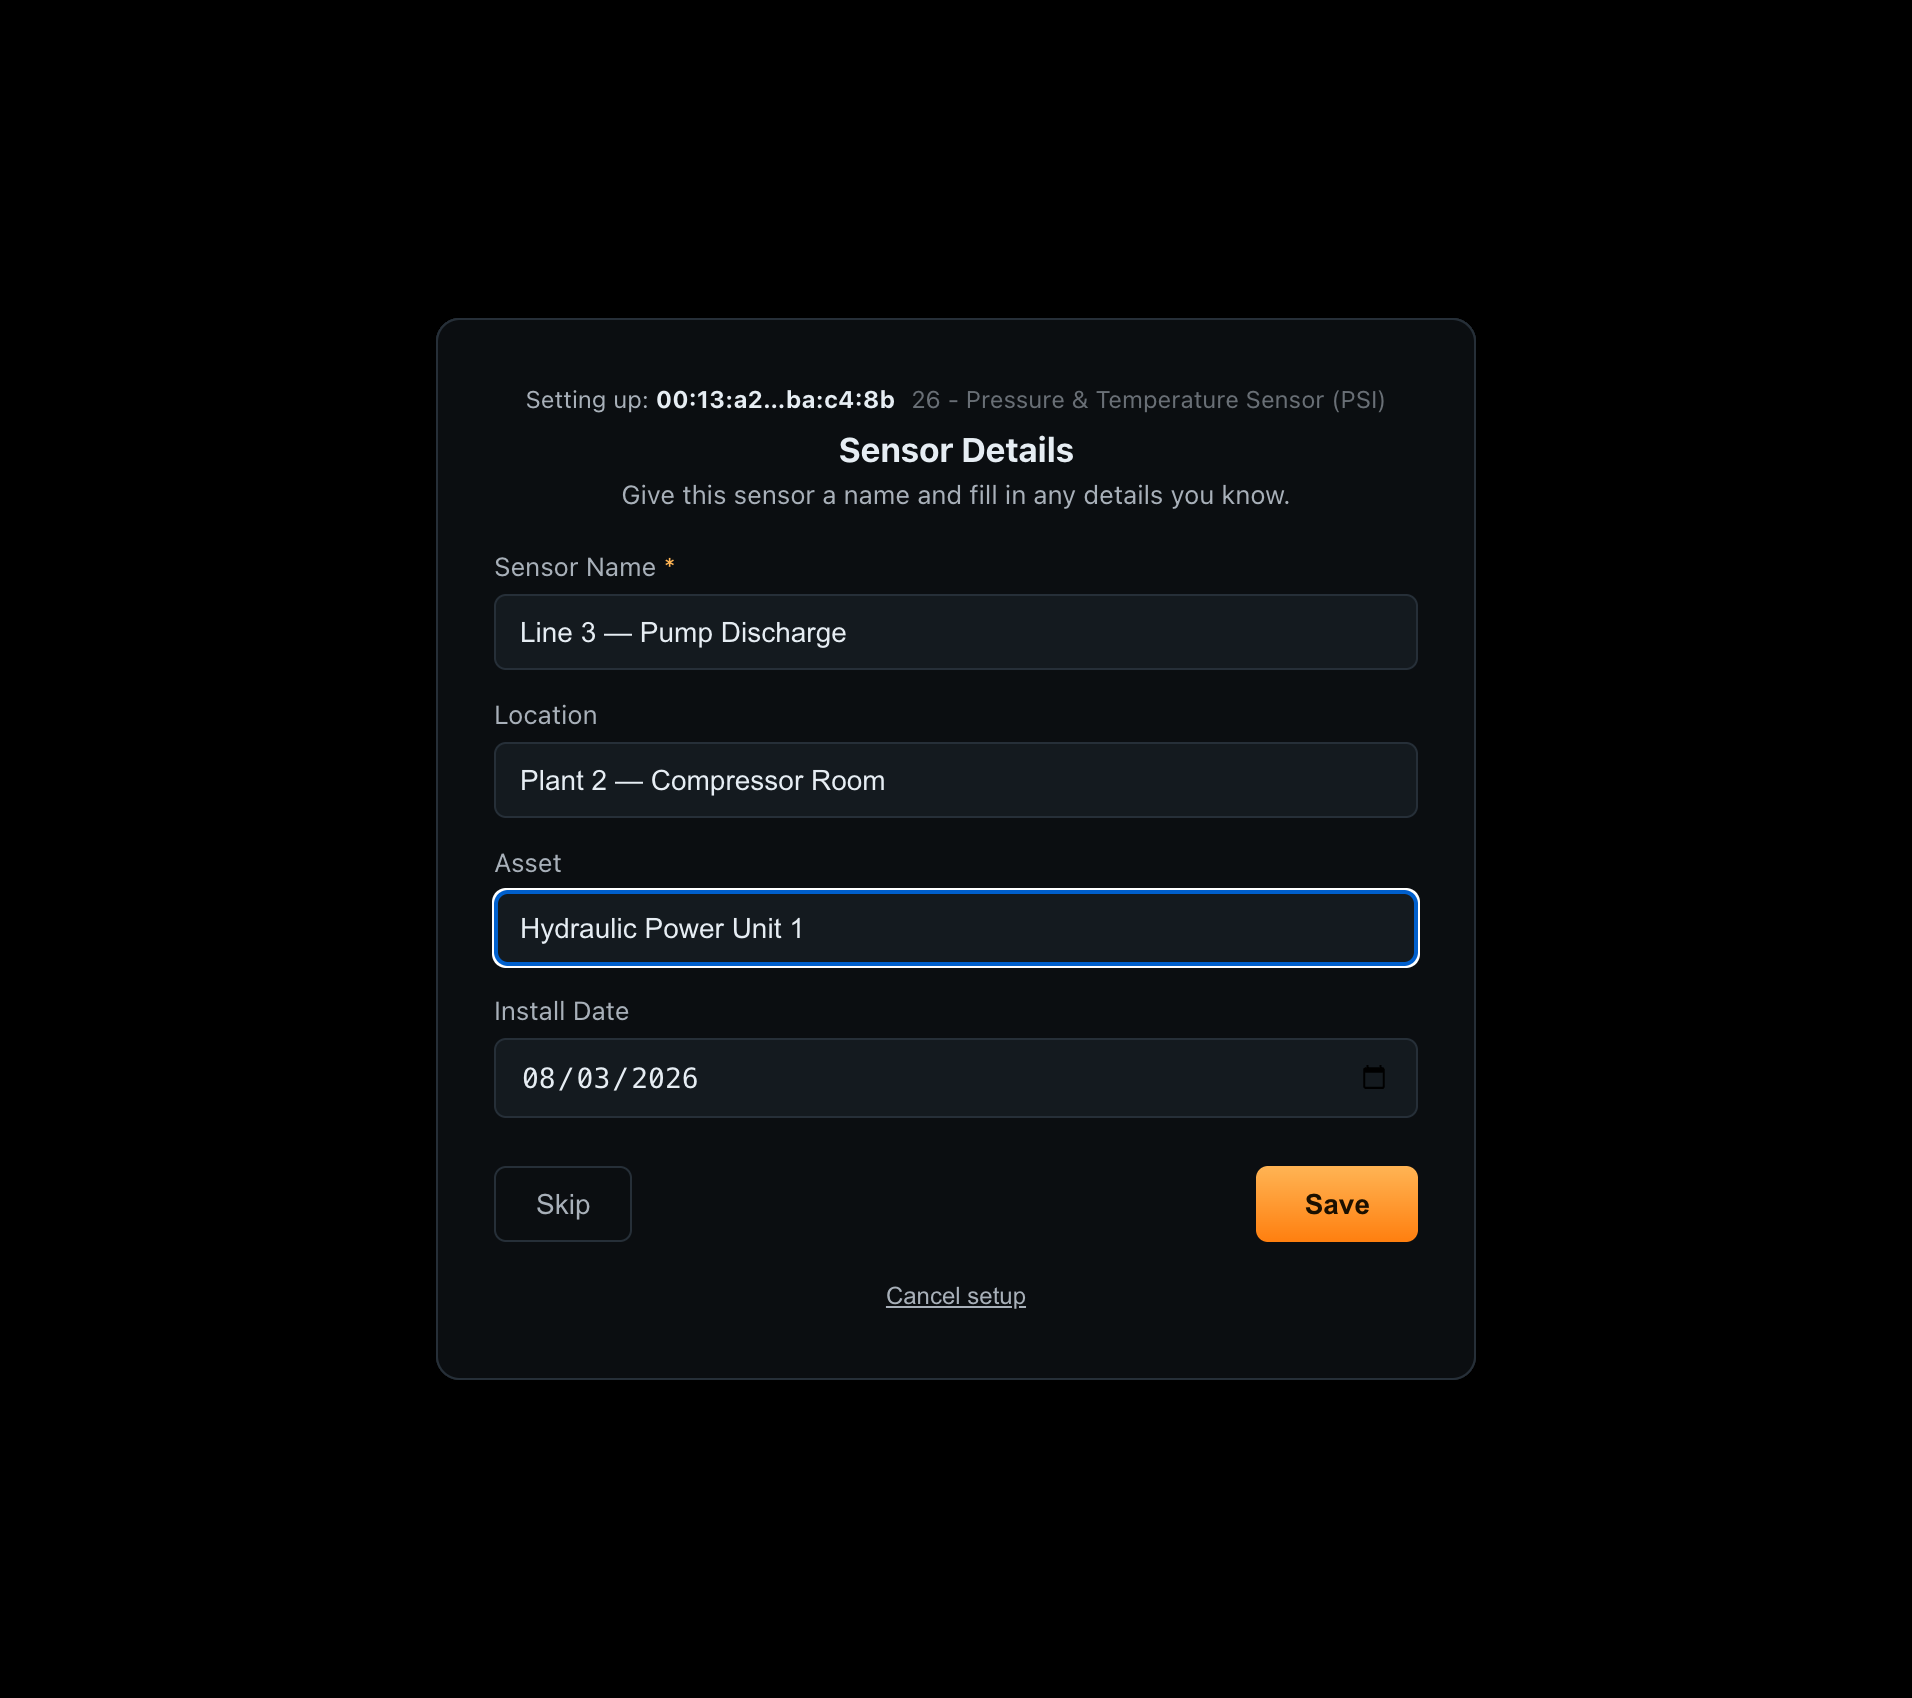
Enter details and saveGive the sensor a Sensor Name, Asset, and Location (see Section 6). Use Save to whitelist and finish, Save & Next to move to the next pending sensor, or Skip to leave a sensor pending for now.
-
5
Confirm it is reportingThe whitelisted sensor now appears in the Sensors table with a recent Last Heard timestamp. Open its Dashboard to confirm live pressure and temperature data.
06Sensor Meta
The Sensor Meta tab controls how Atrium identifies and tracks this sensor. Access it via Sensors → [your sensor] → Configure → Sensor Meta.
| Field | Description |
|---|---|
| Sensor Status | Whitelisted — data is logged and displayed. Blacklisted — data is ignored. New sensors are blacklisted (pending) until whitelisted via the Sensor Details wizard. |
| Sensor Name | Human-readable label shown throughout the Atrium interface (e.g. “Line 3 — Pump Discharge”). |
| Asset | The asset or equipment this sensor is monitoring (e.g. “Hydraulic Power Unit 1”). |
| Location | Physical location of the sensor (e.g. “Plant 2 — Compressor Room”). |
| Report Interval (seconds) | Must match the Delay value in Sensor Hardware Settings. Atrium marks the sensor offline if no data is received within 2× this value. |
| Install Date | Optional. Records when the sensor was deployed. |
| Offline Alert | When enabled, Atrium sends an email notification if the sensor stops reporting. Requires email configured in Settings → Gateway Configuration. |
07Metric Configuration
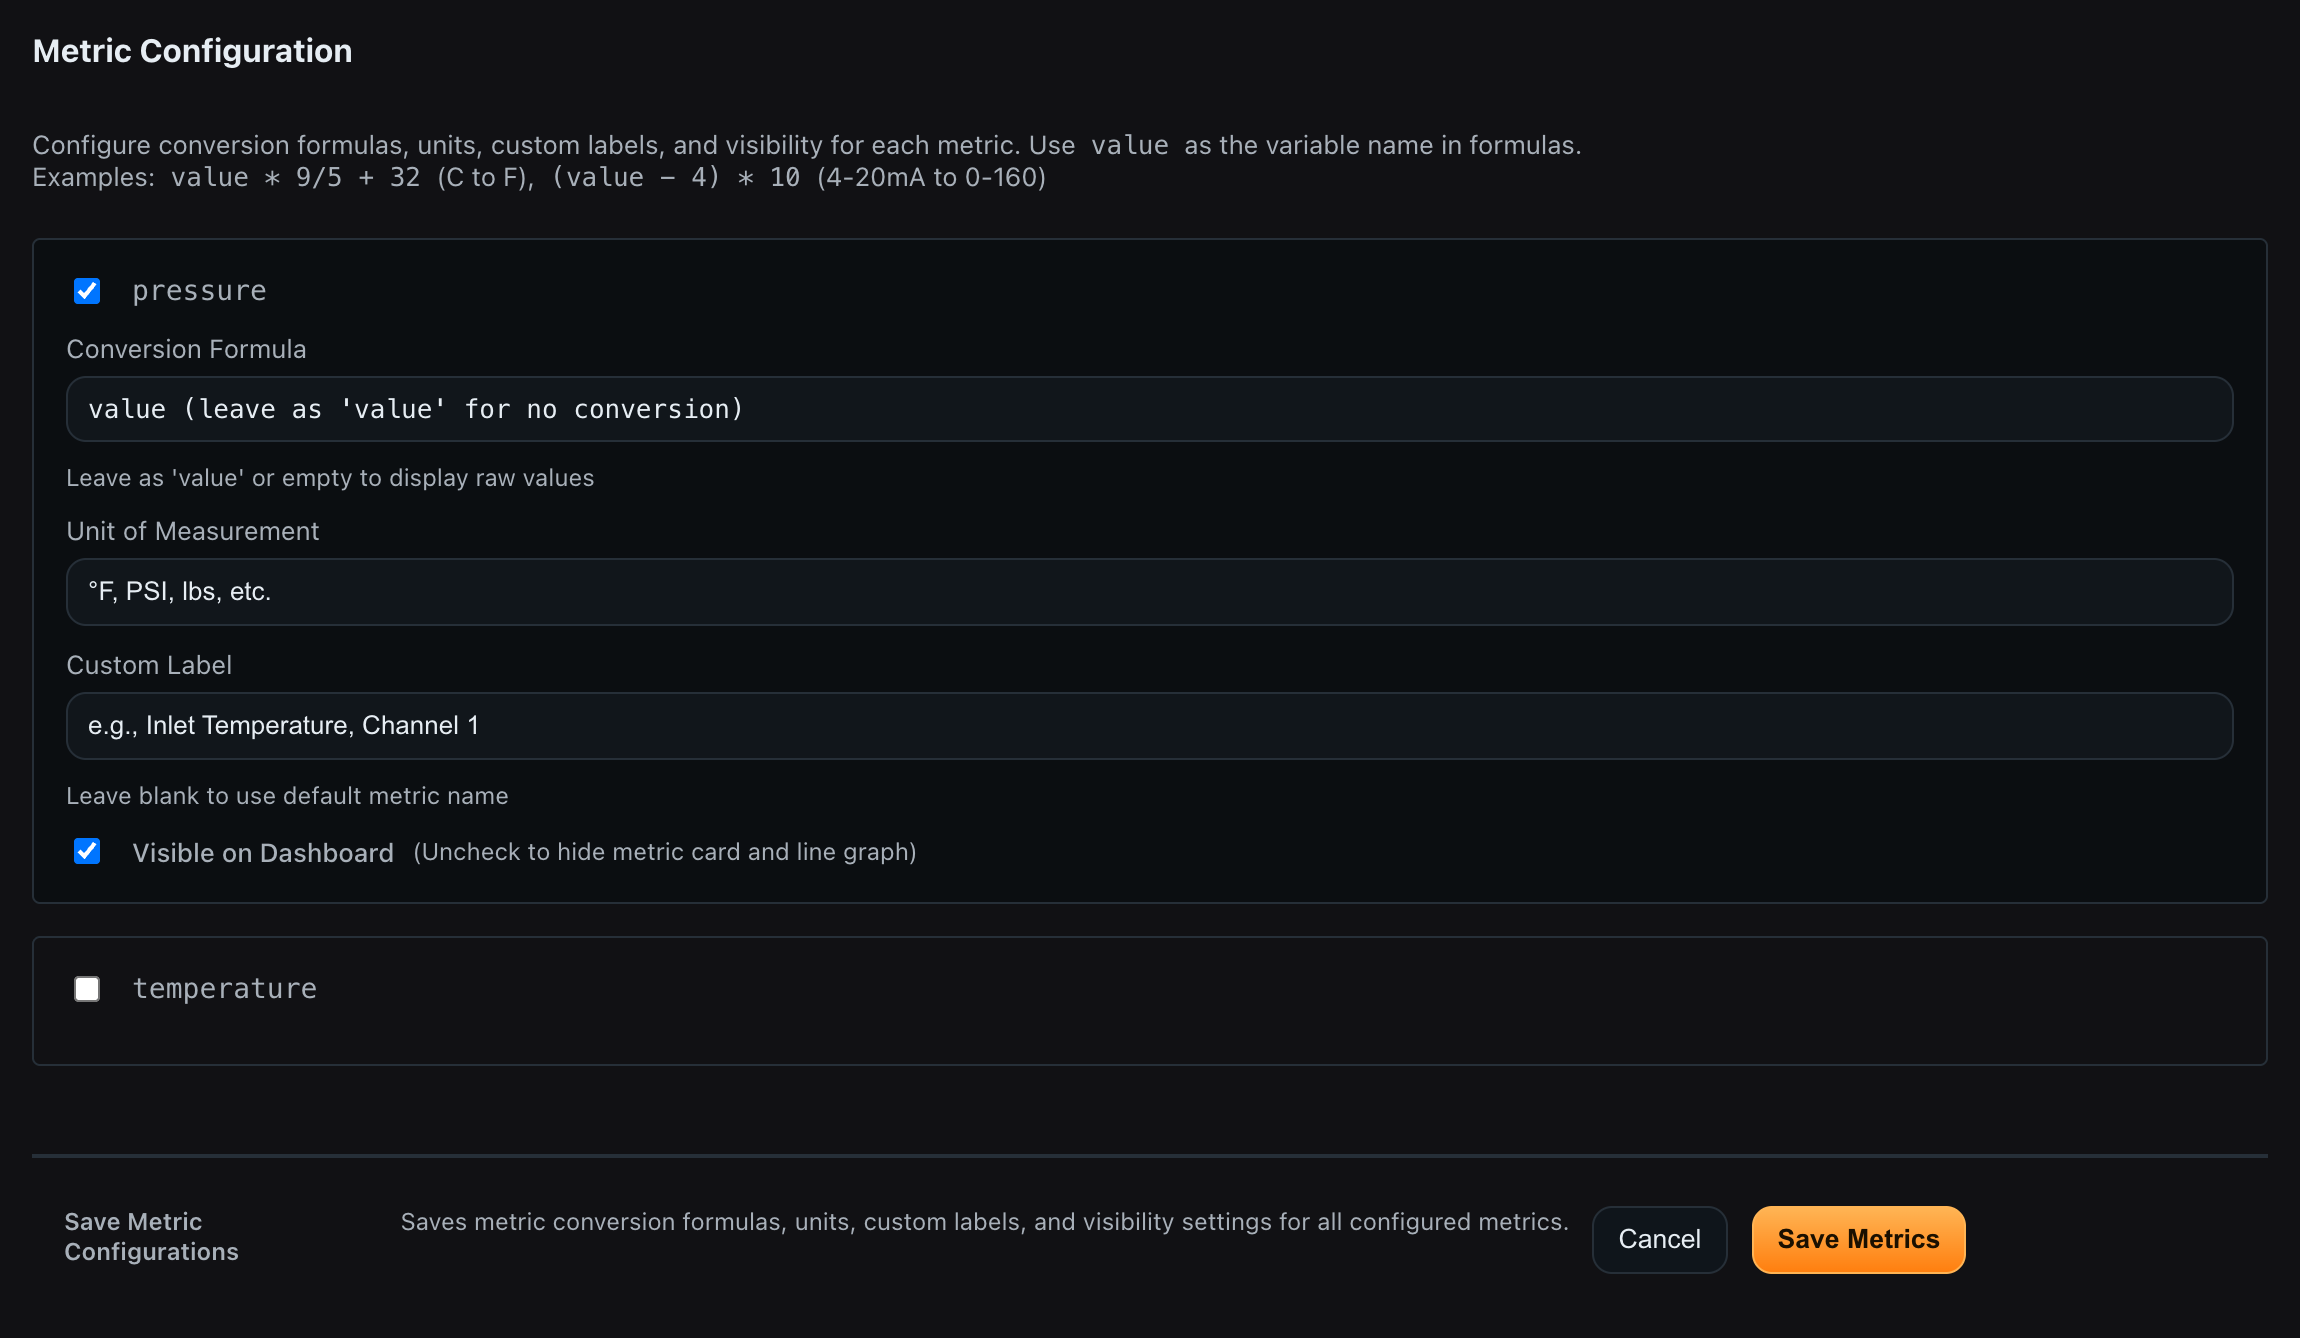
The Metrics tab lets you configure conversion formulas, units, custom labels, and dashboard visibility for each data channel. Access it via Configure → Metrics. This sensor reports pressure and temperature, plus battery and packet-metadata channels.
| Metric | Unit | Description |
|---|---|---|
pressure | PSI | Process pressure on the selected range |
temperature | °C or °F | On-board temperature (display unit set globally — see Section 9) |
battery_pct | % | Estimated remaining battery capacity |
battery_v | V | Battery voltage (separate from battery_pct) |
rssi | dBm | Received signal strength — reported as a positive magnitude; higher values mean a weaker signal |
counter | — | Transmission counter (0–255, then rolls over); useful for detecting missed packets |
Custom Conversion Formulas
Each metric supports a custom conversion formula using value as the variable name. Leave the formula as value or blank to display raw data. Examples for converting the pressure reading to other units:
value * 0.0689476     // Convert pressure from PSI to bar
value * 6.89476       // Convert pressure from PSI to kPa
value / 14.5038       // Convert pressure from PSI to MPa
value * 2.03602 // Convert pressure from PSI to inches of mercury (inHg)Custom Labels & Visibility
Each metric can be assigned a Custom Label that replaces the default metric name throughout Atrium. Unchecking Visible on Dashboard hides that metric’s card and chart without deleting data — useful for focusing a dashboard on the pressure and temperature channels that matter for a given asset.
08Hardware Settings
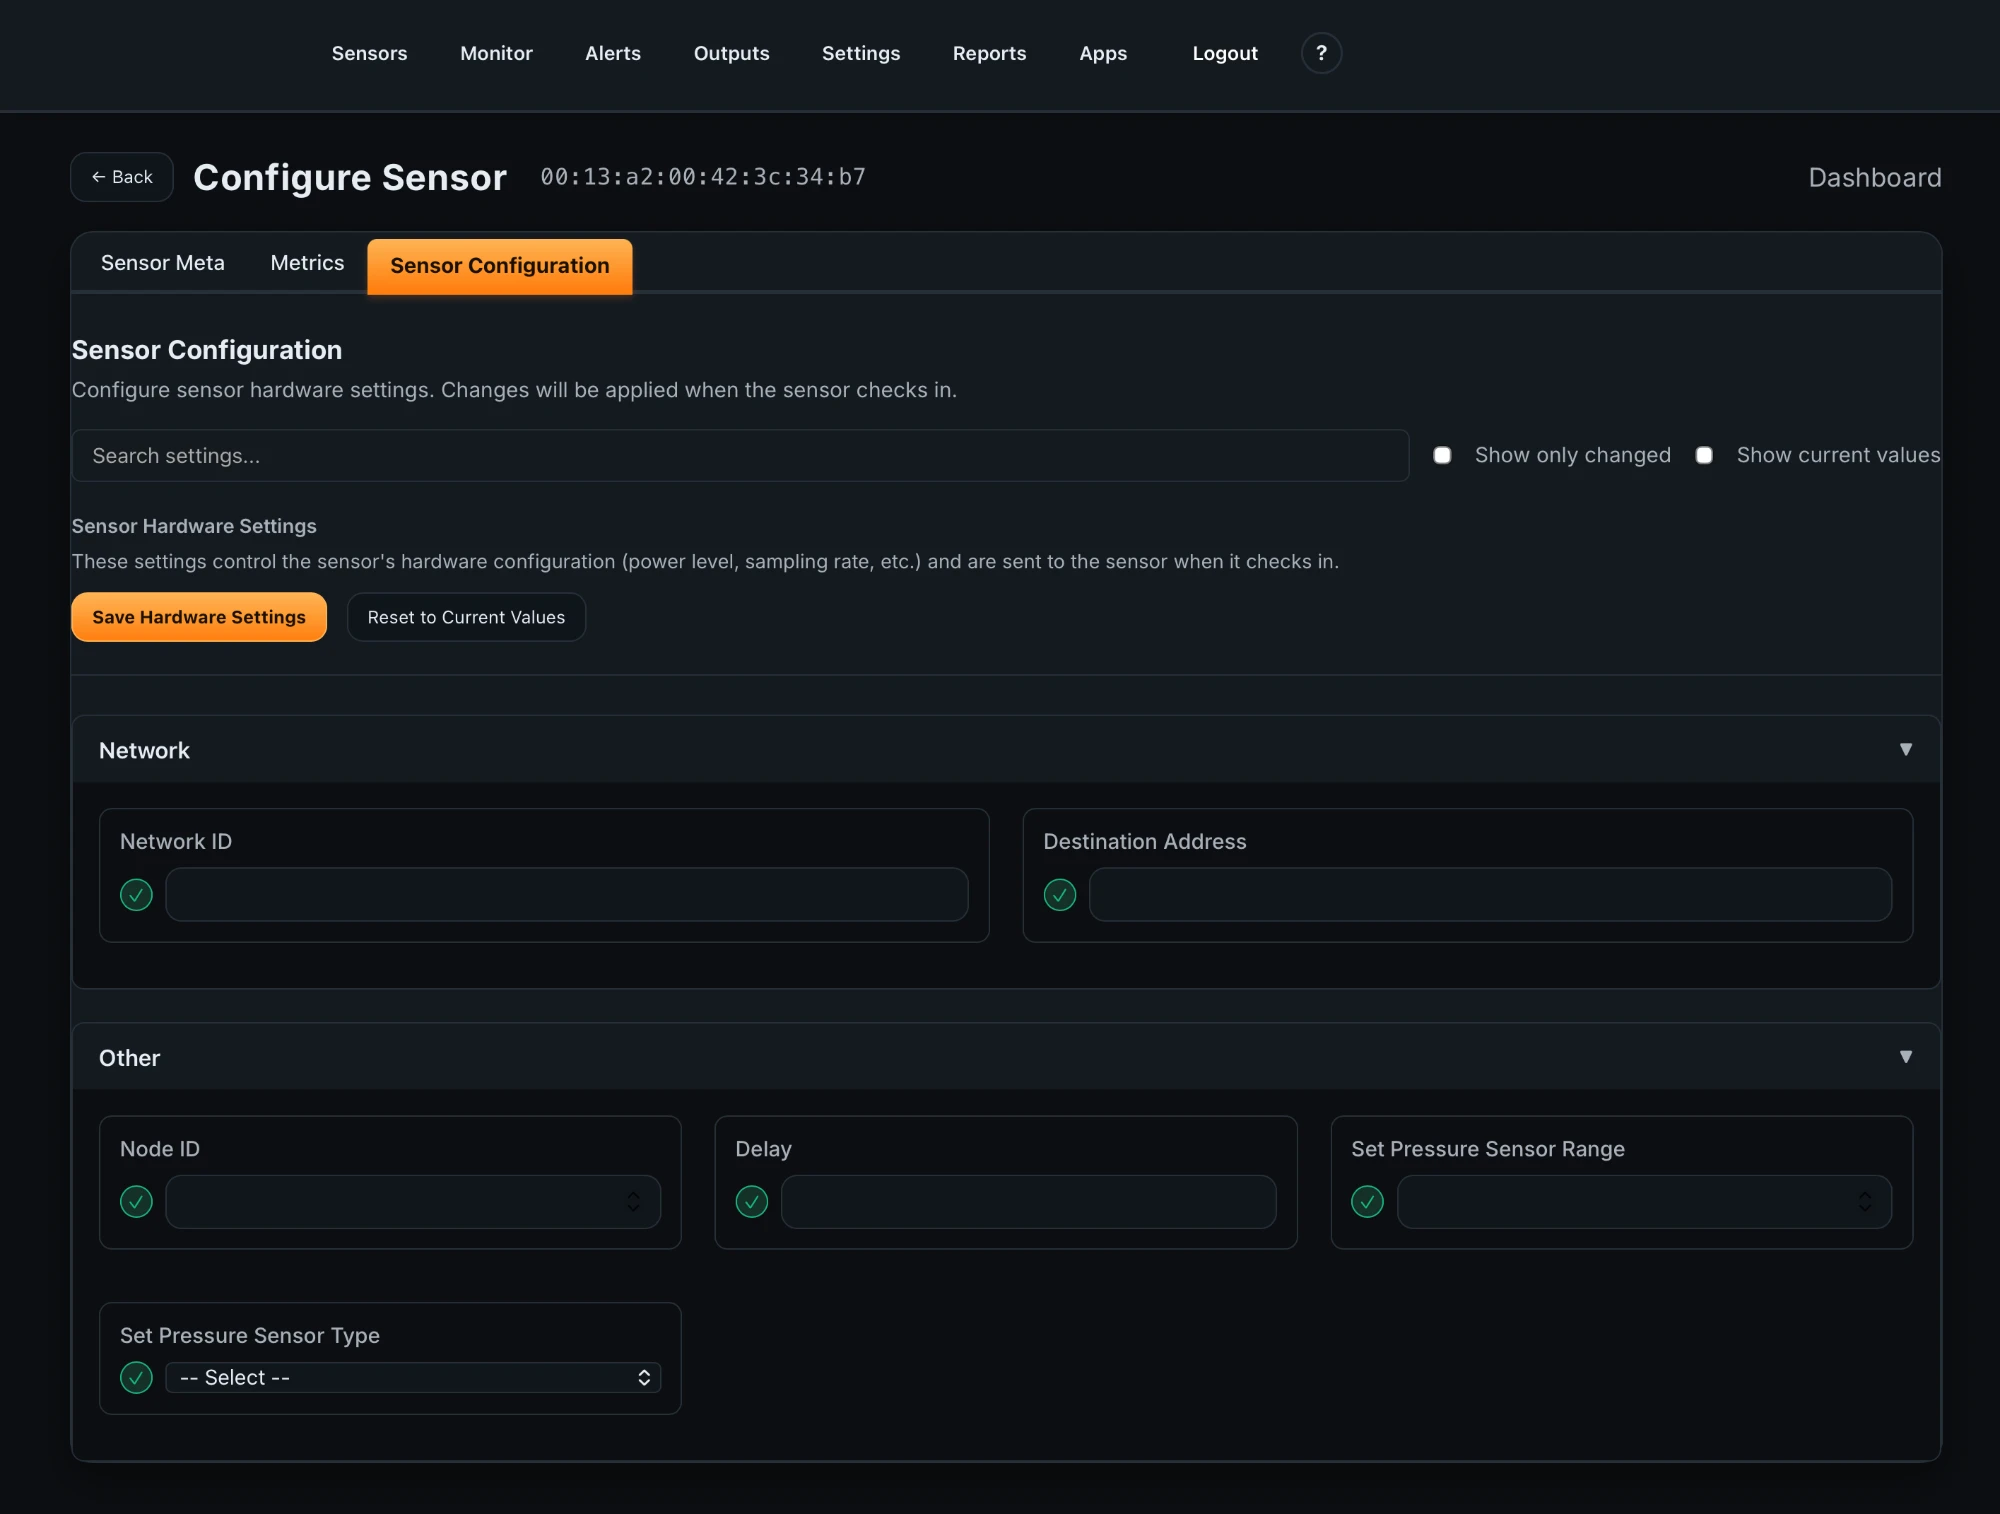
Hardware settings control the sensor’s on-board configuration — transmission interval and network addressing. Changes are staged in Atrium and pushed to the sensor on its next configuration check-in. Access via Configure → Sensor Configuration.
Key Configuration Parameters
| Setting | Default | Description |
|---|---|---|
| Delay | 600 s | Transmission interval in seconds — how often the sensor samples and transmits a reading. Lower values increase data frequency at the cost of battery life. |
| Network ID | 7fff | The wireless network ID. Must match the gateway’s network ID for the sensor to communicate. (Configuration Mode uses a separate ID, 7bcd.) |
| Destination Address | 0000ffff | Broadcast address the sensor transmits to. Left at default for standard mesh topologies. |
Adjusting the Transmission Interval
-
1
Go to Sensor ConfigurationNavigate to Sensors → [your sensor] → Configure → Sensor Configuration.
-
2
Update the Delay valueSet your desired transmission interval (Delay) in seconds. Shorter intervals give more frequent readings at the cost of battery life.
-
3
Click Save Hardware SettingsThe new values are staged and pushed to the sensor on its next configuration check-in — wait up to one transmission interval, or trigger the RESET magnetic switch (or press the RESET button) to sync immediately.
-
4
Update the Report Interval in Sensor MetaUpdate the Report Interval on the Sensor Meta tab to match your new Delay value so offline detection stays accurate.
Battery Life
The sensor delivers up to 5 years of battery life. Actual life depends on your configuration — a shorter Delay (more frequent transmissions) draws more power. To estimate battery life for your exact settings, use NCD’s battery life calculator. For continuous high-rate monitoring, run the sensor on external power.
09Temperature Units
This sensor reports on-board temperature alongside its pressure metric. Atrium provides a global temperature display unit setting that controls how temperature readings appear across the entire interface — all sensors, dashboards, alerts, and reports.
-
1
Open Gateway SettingsClick Settings in the top navigation to open Gateway Configuration.
-
2
Select Temperature Display UnitUnder Temperature Display Unit, toggle between °C and °F. This applies immediately to all temperature readings across Atrium.
-
3
Save ConfigurationClick Save Configuration at the bottom of the page to apply the change.

10Sensor Dashboard
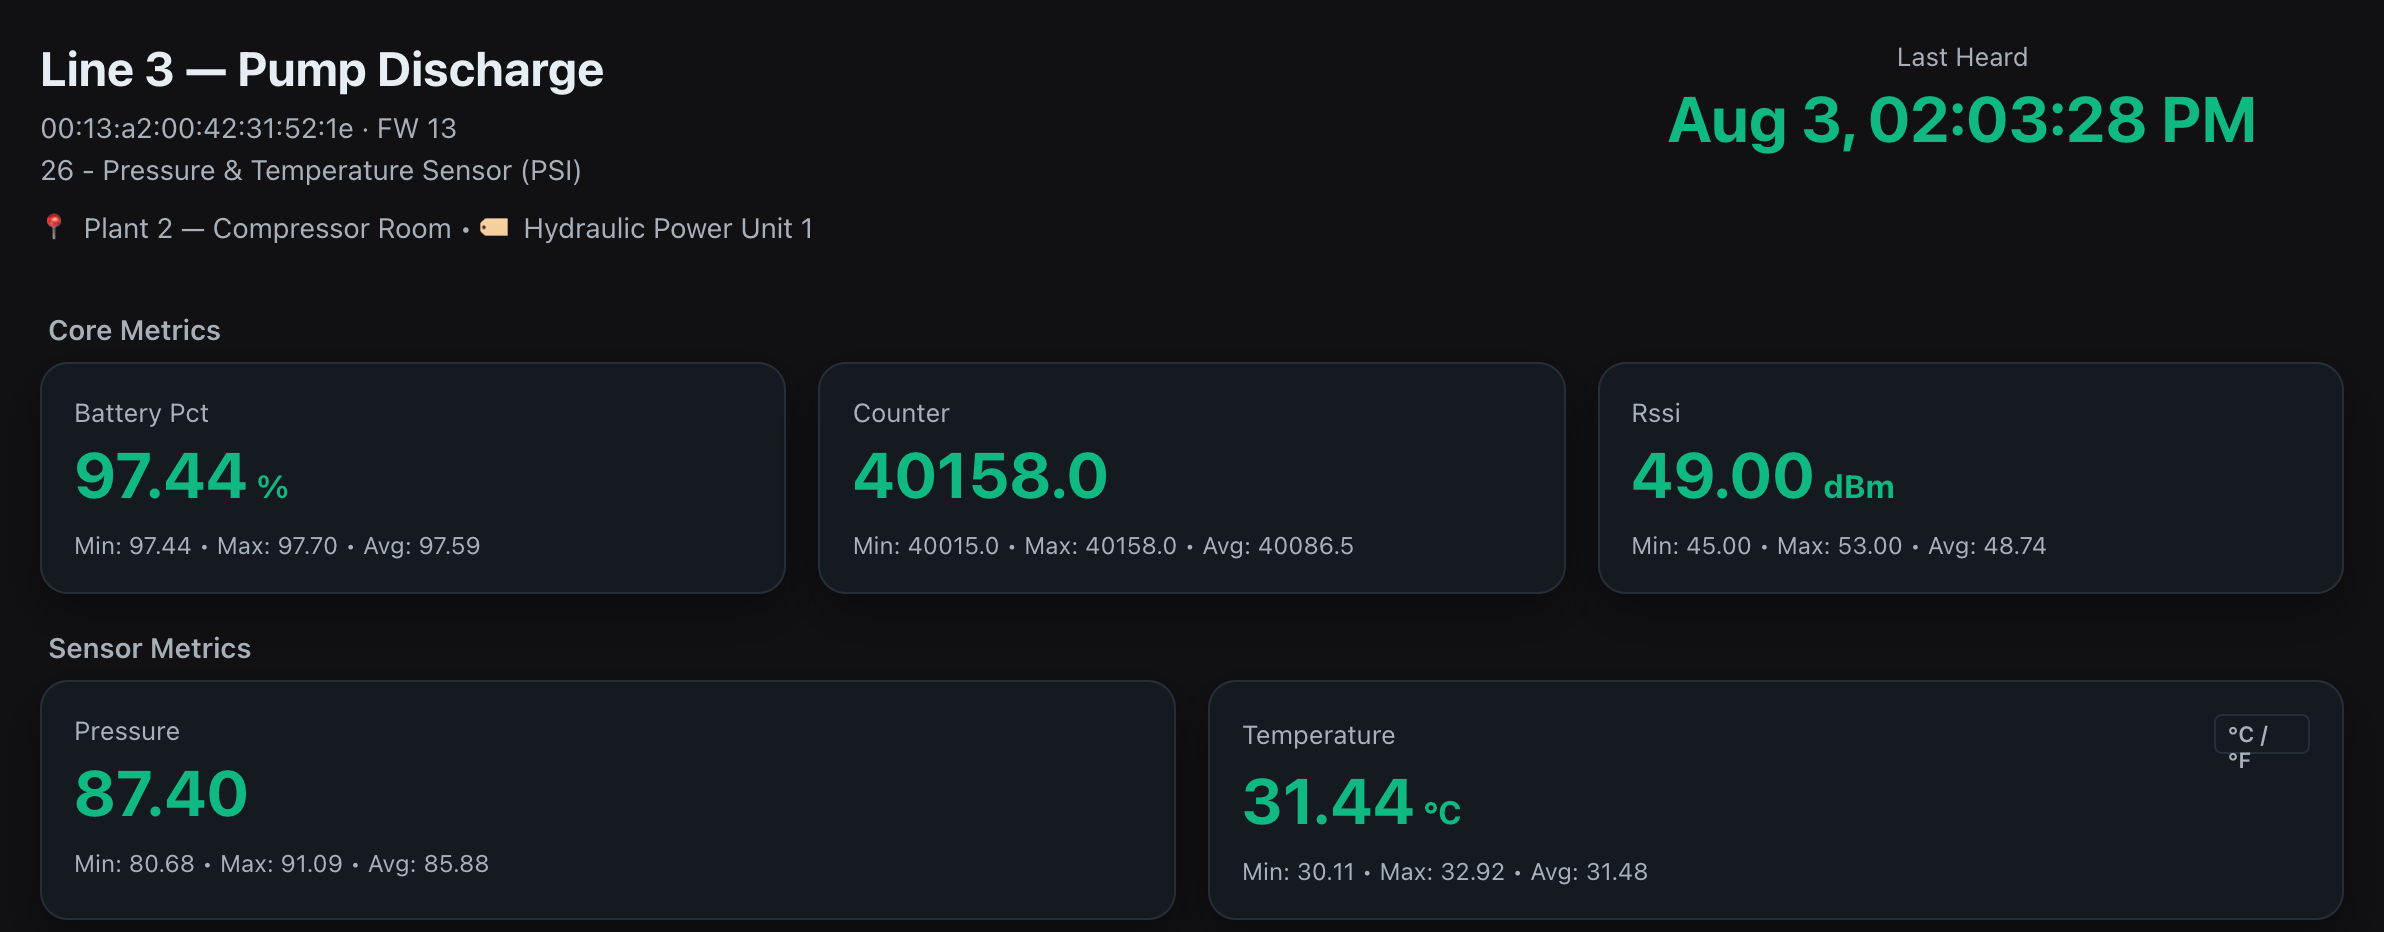
The Sensor Dashboard provides a real-time and historical view of all data from this sensor. Access it by clicking the sensor in the Sensors list and selecting Dashboard.
Live Metrics
| Metric | Unit | Description |
|---|---|---|
| Pressure | PSI | Process pressure on the selected range |
| Temperature | °F or °C | On-board temperature |
| Battery Pct | % | Estimated remaining battery capacity |
| RSSI | dBm | Signal strength as a positive magnitude — higher values mean a weaker signal |
Time Range & Charts
Use the time range selector to view historical data for the last hour, 6 hours, 24 hours, 7 days, or 30 days. A custom date/time range is also available. Each metric has its own interactive chart — drag to zoom into a time window, double-click to reset. Trend pressure over time to catch a slow leak, a fouling filter, or a pump losing head before it becomes a failure.
Mesh Route Map
Click View Map in the Mesh Route Map panel to visualize how this sensor’s data routes through the wireless mesh to reach the gateway. Useful for diagnosing signal path issues in multi-sensor deployments.
Interactive Preview
The panel below simulates the Atrium Sensor Dashboard for this Pressure / Temperature sensor. Data updates every 5 seconds to demonstrate the live monitoring experience.
11Setting Alerts
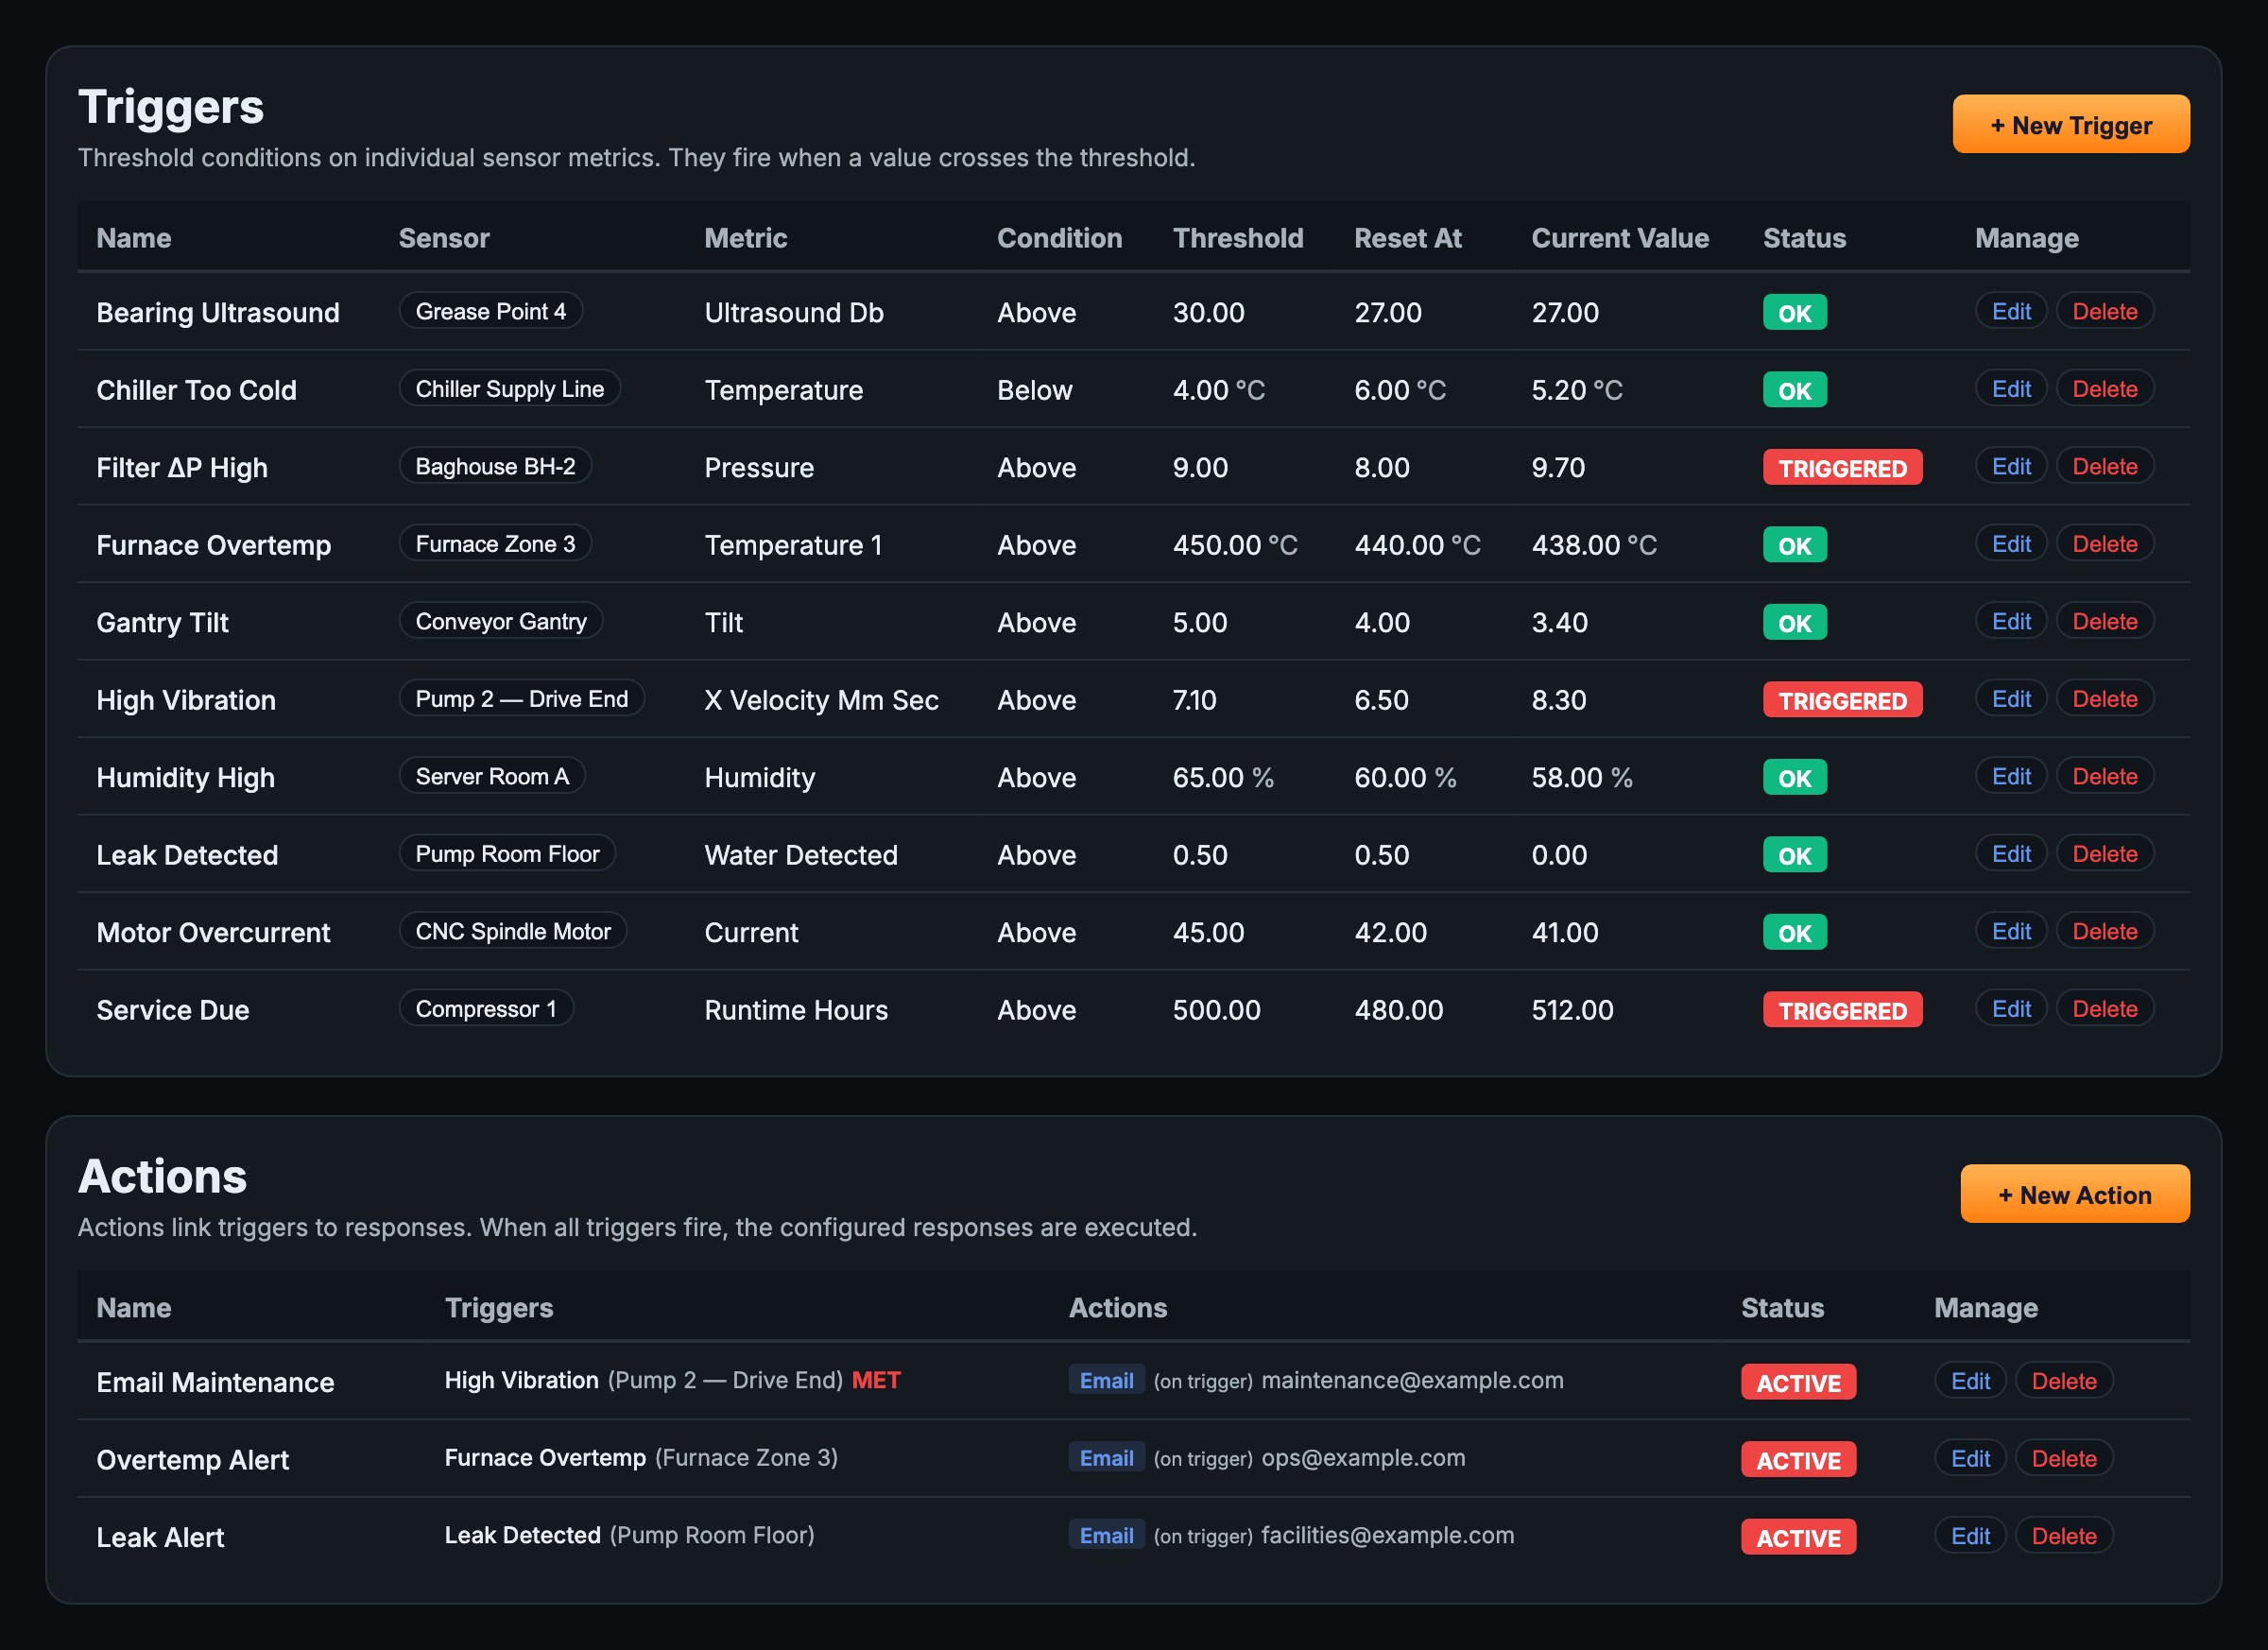
Atrium uses a Triggers & Actions model for alerting. A Trigger defines the threshold condition on a metric. An Action defines what happens when all assigned triggers fire. Navigate to Alerts in the top navigation (the page is titled Alerts & Actions) to configure.
Creating a Trigger
-
1
Go to Alerts → TriggersClick + New Trigger to open the Create Trigger form.
-
2
Configure the triggerSelect the Device, Metric (e.g.
pressureortemperature), Condition (Above or Below), and Threshold value. The Reset At column sets the value the metric must return to before the trigger can fire again — this hysteresis prevents repeated firing when the value oscillates near the threshold. Click Create Trigger.
Creating an Action
-
1
Go to Alerts → ActionsClick + New Action. Actions link one or more triggers to a response — when all assigned triggers fire simultaneously, the action executes.
-
2
Assign triggers and configure the responseSelect the trigger(s) to watch and configure the response. Atrium supports email notifications and relay output actions (to drive an external relay, e.g. to signal or shut down equipment). Email must be configured in Settings → Gateway Configuration for email actions to work.
12Exporting Data
All sensor data can be exported to CSV directly from the Sensor Dashboard for use in spreadsheets, reporting tools, or analysis software.
-
1
Open the Sensor DashboardNavigate to the sensor and click Dashboard.
-
2
Select a time rangeChoose the time range you want to export using the selector at the top of the dashboard.
-
3
Click “CSV” on the desired metricEach metric chart has a CSV download button. Click it to download a timestamped CSV of that metric’s data for the selected time range. Export the pressure channel for offline trend analysis.
13Product Notes
Reference information for ordering and accessories.
| Item | Detail |
|---|---|
| SKU | PR52-33P |
| Wireless Module | Select 900 MHz (North & South America), 868 MHz (Europe), or 2.4 GHz (worldwide) at time of order |
| Pressure Ranges | 0–20, 0–100, 0–500, 0–1,000, 0–5,000, and 0–10,000 PSI — plus special-order ranges (see Section 2) |
| Process Fitting | 1/4″ NPT male on a 316L stainless steel, oil-filled transducer (cabled to the enclosure) |
| Power | D-cell (LR20) lithium battery with integrated supercapacitor, or external power supply via barrel connector — 3-position Battery / Off / External switch |
| Antenna Options | On-board antenna (U.FL to RP-SMA pigtail); optional high-gain antenna and RP-SMA extension cables (1 m / 3 m / 6 m / 9 m) |
| Receiver Options | Atrium IIoT Gateway, Enterprise IIoT Gateway / Lite, or NCD Wireless-to-USB / Wireless-to-Ethernet modem |
| Mounting | Wall-mount tabs or optional magnetic mounting hardware |
14Troubleshooting
Common issues and their solutions.
Sensor not appearing in Atrium
- Confirm the sensor is powered — the power switch is set to Battery Power (or External Power), and activating the CFG magnetic switch (or pressing the CFG button) lights the TEST LED.
- Verify the sensor’s wireless frequency (900/868 MHz or 2.4 GHz) matches the gateway’s radio.
- Verify the sensor’s Network ID matches the gateway’s Network ID (default
7fff). If the unit was left in Configuration Mode it uses7bcdinstead and will not report. - Move the sensor closer to the gateway to rule out range issues — test within 3 ft (1 m) first.
- Check that the Atrium gateway is powered on and connected to your network.
Sensor showing as Offline in Atrium
- Verify the Report Interval in Sensor Meta matches the Delay in Sensor Hardware Settings (both default to 600 seconds).
- Check the
battery_pcton the last received reading — replace the D-cell battery if low. - Check the RSSI value — remember higher numbers mean a weaker signal. Readings consistently above 75 dBm indicate marginal signal; reposition the sensor or gateway, add a high-gain antenna, or add a repeater node.
Pressure reading looks wrong
- Reading stuck or unresponsive: check the process connection — a blocked tap, closed isolation valve, or clogged snubber prevents pressure from reaching the diaphragm. Confirm the transducer is threaded in and the port is open to the process.
- Off-scale / saturated (pegged high): the applied pressure exceeds the selected range. Choose a higher-range option or reduce the applied pressure. Repeated overpressure can permanently damage the diaphragm.
- Reading is noisy or drifts with temperature: allow the transducer to equilibrate to the process temperature, and confirm the selected range suits your working pressure (an over-ranged option gives coarse resolution at low pressures).
Hardware settings not updating on sensor
- Settings are staged and applied on the sensor’s next configuration check-in — wait one full transmission interval (up to 10 minutes at the default 600-second Delay) after saving.
- To apply changes immediately, trigger the RESET magnetic switch with a magnet (or press the RESET button), which opens a configuration window on boot.
- Confirm the sensor is actively transmitting by checking the Last Heard timestamp on the dashboard.
15Factory Reset
A factory reset restores the sensor’s wireless module to default settings. This is useful if the sensor is not being detected by a gateway, or if you are redeploying it to a new network. The magnetic switch method is recommended — no disassembly required. Reset behavior is governed by how long the CFG switch is held after a RESET.
| CFG hold time (after RESET) | Result |
|---|---|
| Less than 2 seconds | Normal Run Mode |
| 2 to 15 seconds | Configuration Mode only (Network ID temporarily 7bcd) |
| More than 15 seconds | Factory reset to defaults, then Configuration Mode |
Option A — Magnetic Switches (no disassembly)
- 1Trigger the RESET switchHold a magnet near the RESET magnetic switch, then move it away.
- 2Wait 1 secondAllow approximately 1 second before proceeding.
- 3Hold the CFG switch for more than 15 secondsHold the magnet near the CFG magnetic switch for approximately 20 seconds, then move it away. The hold must exceed 15 seconds to trigger a factory reset — a shorter hold only enters Configuration Mode.
- 4Wait 3–5 secondsAllow 3–5 seconds for the reset to complete. The sensor is now reset to defaults and in Configuration Mode.
- 5Trigger the RESET switch againHold the magnet near the RESET switch once more, then move it away. This returns the sensor to normal Run Mode. Re-pair it in Atrium.
Option B — Physical Buttons (requires opening enclosure)
- 1Open the enclosureRemove the four top screws and lift the lid to access the PCB, and locate the RESET and CFG buttons and the TEST LED.
- 2Press and release the RESET buttonPress and release the RESET button on the PCB.
- 3Wait 1 second, then hold CFG for more than 15 secondsWait approximately 1 second, then press and hold the CFG button for approximately 20 seconds. The hold must exceed 15 seconds to trigger a factory reset — a shorter hold only enters Configuration Mode. Release the button when done.
- 4Wait 3–5 secondsAllow 3–5 seconds for the reset to complete. The sensor is now reset to defaults and in Configuration Mode.
- 5Press RESET, then close the enclosurePress and release the RESET button once more to return the sensor to normal Run Mode, then re-seal the enclosure and re-pair it in Atrium.