|
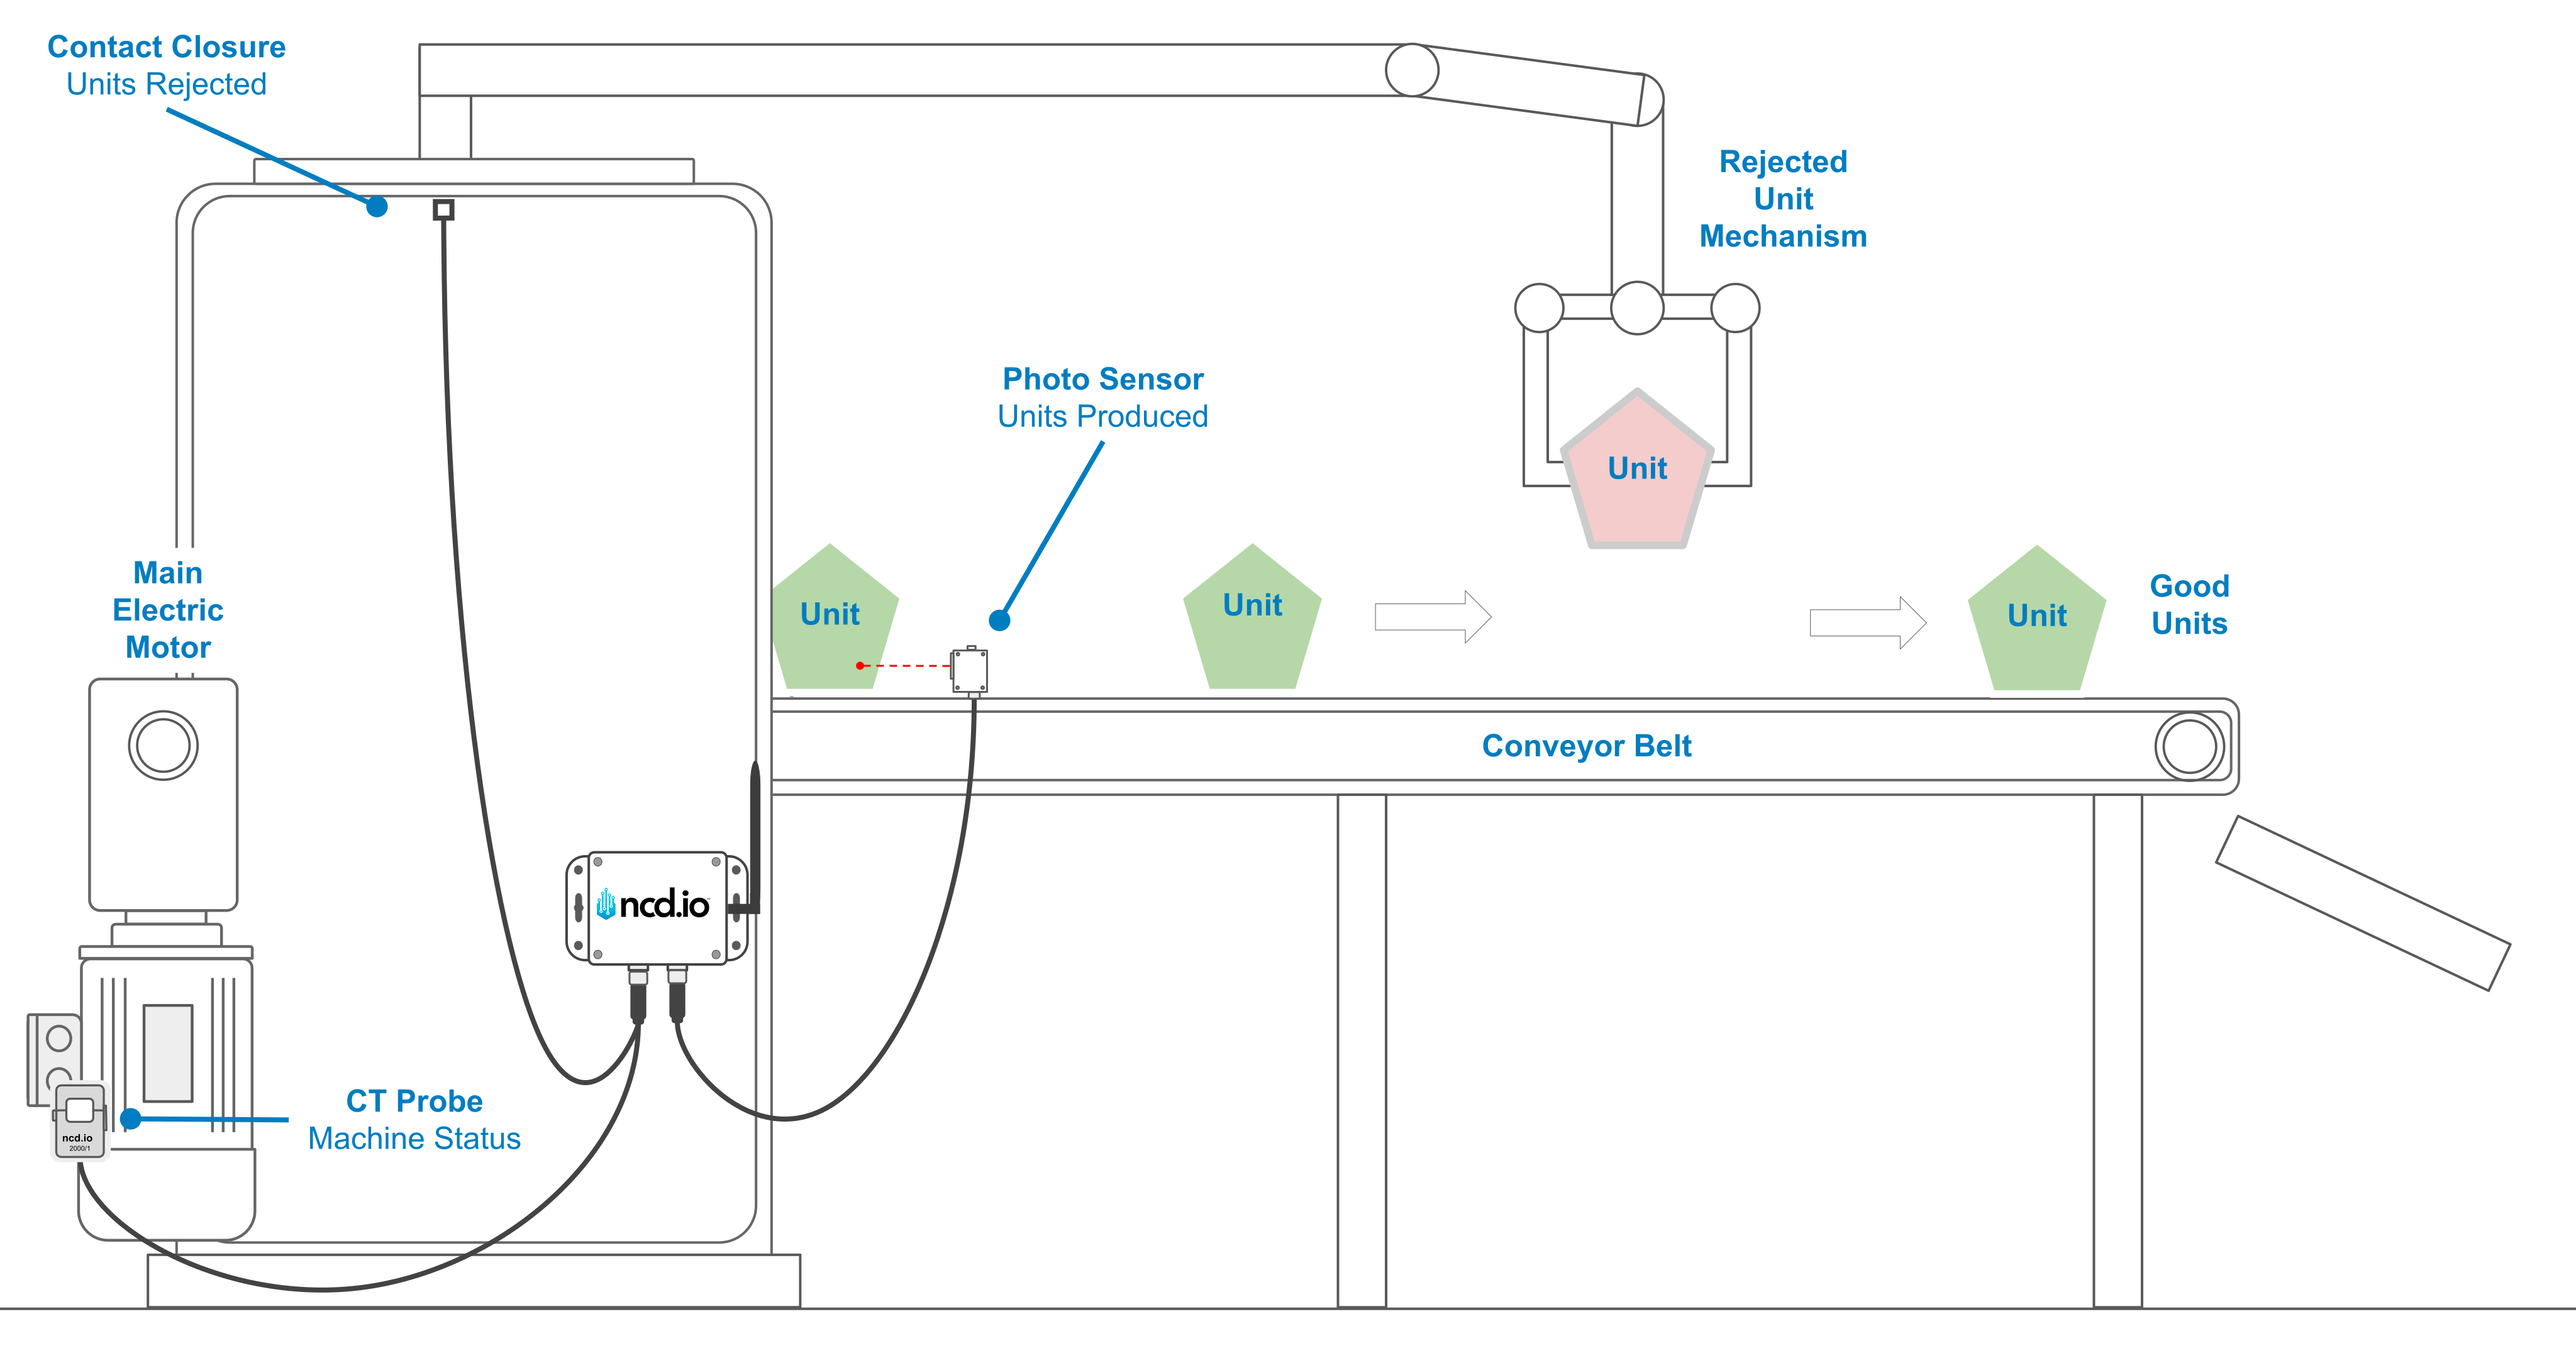
Main AC Electric Motor
|
CT Current Probe
|
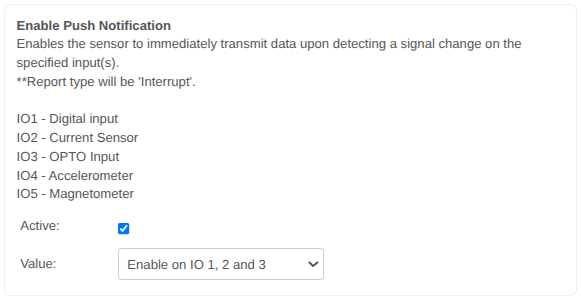
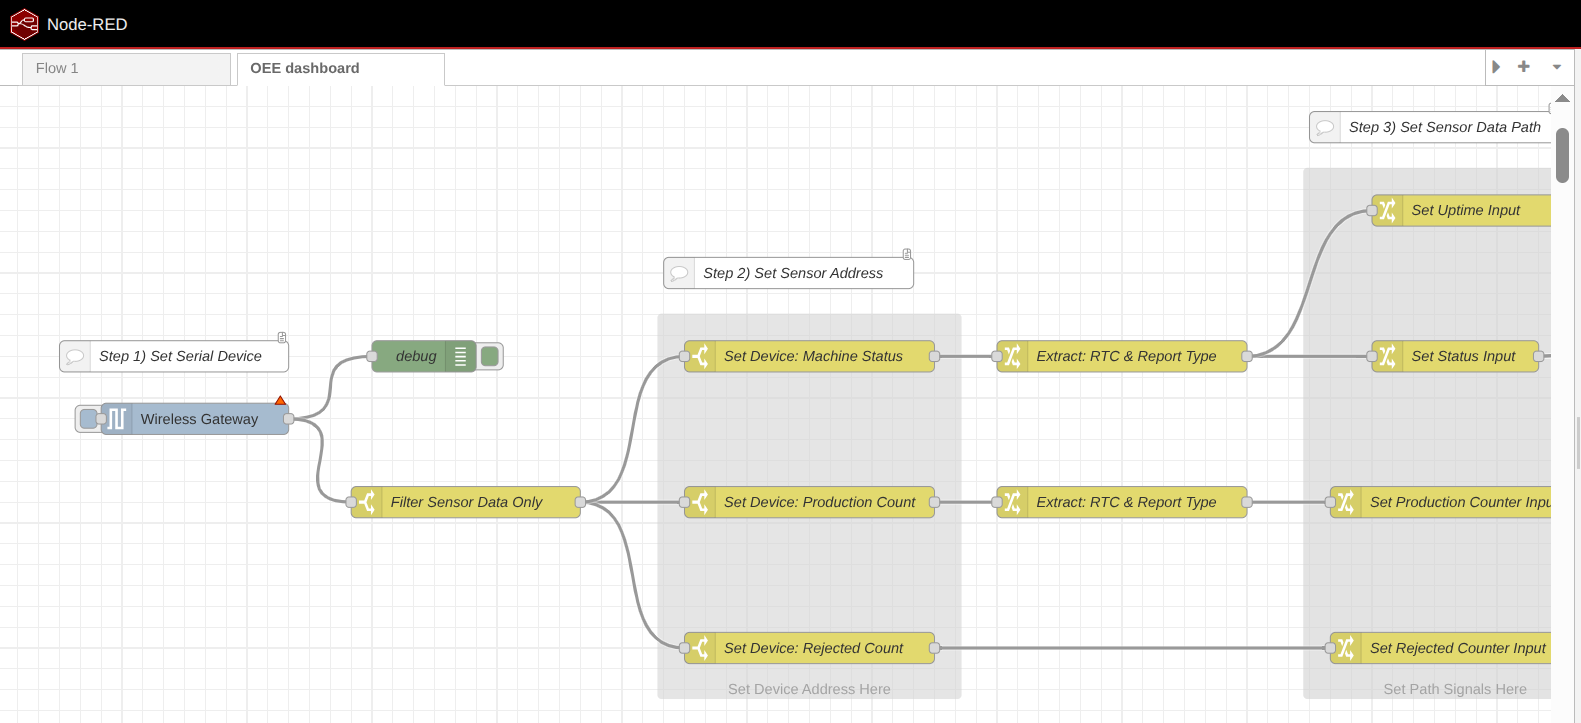
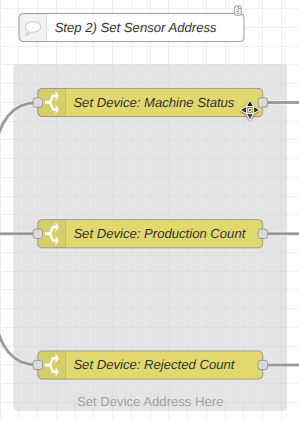
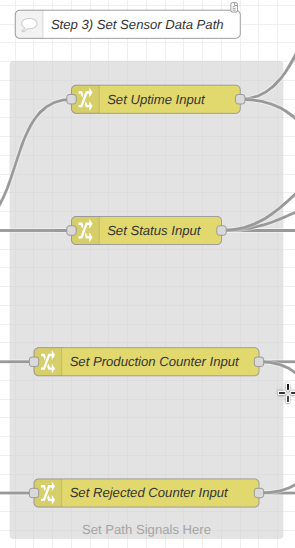
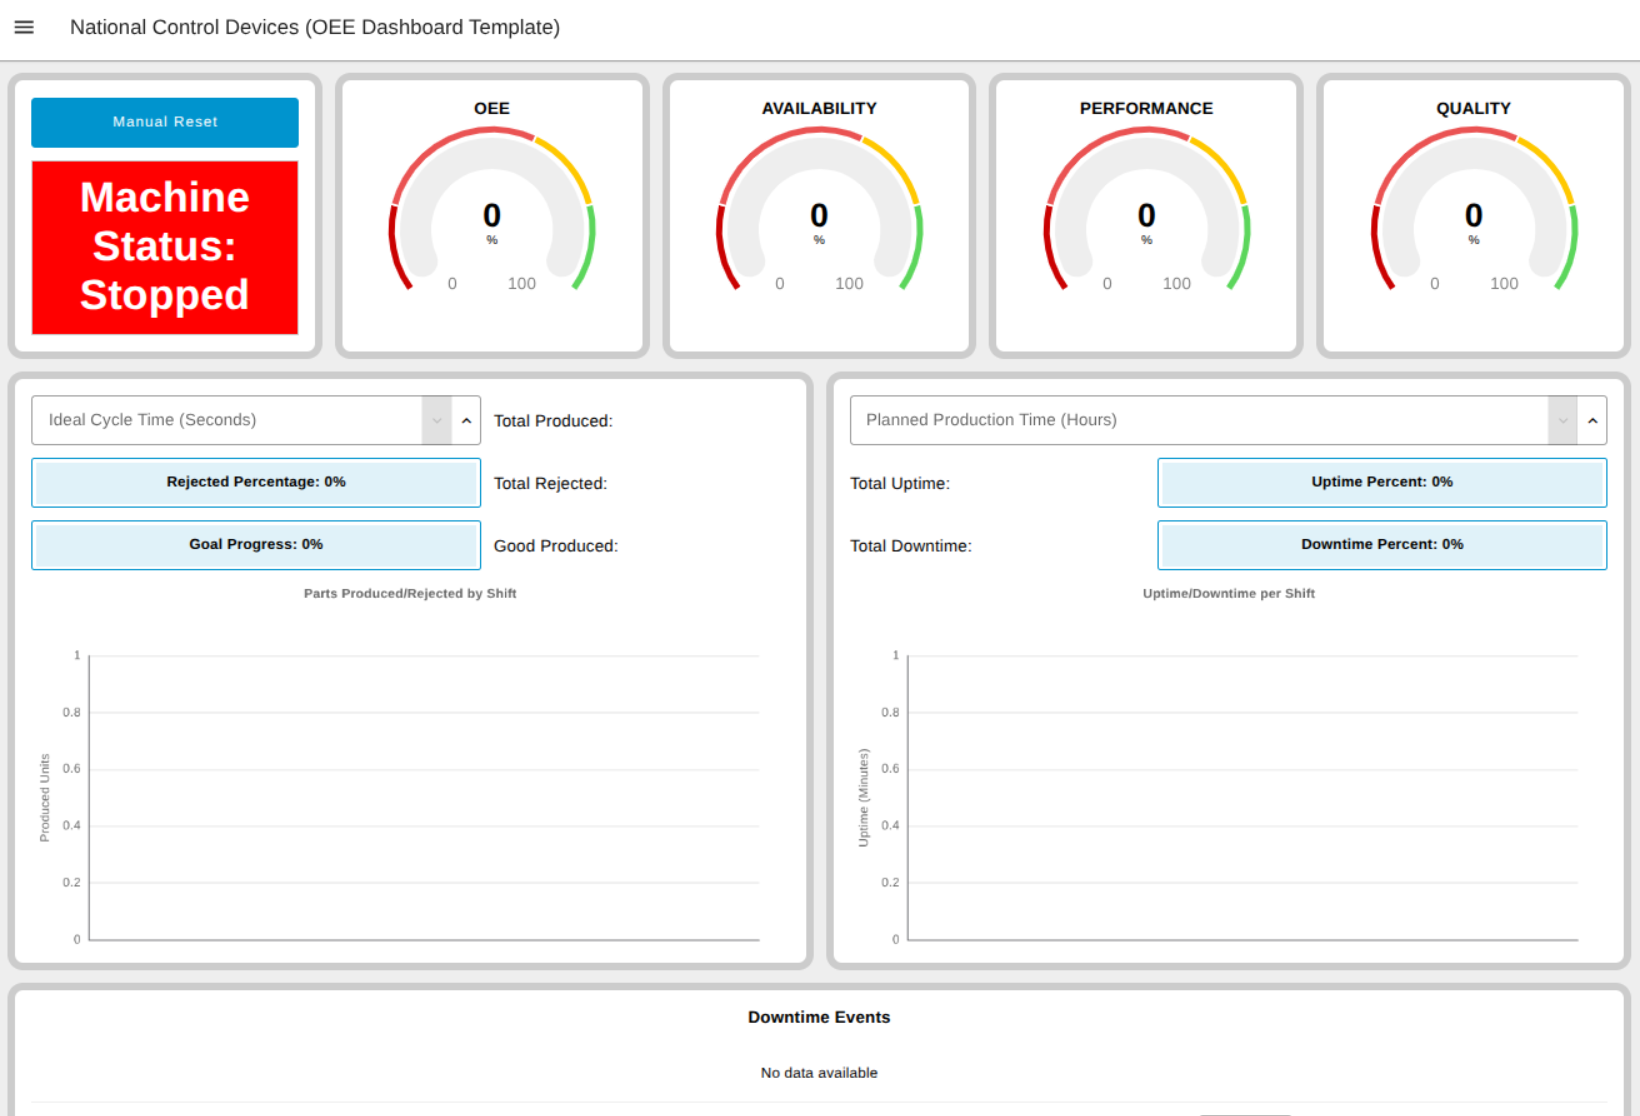
Detects the presence of AC current to determine if the machine is ON or OFF. Triggers an immediate state change (Interrupt).
|
Current Machine Status.
(Input_ct)
|
|
Main AC Electric Motor
|
CT Current Probe
|
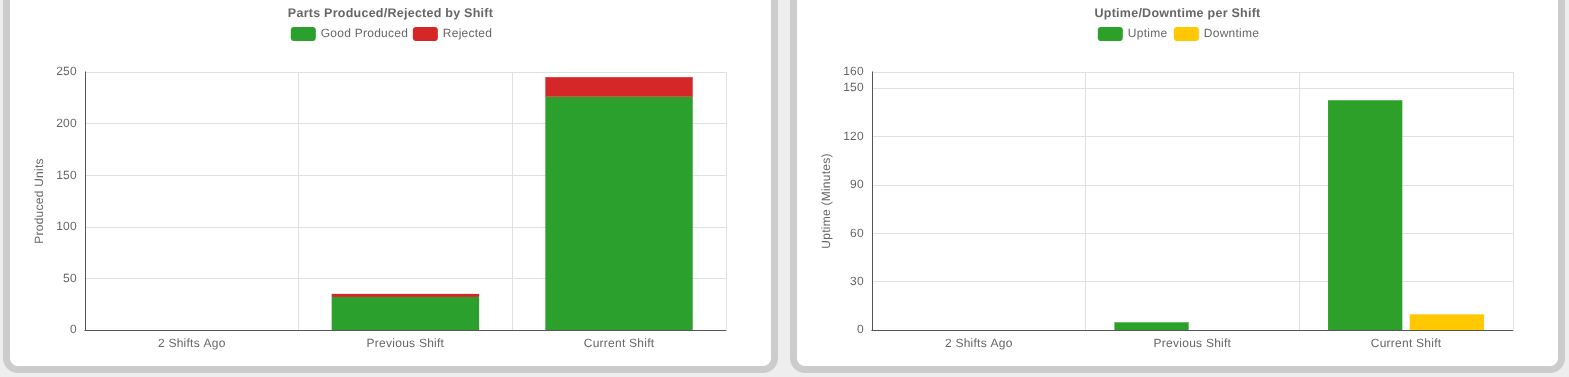
Measures the duration the AC current is present to calculate the total runtime in seconds.
|
Machine Uptime in Seconds
(ct_input_uptime)
|
|
Product Output
|
Photoelectric Sensor
|
Detects individual units as they pass the sensor and increments the counter.
|
Production Counter
(opto_input_counter)
|
|
Reject Bin / Station
|
Contact Closure
|
Detects a signal (e.g., switch, manual button or reject gate) and increments the counter for each rejected unit.
|
Rejected Counter
(digital_input_counter)
|
|
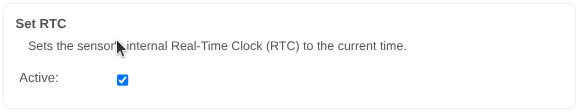
NCD Sensor Internal
|
Real-Time Clock
|
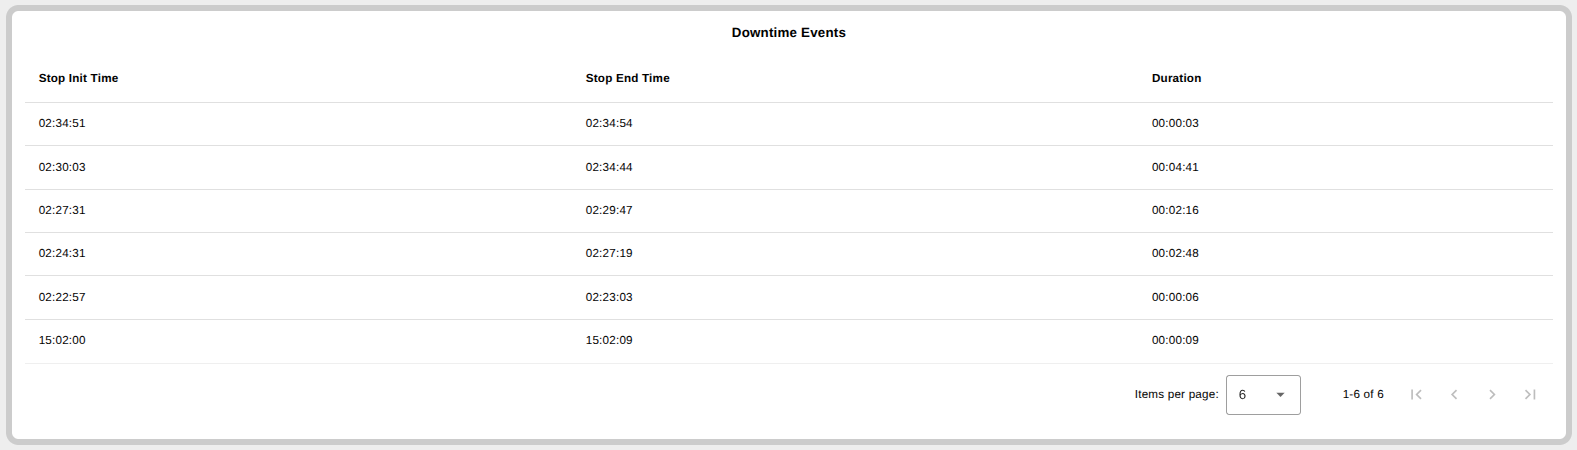
Provides the timestamp for every data transmission. Essential for calculating downtime duration and logging event history.
|
Time Reference
(rtc)
|