

IoT Wireless 3-Channel Production Counter (OEE)
Long-range wireless pulse counter with three opto-isolated digital inputs for tracking production cycles and machine uptime. Counts pulses from photo eyes, break-beam sensors, proximity switches, or dry/wet contact closures and reports counter, uptime, and input-state data over the long-range wireless network to an Atrium IIoT Gateway — the raw data behind OEE (Overall Equipment Effectiveness).
01Overview
The NCD IoT Wireless 3-Channel Production Counter is a long-range wireless transmitter with three independent, opto-isolated digital inputs. Each input counts pulses — a part passing a photo eye, a press cycle, a button push, a contact closure — and independently tracks how long that input stays active (uptime). It transmits per-channel counter values, uptime, and live input states at user-defined intervals over the long-range wireless network to an Atrium IIoT Gateway. Counter and uptime data are the two raw inputs behind OEE (Overall Equipment Effectiveness): counts feed the Performance and Quality factors, while uptime feeds Availability.
The counter ships in one enclosure with a choice of wireless module frequency, selected at time of order to match your region and range needs. All variants share the same inputs, firmware, and Atrium integration.
| Wireless Module | 900 MHz (North & South America) | 868 MHz (Europe) | 2.4 GHz (Worldwide) |
|---|---|---|---|
| Frequency | 902–928 MHz | 863–870 MHz | ISM 2.4 GHz |
| Transmit power | Up to 24 dBm | Up to 13 dBm ERP | Up to 8 dBm |
| Receiver sensitivity | –101 dBm @ 200 Kbps | –106 dBm @ 80 Kbps | –103 dBm @ 250 Kbps |
| Line-of-sight range | ~2 miles | ~2 miles | ~1 mile |
| Encryption | 128-bit AES | 128-bit AES | 128-bit AES |
What’s in the Box
- IoT Wireless 3-Channel Production Counter in an IP65 enclosure with wireless module installed
- Antenna with RP-SMA connector (868–900 MHz dipole, or 2.4 GHz dipole, matching the selected module)
- U.FL to RP-SMA pigtail cable adapter
- 3.6 V 16,000 mAh single D-cell (LR20) battery pack with supercapacitor (power switch ships in the OFF position)
- Mounting hardware
02Specifications
Full technical specifications. All wireless-module variants share the same inputs, enclosure, battery, and Atrium integration; only the radio frequency and range differ (see the Overview comparison table).
| Parameter | Specification |
|---|---|
| Input Channels | 3 × independent, opto-isolated digital inputs |
| Compatible Sensors | Break-beam sensor, photo eye, reflector sensor, dry contact closure, wet contact closure (PNP or NPN output) |
| Input Voltage Range | 3.3 V to 24 V (opto-isolated) |
| Edge Detection | Per-channel, configurable: count on rising or falling edge of the input pulse |
| Input Debounce | Configurable, default 10 ms (filters mechanical contact noise) |
| Counter Range | 1 to 4,294,967,295 events per channel (32-bit) |
| Uptime Tracking | Per-channel active time in seconds since last reset |
| Connector | M12 8-pin (optional connector or cable add-on) |
| Frequency / Range | 900 MHz (~2 mi) / 868 MHz (~2 mi) / 2.4 GHz (~1 mi) — selected at order |
| Encryption | 128-bit AES |
| Reporting Interval | 5 seconds to 16,777,215 seconds (default 600 seconds) |
| Power Failover | Automatic — falls back to the internal battery if external power is interrupted |
| Power Supply | 3.6 V 16,000 mAh single D-cell (LR20) battery or external 12–24 V DC power supply — both supported (3-position switch: ON BAT / OFF / ON EXT) |
| Battery | 3.6 V 16,000 mAh single D-cell (LR20) with supercapacitor (ships in OFF position) |
| Battery Life | Up to 5 years — varies with reporting interval, environment, and temperature. Estimate for your configuration with the battery life calculator. |
| Enclosure Rating | IP65; NEMA 1, 2, 4, 4X, 12, 13; UL-508 |
| Dimensions | 3.54 in W × 4.52 in L × 2.16 in H |
| Operating Temperature (enclosure / electronics) | −40°C to 85°C |
| Operating Humidity | 0–90% RH (non-condensing) |
| Mounting | Wall-mount; optional magnetic mounting plate |
03Prerequisites
Before installing this counter, make sure you have the following in place.
Hardware Required
- NCD Atrium IIoT Gateway — powered on and connected to your local network
- IoT Wireless 3-Channel Production Counter (this unit) with antenna attached
- 3.6 V 16,000 mAh D-cell battery pack (included, switch in OFF position for shipping), or a 12–24 V DC supply for external power
- The sensors you intend to count — photo eye, break-beam, proximity switch, or contact-closure source — with an M12 connector or cable to wire them in
Software / Network
- A current version of Atrium running on your gateway
- A computer or mobile device on the same local network as the gateway
- A modern web browser (Chrome recommended)
04Mounting & Wiring
Installation has three parts: wire your sensors into the input channels, set the on-board jumpers for your sensor type, then power on and mount the enclosure.
Wiring the Inputs
Each of the three channels is opto-isolated and accepts a 3.3–24 V signal or a contact closure. Sensors connect through the M12 8-pin connector. PNP (sourcing) and NPN (sinking) output sensors are both supported — the on-board jumpers select the wiring scheme.
Powering On
-
1
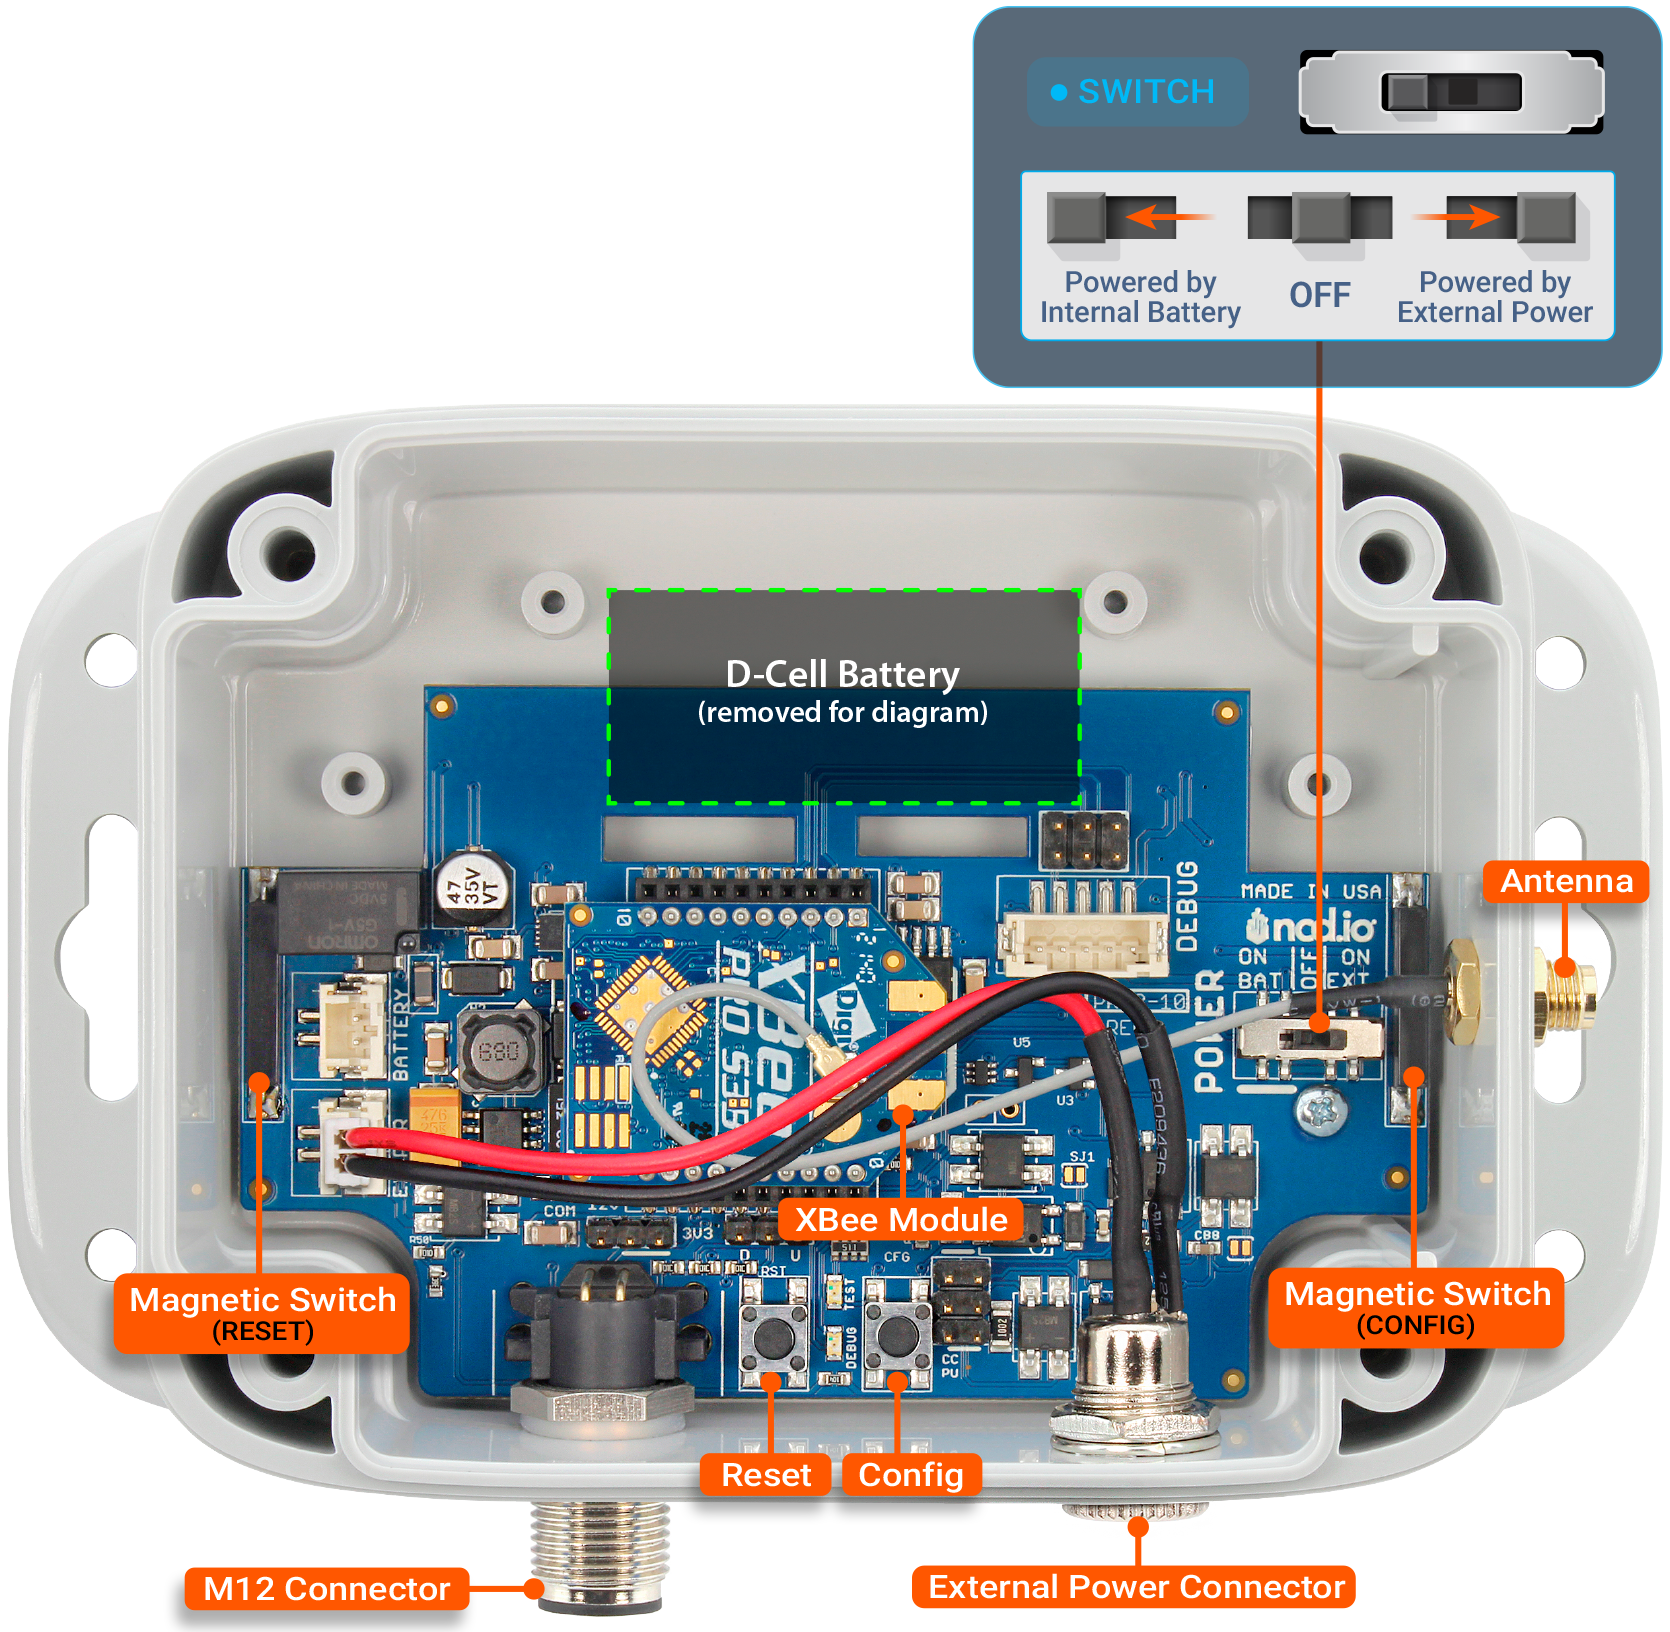
Open the enclosureRemove the four screws securing the enclosure lid and lift the cover to expose the PCB, jumpers, and power switch.
-
2
Set the jumpers and wire your inputsConfigure the three jumpers (above) for your sensor type, then land your sensor wires on the M12 connector pins you selected. Repeat for each channel you are using — unused channels can be left unconnected.
-
3
Set the power switchThe 3-position power switch ships in the center OFF position. Slide it to ON BAT to run on the internal battery, or ON EXT if you have connected a 12–24 V DC supply to the barrel connector. Press the CFG button to confirm power — the TEST LED lights while the button is held.
-
4
Close and seal the enclosureReplace the lid and tighten all four screws evenly to maintain the IP65 seal.
M12 Connector Wiring
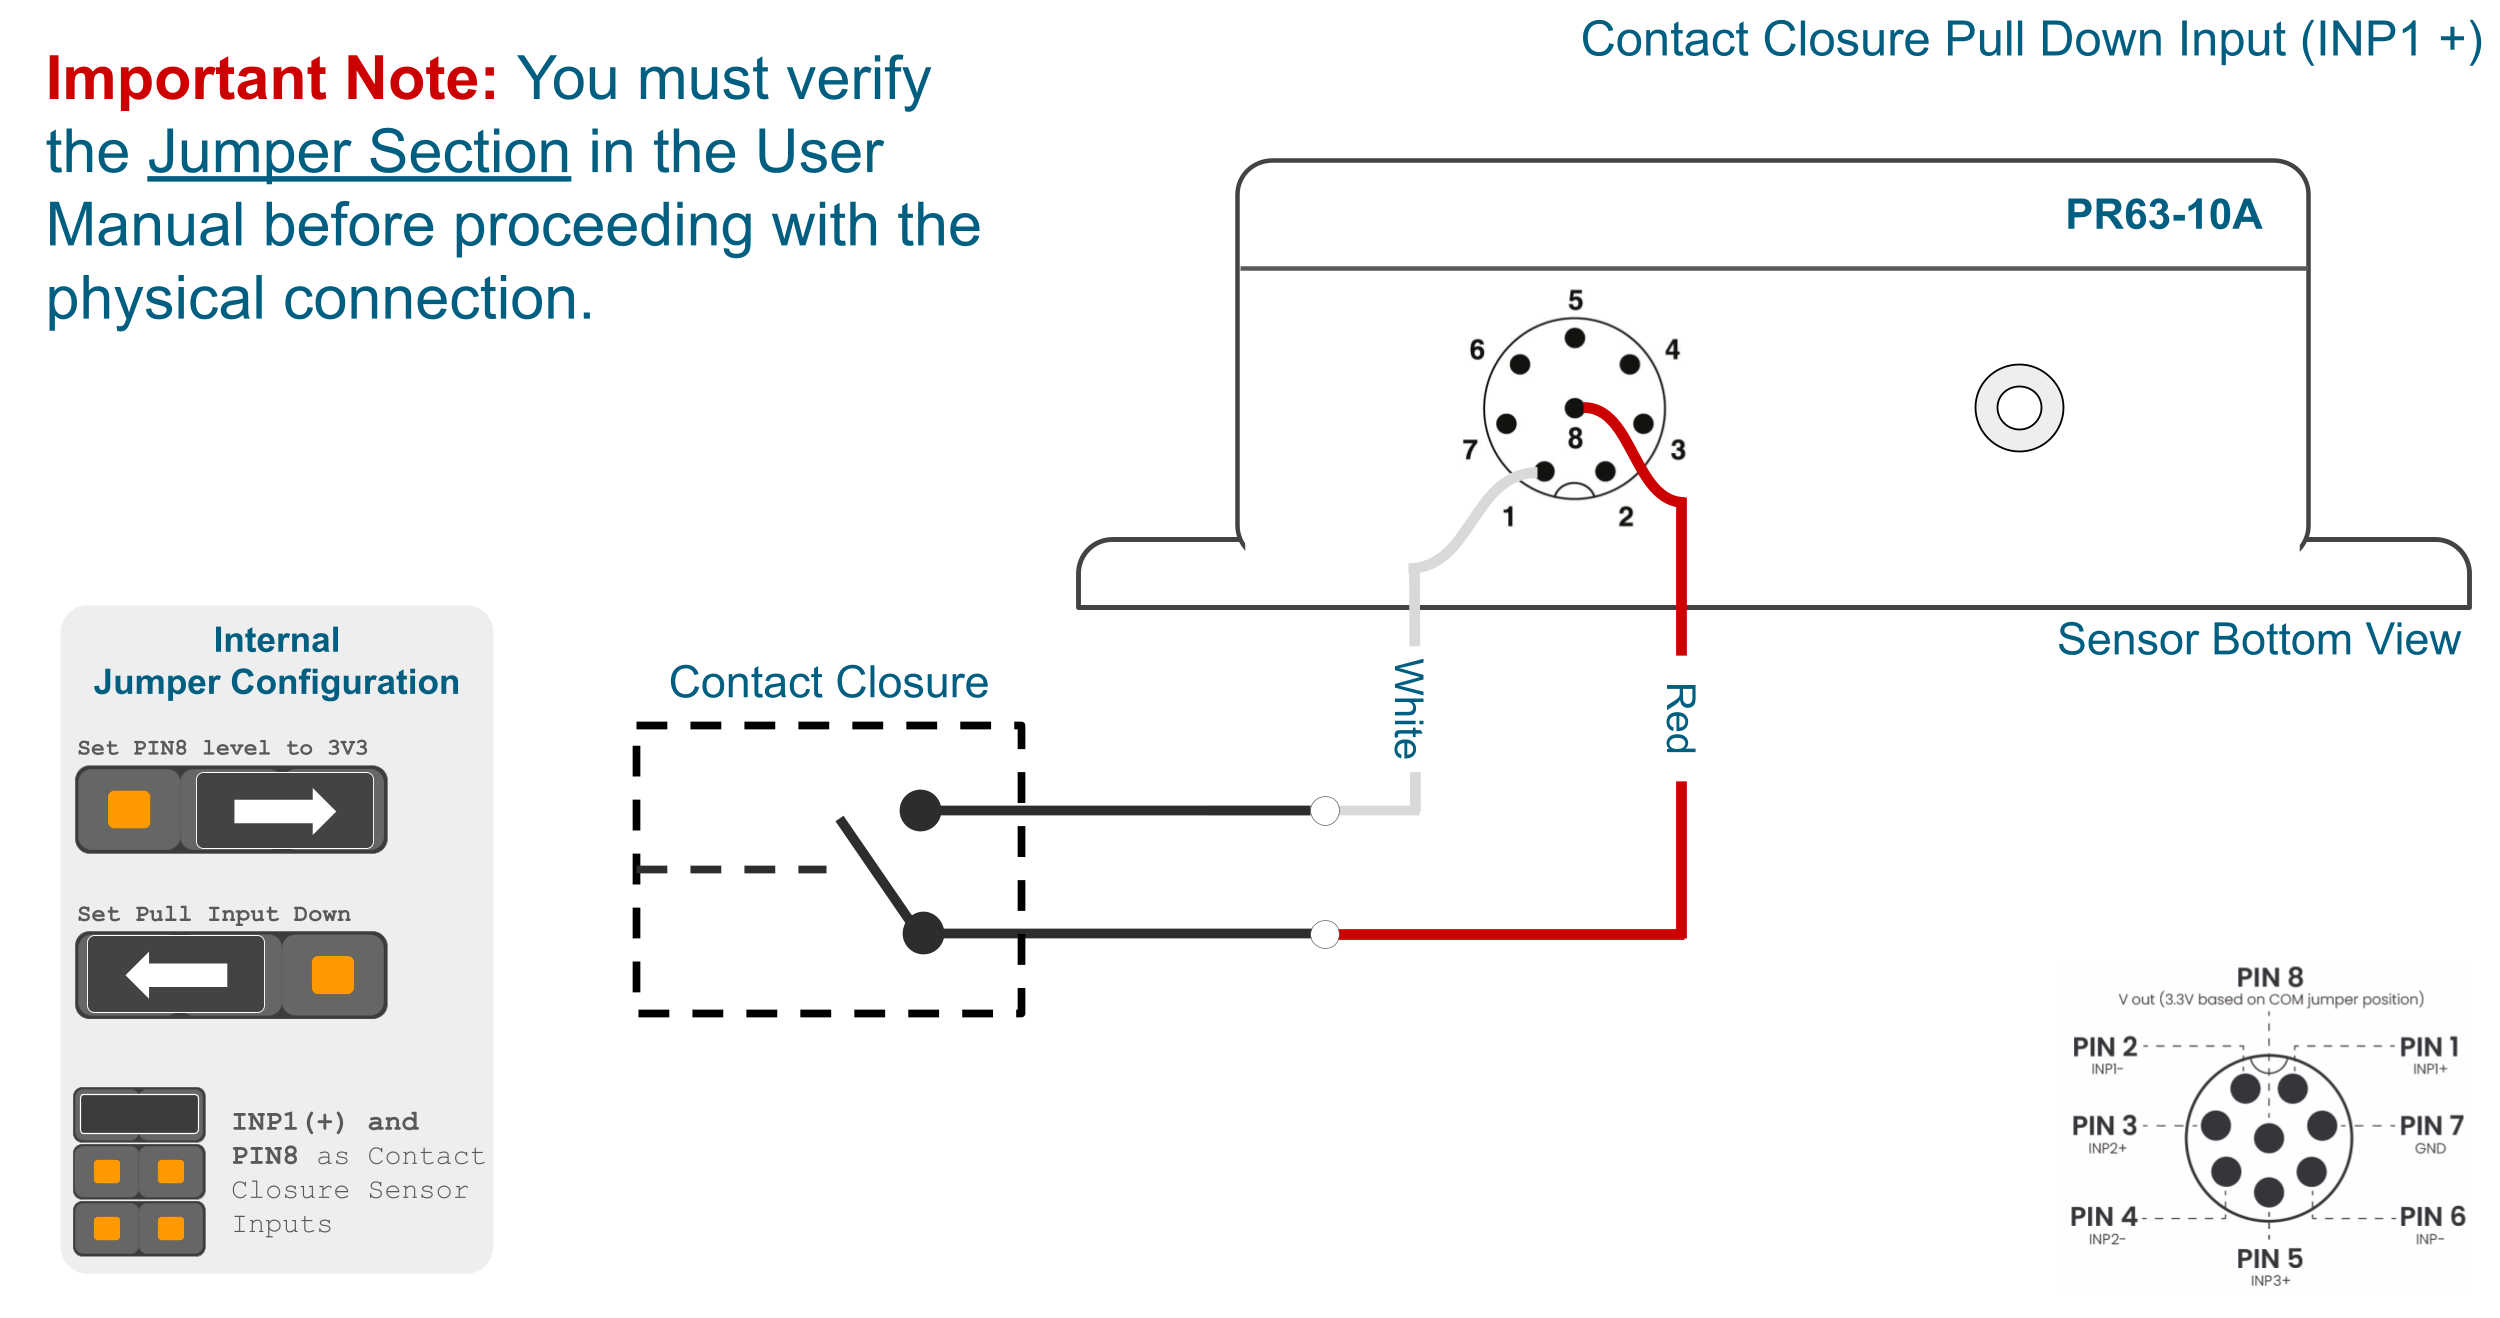
Field sensors land on the M12 8-pin connector. Each of the three inputs is a +/− pair — INP1 on PIN 1/2, INP2 on PIN 3/4, INP3 on PIN 5/6. Sensor power (V out) is on PIN 8, set to 3V3 or 12 V by the Operating Voltage (COM) jumper, with ground on PIN 7.
| M12 Pin | Function | Notes |
|---|---|---|
| PIN 1 | INP1+ (Input 1) | Channel 1 signal |
| PIN 2 | INP1− (Input 1) | Channel 1 return |
| PIN 3 | INP2+ (Input 2) | Channel 2 signal |
| PIN 4 | INP2− (Input 2) | Channel 2 return |
| PIN 5 | INP3+ (Input 3) | Channel 3 signal |
| PIN 6 | INP3− (Input 3) | Channel 3 return |
| PIN 7 | GND | Ground |
| PIN 8 | V out (+V) | Set to 3V3 or 12 V by the Operating Voltage (COM) jumper |
Break-Beam Sensor Wiring
NCD’s 3-channel break-beam sensors use the standard 3-wire color scheme — Brown = +V, Blue = 0 V, Black = signal. Wire each sensor to its channel as follows (remember these sensors need the counter on external power):
| Sensor | Blue — 0 V | Black — signal | Brown — +V |
|---|---|---|---|
| Sensor 1 | PIN 7 | PIN 1 | PIN 8 |
| Sensor 2 | PIN 7 | PIN 3 | PIN 8 |
| Sensor 3 | PIN 7 | PIN 5 | PIN 8 |
Contact-Closure Wiring (Pull-Down)
A dry contact needs no external supply. Wire the contact between the channel’s INP+ pin and PIN 8 (V out), then set the internal jumpers so the input idles low and goes high when the contact closes:
- Operating Voltage (COM) jumper → set PIN 8 to 3V3 (or 12 V).
- Pull jumper → set to Pull Down — the input idles low; closing the contact pulls it high.
- Contact Closure Selection jumper → enable the channel’s INP+ and PIN 8 as the contact-closure inputs.
Example (Input 1): wire the contact between PIN 1 (INP1+) and PIN 8. Use PIN 3 for Input 2 and PIN 5 for Input 3. Set Edge Detection to count on the closing (rising) edge.
Mounting the Enclosure
- Wall-mount: Use the enclosure’s mounting tabs and fasteners appropriate for your surface. Position the unit so the antenna has a clear line of sight toward the gateway where possible.
- Magnet-mount: The optional magnetic mounting plate attaches to any ferrous surface — ideal for machine frames, guarding, and panels near the equipment being counted.
05Pairing with Atrium
Once powered on, the counter begins transmitting over the long-range wireless network immediately. Atrium detects it automatically. By default, new sensors are held as pending (blacklisted) until confirmed — the setup wizard whitelists them and begins logging telemetry. No radio pairing or pre-registration is required. A short guided wizard walks you through onboarding.
-
1
Power on and close the enclosureSet the power switch to ON BAT or ON EXT, then close the lid. Within one reporting interval (default 600 seconds, i.e. 10 minutes), Atrium will detect it. You can also press RESET and wait ~15 seconds to force an immediate transmission.
-
2
Open Atrium and go to SensorsNavigate to your gateway’s local address (e.g.
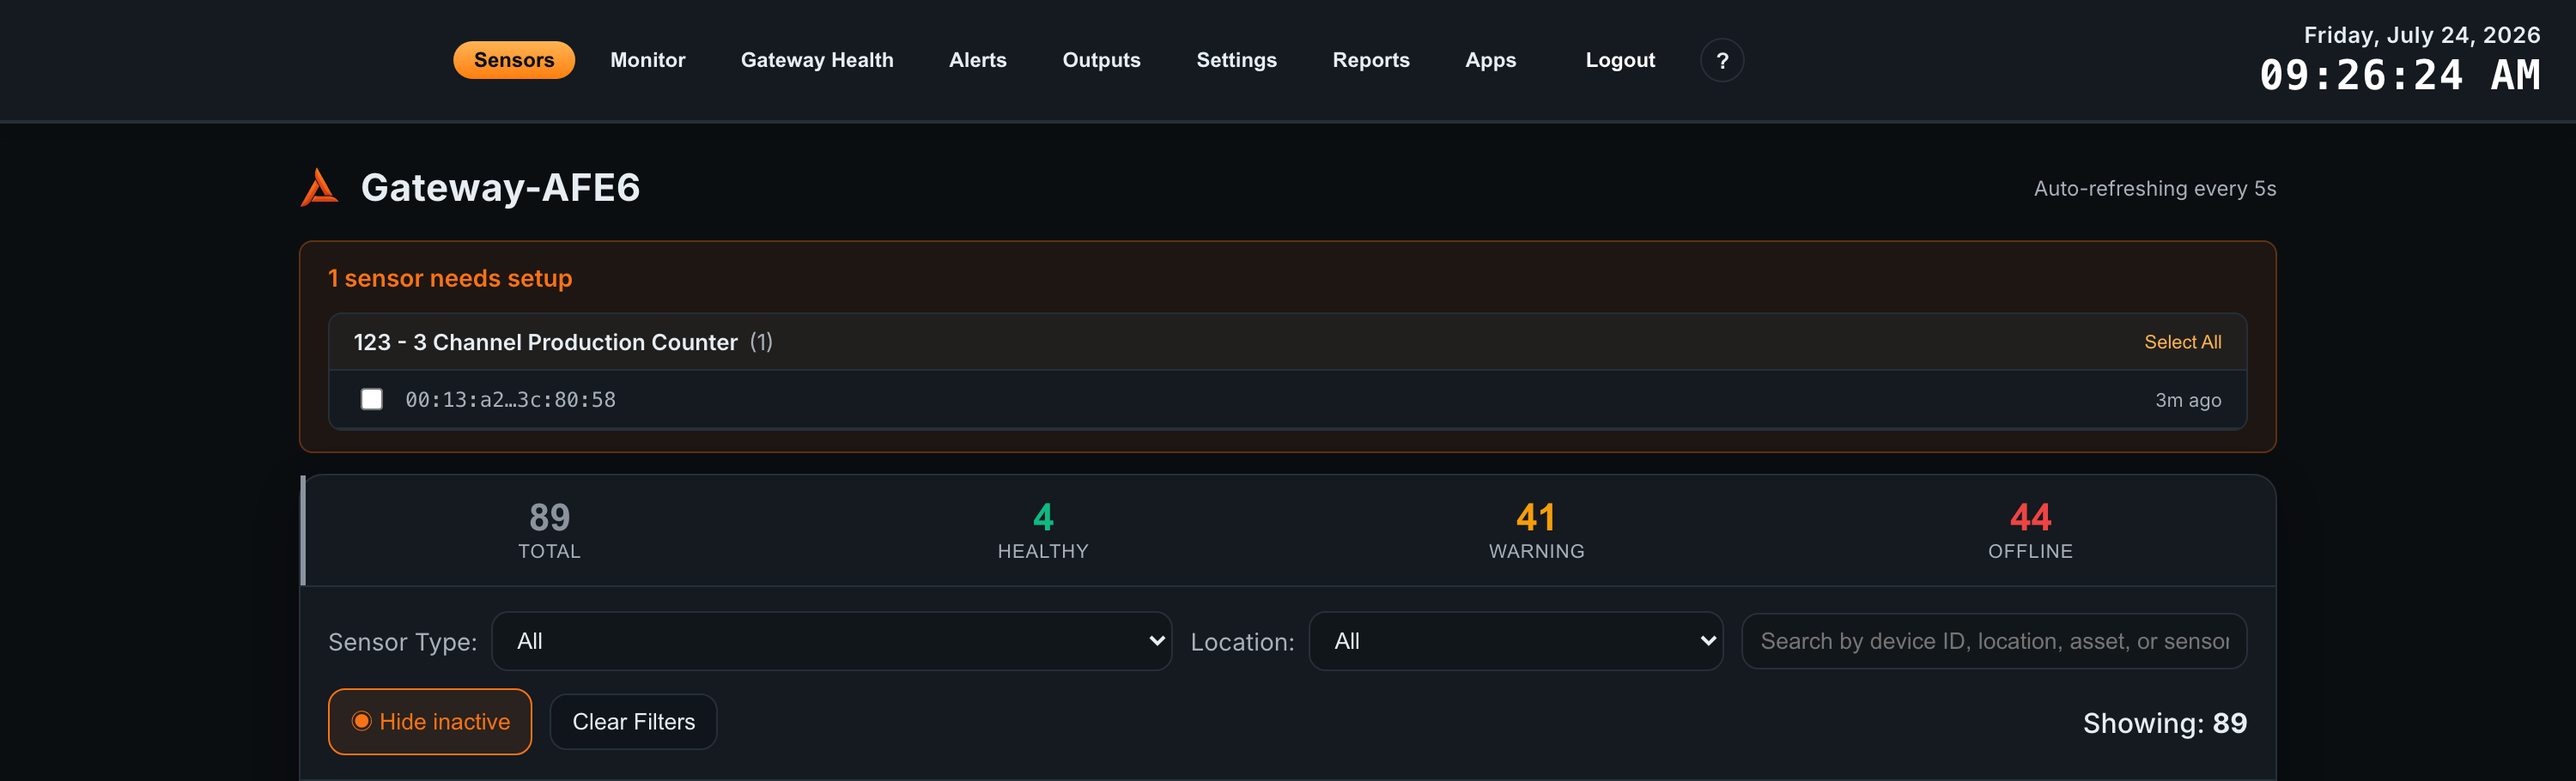
http://ncd-[last-4-of-MAC].local) and click Sensors in the top navigation. A banner shows “X sensors need setup” with detected sensors grouped by type. Your counter appears under the 123 – 3 Channel Production Counter type group. -
3
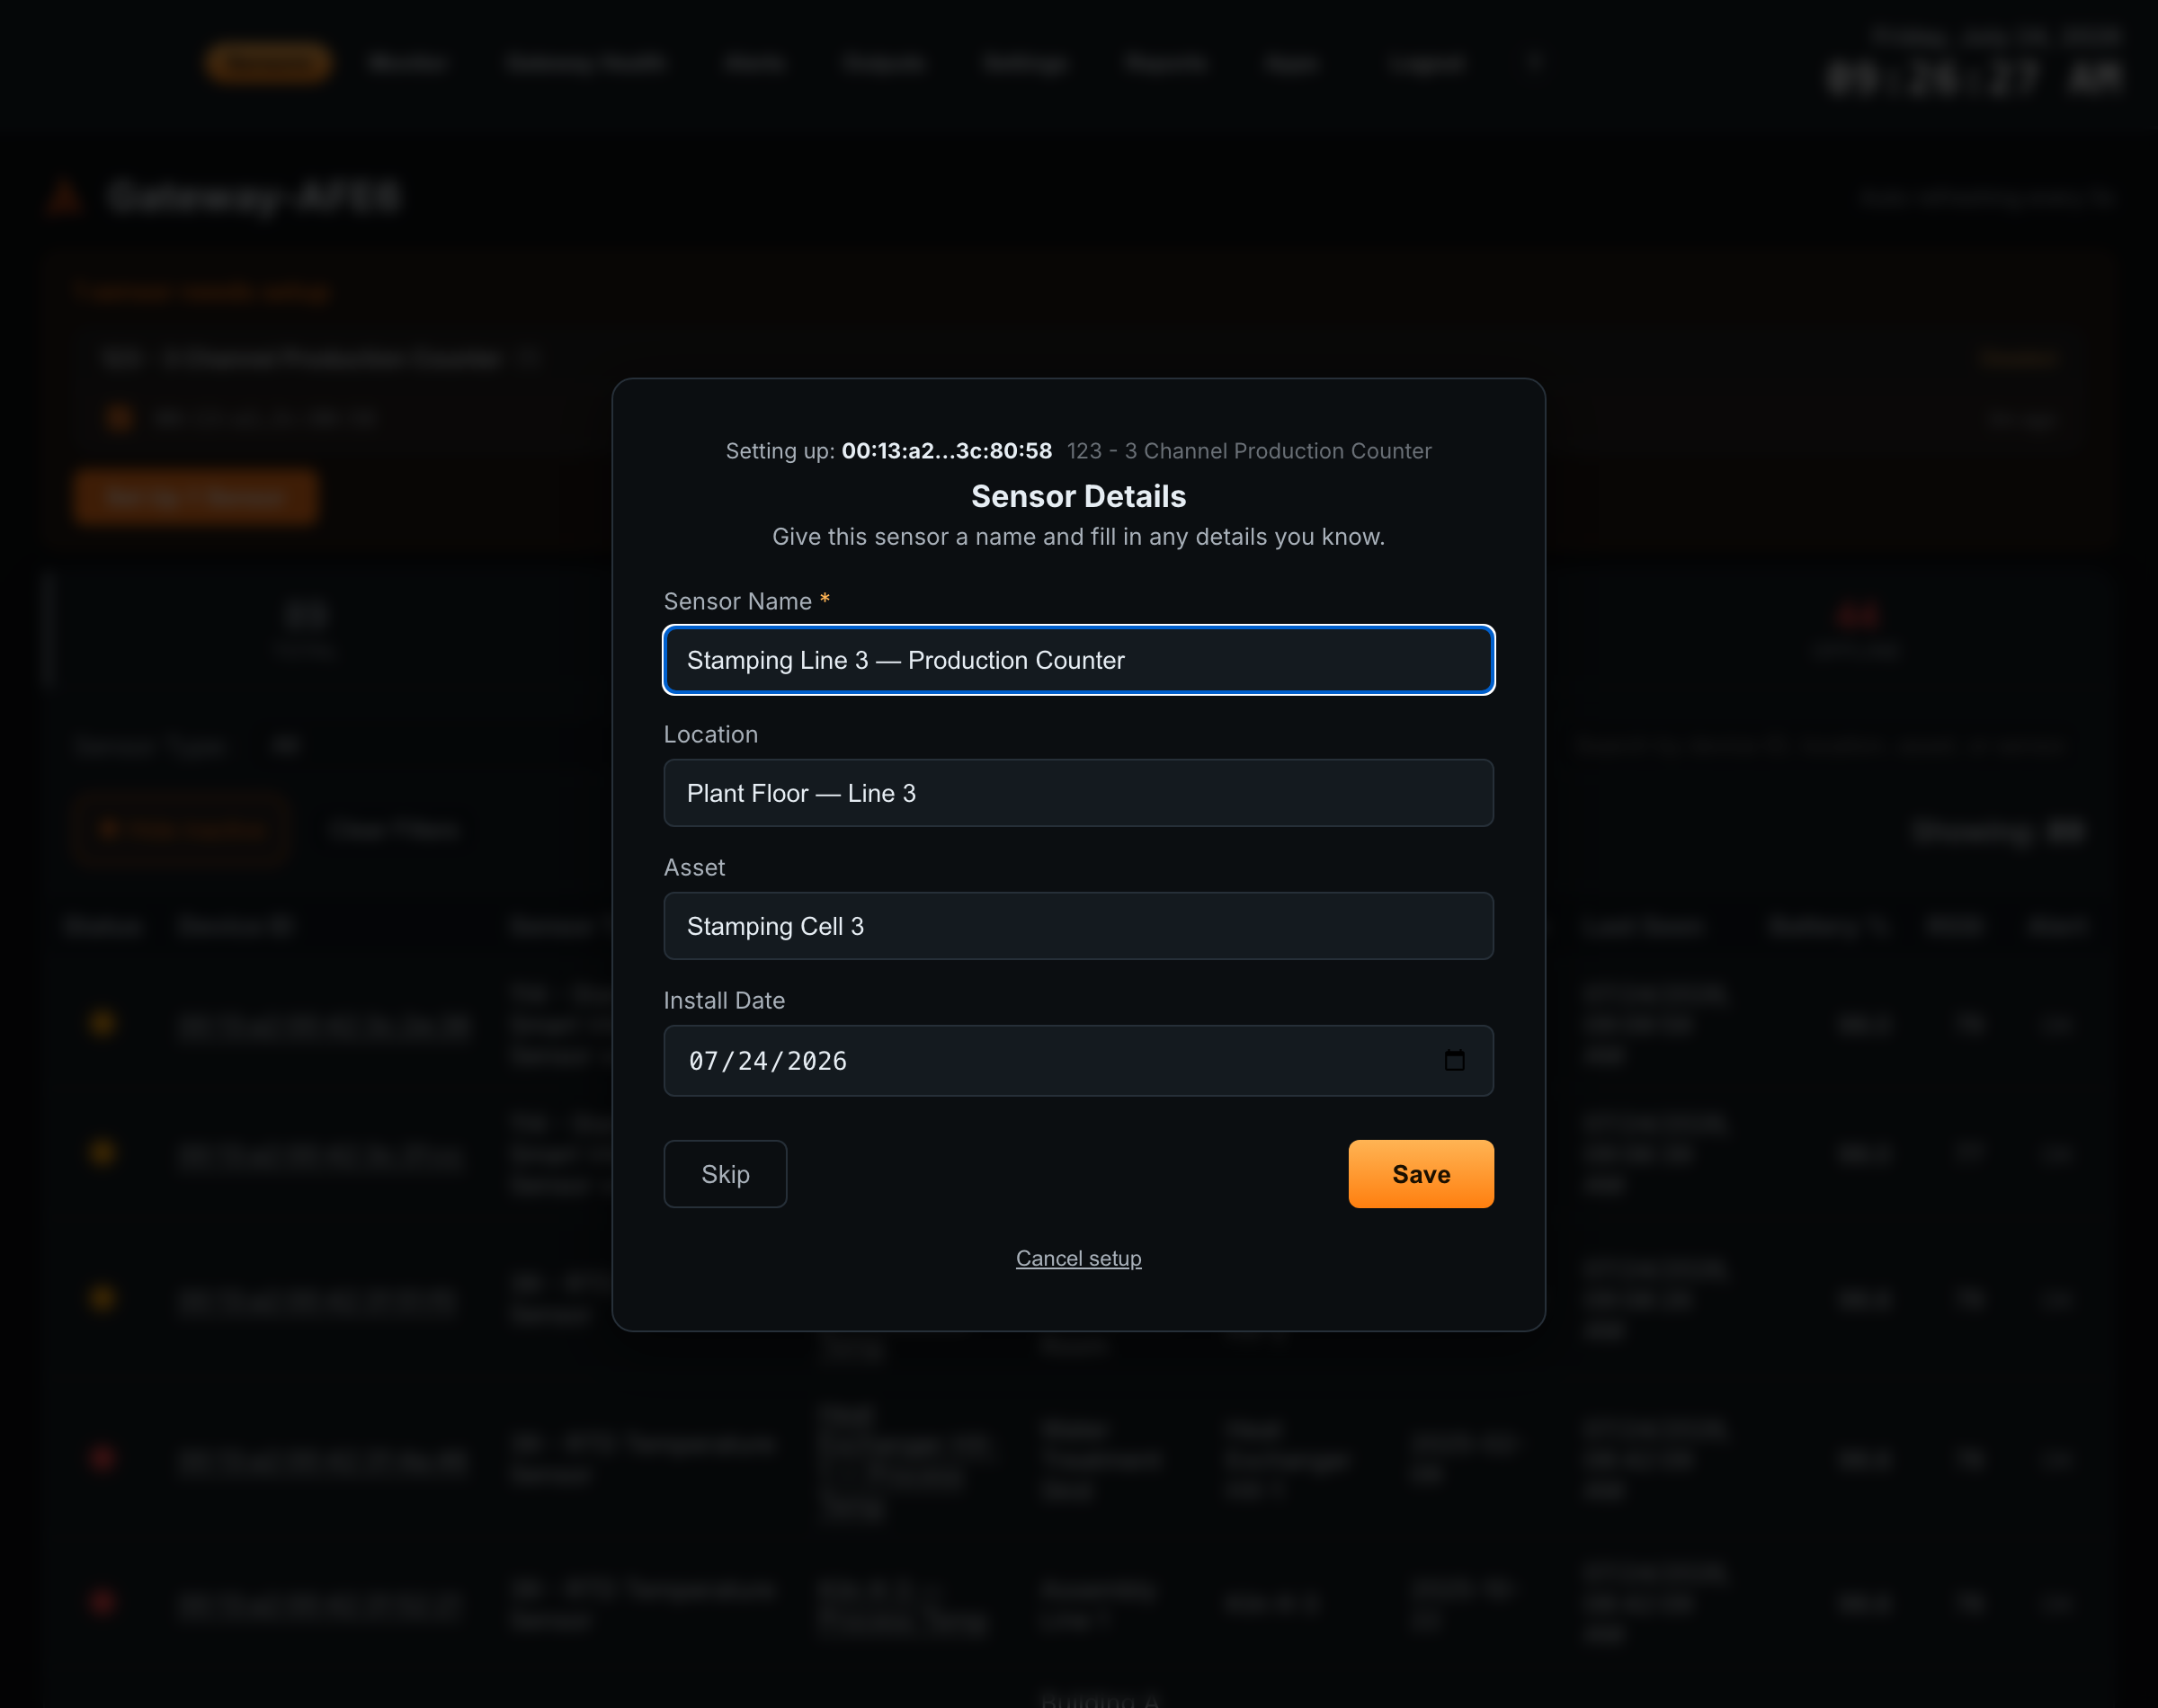
Launch the sensor setup wizardClick Set Up on the counter in the banner to open the per-sensor Sensor Details wizard. Use Save & Next to step through each field, Save to commit without advancing, or Skip to onboard manually later.
-
4
Select sensors to set upThe Set Up Your Sensors step lists all detected sensors with checkboxes, pre-selected by default. Deselect any you don’t want to add, then click Set Up [X] Sensors.
-
5
Name and locate the counterClick the sensor in the Sensors table to open its configuration. On the Sensor Meta tab, enter a Sensor Name, Asset (the machine or line it monitors), and Location. See Section 6 for full details.
06Sensor Meta
The Sensor Meta tab controls how Atrium identifies and tracks this counter. Access it via Sensors → [your sensor] → Configure → Sensor Meta.
| Field | Description |
|---|---|
| Sensor Status | Whitelisted — data is logged and displayed. Blacklisted — data is ignored. |
| Sensor Name | Human-readable label shown throughout the Atrium interface (e.g. “Line 2 Press Counter”). |
| Asset | The machine or production line this counter is monitoring (e.g. “Stamping Press 4”). |
| Location | Physical location of the equipment (e.g. “Building A — Line 2”). |
| Report Interval (seconds) | Must match the Delay value in Sensor Hardware Settings. Atrium marks the sensor offline if no data is received within 2× this value. |
| Install Date | Optional. Records when the counter was deployed. |
| Offline Alert | When enabled, Atrium sends an email notification if the counter stops reporting. Requires email configured in Settings → Gateway Configuration. |
07Metric Configuration
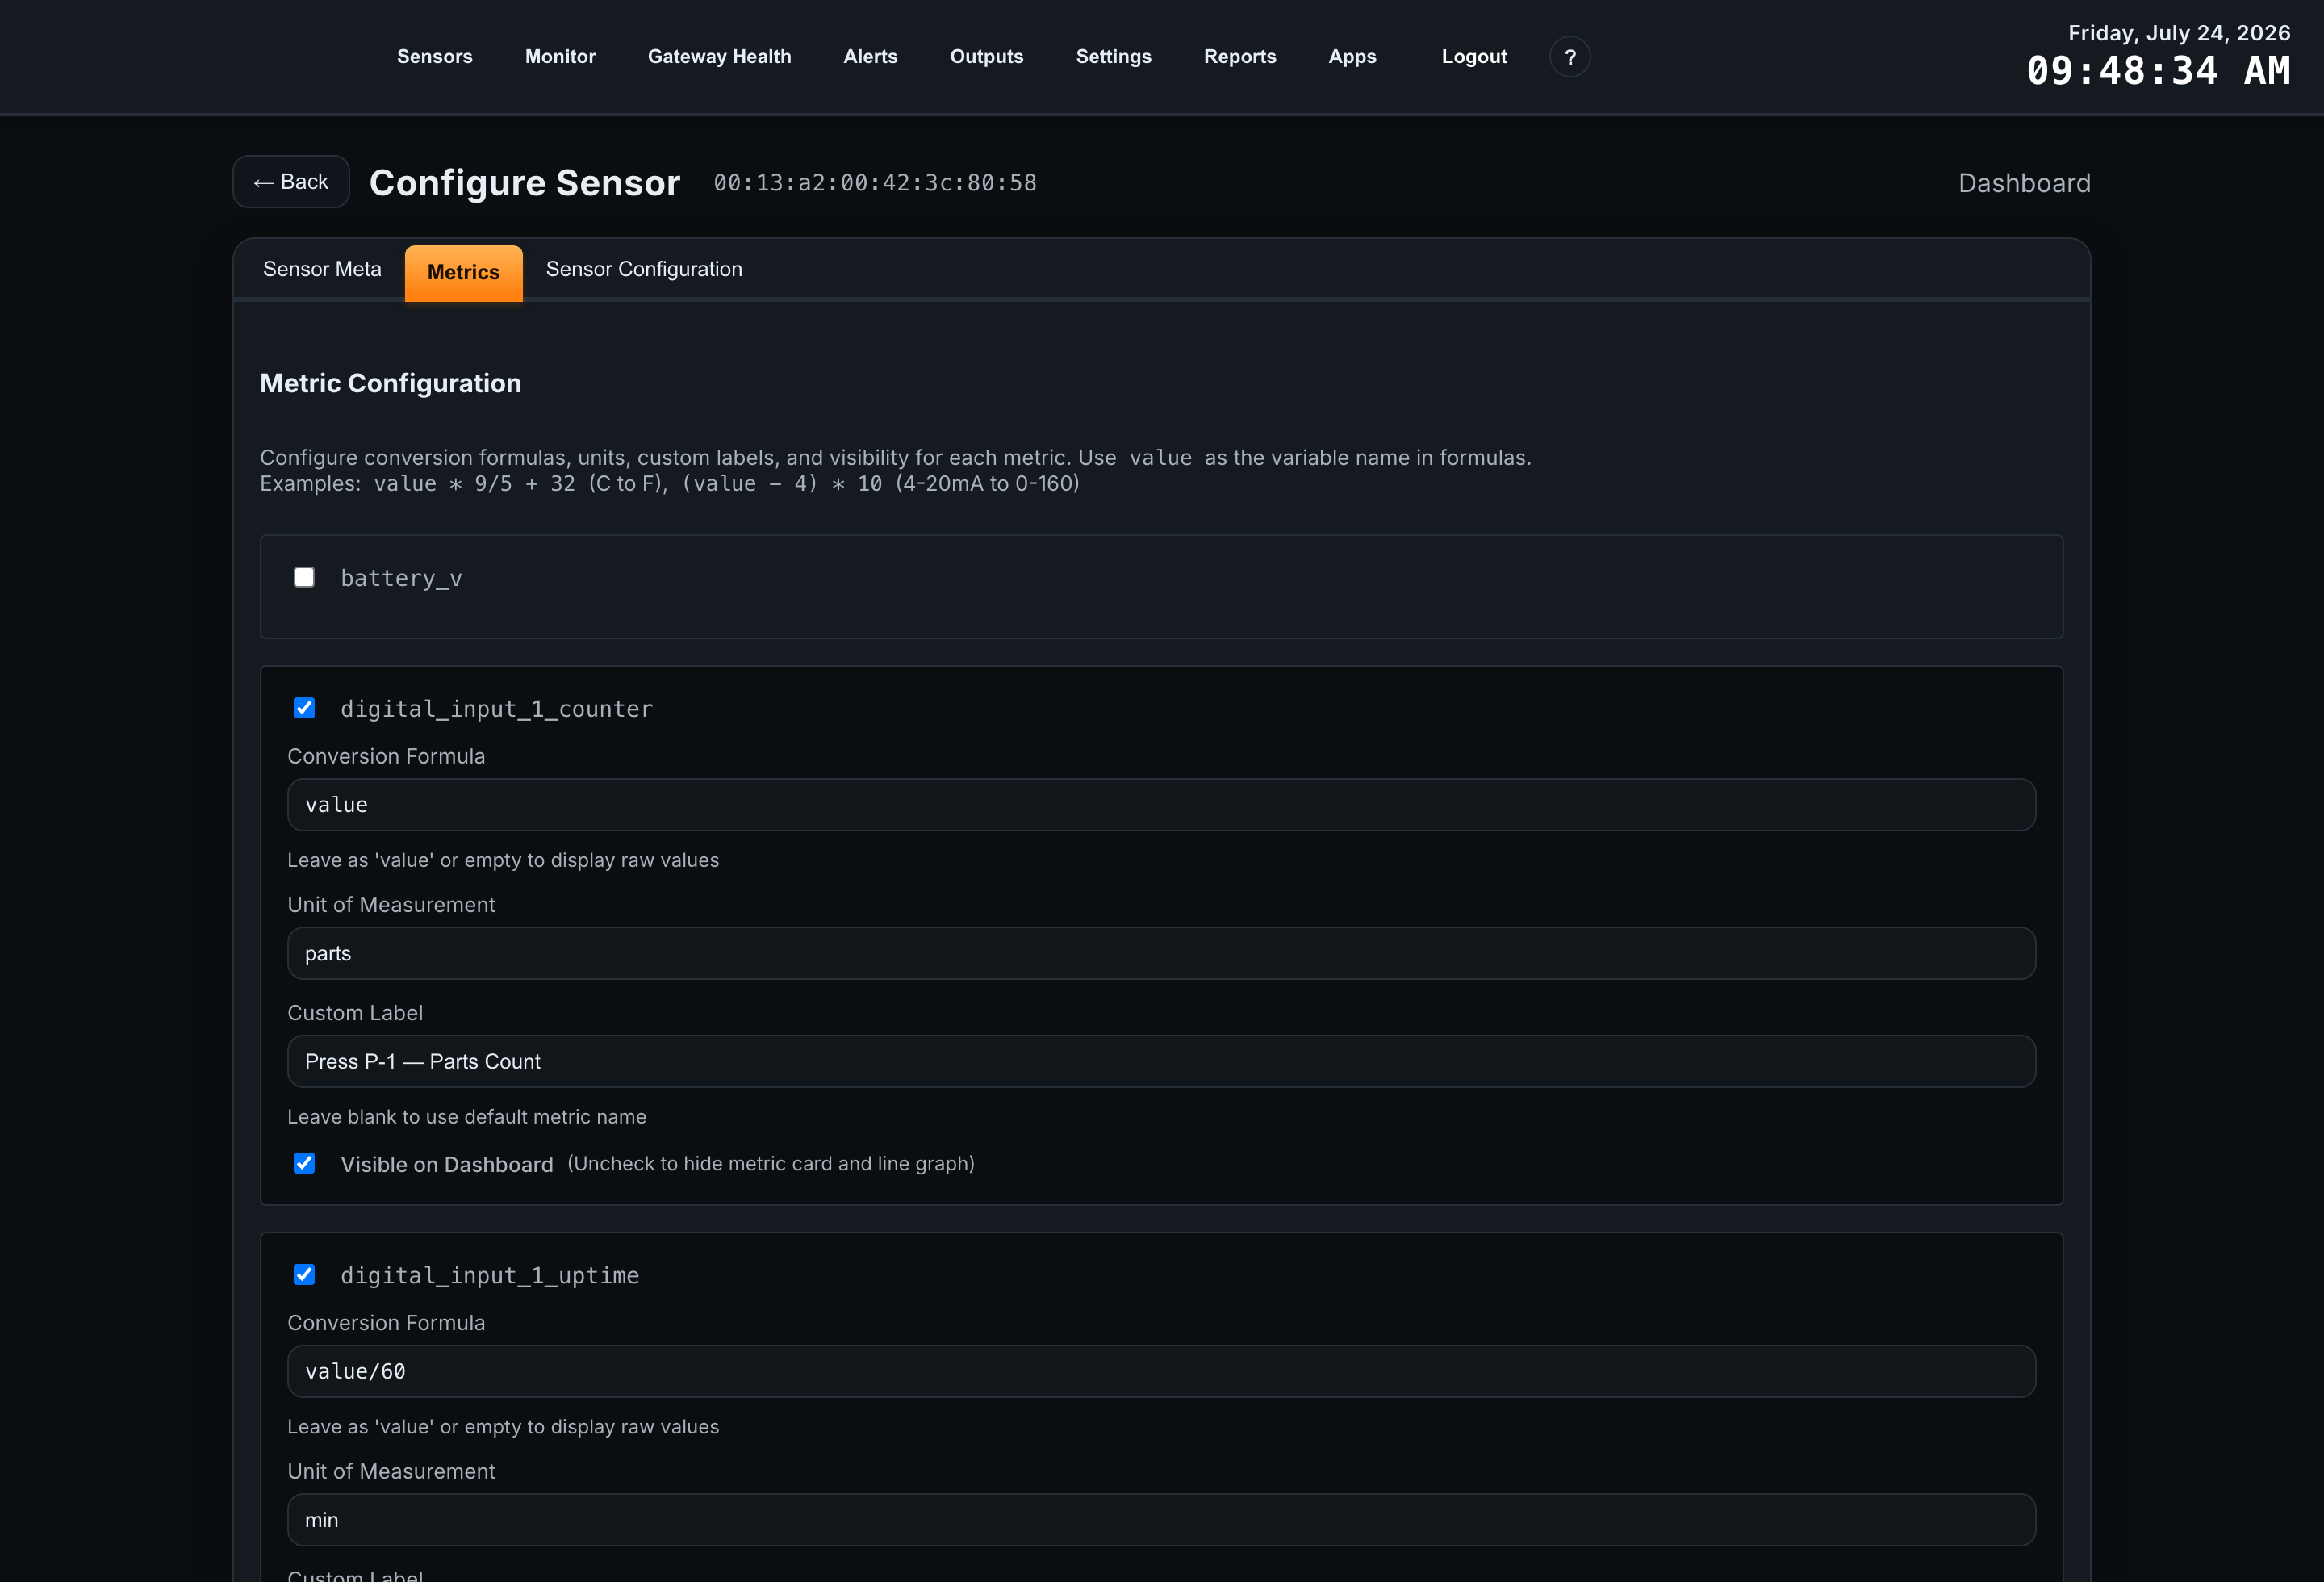
The Metrics tab lets you configure conversion formulas, units, custom labels, and dashboard visibility for each data channel. Access it via Configure → Metrics.
This counter exposes the following metrics — a counter and an uptime value for each of the three inputs, the live state of each input, plus device health and a transmission descriptor:
| Metric | Raw Data | Description | Visible by Default |
|---|---|---|---|
digital_input_1_counter | Integer (0–4,294,967,295) | Cumulative cycle count on input 1 since last reset | Yes |
digital_input_1_uptime | Seconds | Time input 1 remained active since last reset | Yes |
digital_input_2_counter | Integer | Cumulative cycle count on input 2 since last reset | Yes |
digital_input_2_uptime | Seconds | Time input 2 remained active since last reset | Yes |
digital_input_3_counter | Integer | Cumulative cycle count on input 3 since last reset | Yes |
digital_input_3_uptime | Seconds | Time input 3 remained active since last reset | Yes |
input_1 / input_2 / input_3 | HIGH / LOW | Current logical state of each input at time of transmission | Yes |
report_type | Regular / Shift End / Interrupt / Threshold | Why this transmission was sent (see Section 9) | Yes |
battery_pct | Battery percentage (%) | Estimated remaining battery capacity | Yes |
battery_v | Volts | Raw battery voltage (separate field from battery_pct) | Optional |
Custom Conversion Formulas
Each metric supports a custom conversion formula using value as the variable name. Leave the formula as value or blank to display raw data. This is useful for converting a raw cycle count into a production unit. Examples:
value / 12              // 12 counts = 1 finished carton
value * 2               // each cycle produces 2 parts
value / 3600            // convert an uptime in seconds to hours
Custom Labels & Visibility
Each metric can be assigned a Custom Label (e.g. “Line 2 Good Parts” or “Press Run Time”) that replaces the default metric name throughout Atrium — strongly recommended so the three channels read clearly on the dashboard. Unchecking Visible on Dashboard hides that metric’s card and chart without deleting data; hide any unused input channels to keep the dashboard clean.
08Hardware Settings
Hardware settings control the counter’s on-board configuration — reporting interval, network addressing, input behavior, and counting thresholds. Default values shown below are served from the NCD config-options API where Atrium exposes them and may vary by firmware version — confirm against your unit. Shift schedules and production targets for this counter are configured in Atrium’s Productivity Monitor app (see Section 9).
| Setting | Default | Description |
|---|---|---|
| Network ID | 7fff | The wireless network ID. Must match the gateway’s network ID for the counter to communicate. |
| Destination Address | 0000ffff | The broadcast address the counter transmits to. Typically left at default unless using a custom mesh topology. |
| Node ID | 0 | Optional human-readable node identifier within the mesh network. |
| Delay (Reporting Interval) | 600 | Regular transmission interval in seconds (range 5 to 16,777,215). Lower values increase data frequency at the cost of battery life. |
| Input Debounce Time | 10 ms | Ignores input transitions shorter than this window — filters mechanical contact bounce. Raise it for noisy contacts, lower it for fast cycles. |
| Edge Detection | Per channel | Selects whether each channel counts on the rising or falling edge of the input pulse. Confirm the firmware default for your unit via config-options. |
| Counter Threshold | 0 (disabled) | When set, the counter sends a Threshold report each time a channel count reaches a multiple of this value — useful for “every N parts” alerting. |
| Push Notification | Disabled | When enabled, the counter sends an immediate Interrupt report on a detected input change rather than waiting for the next interval. |
Adjusting the Reporting Interval
-
1
Go to Sensor ConfigurationNavigate to Sensors → [your sensor] → Configure → Sensor Configuration.
-
2
Update the Delay valueEnter your desired interval in seconds. The minimum is 5 seconds, but very short intervals on battery power significantly reduce battery life.
-
3
Click Save Hardware SettingsThe new value is staged and will be pushed to the counter on its next transmission.
-
4
Update the Report Interval in Sensor MetaUpdate the Report Interval on the Sensor Meta tab to match your new Delay value so offline detection stays accurate.
Battery life depends almost entirely on how often the counter transmits — more frequent reporting and continuous high-rate counting shorten it. Advertised life is up to 5 years; estimate the life for your specific reporting interval and battery with NCD’s battery life calculator.
09Shifts, Targets & the Productivity Monitor
For OEE, counts and uptime are usually measured per shift rather than as a single ever-growing total. The counter can automatically reset its per-channel counters and uptime at scheduled shift-change times and emits a Shift End report at each reset — giving you a clean per-shift record without manual intervention. Shift schedules and production targets are configured in Atrium’s Productivity Monitor app, covered below.
| Setting | Default | Description |
|---|---|---|
| Shift Times 1–4 | 0:00 (disabled) | Up to four daily times (24-hour clock) at which the counter resets all channel counters and uptime to zero and sends a Shift End report. Leave at 0:00 to disable. |
| Reset Timeout | 60 seconds | Auto-reset interval used by the counting logic for uptime accounting. Confirm the exact behavior for your firmware via config-options. |
Understanding report_type
Every transmission carries a report_type value that tells you why the counter sent data. This is what lets you separate a routine reading from a shift boundary or an alarm condition when you analyze or export the data:
| report_type | Meaning |
|---|---|
| Regular | Scheduled transmission at the configured reporting interval (Delay). |
| Shift End | Sent at a configured Shift Time, immediately before counters and uptime reset to zero. The final per-shift totals. |
| Interrupt | Sent immediately on a detected input change when Push Notification is enabled. |
| Threshold | Sent when a channel’s count reaches a multiple of the configured Counter Threshold. |
Tracking Production in the Productivity Monitor
Atrium’s Productivity Monitor app (Apps → Productivity Monitor) turns this counter’s raw counts into live production tracking against shift quotas. Click Manage Machines → + Add Machine, set Tracking Mode to Production Counter, select this counter and its counting metric (e.g. digital_input_1_counter), then define one or more shifts with a start/end time, active days, and a unit quota.
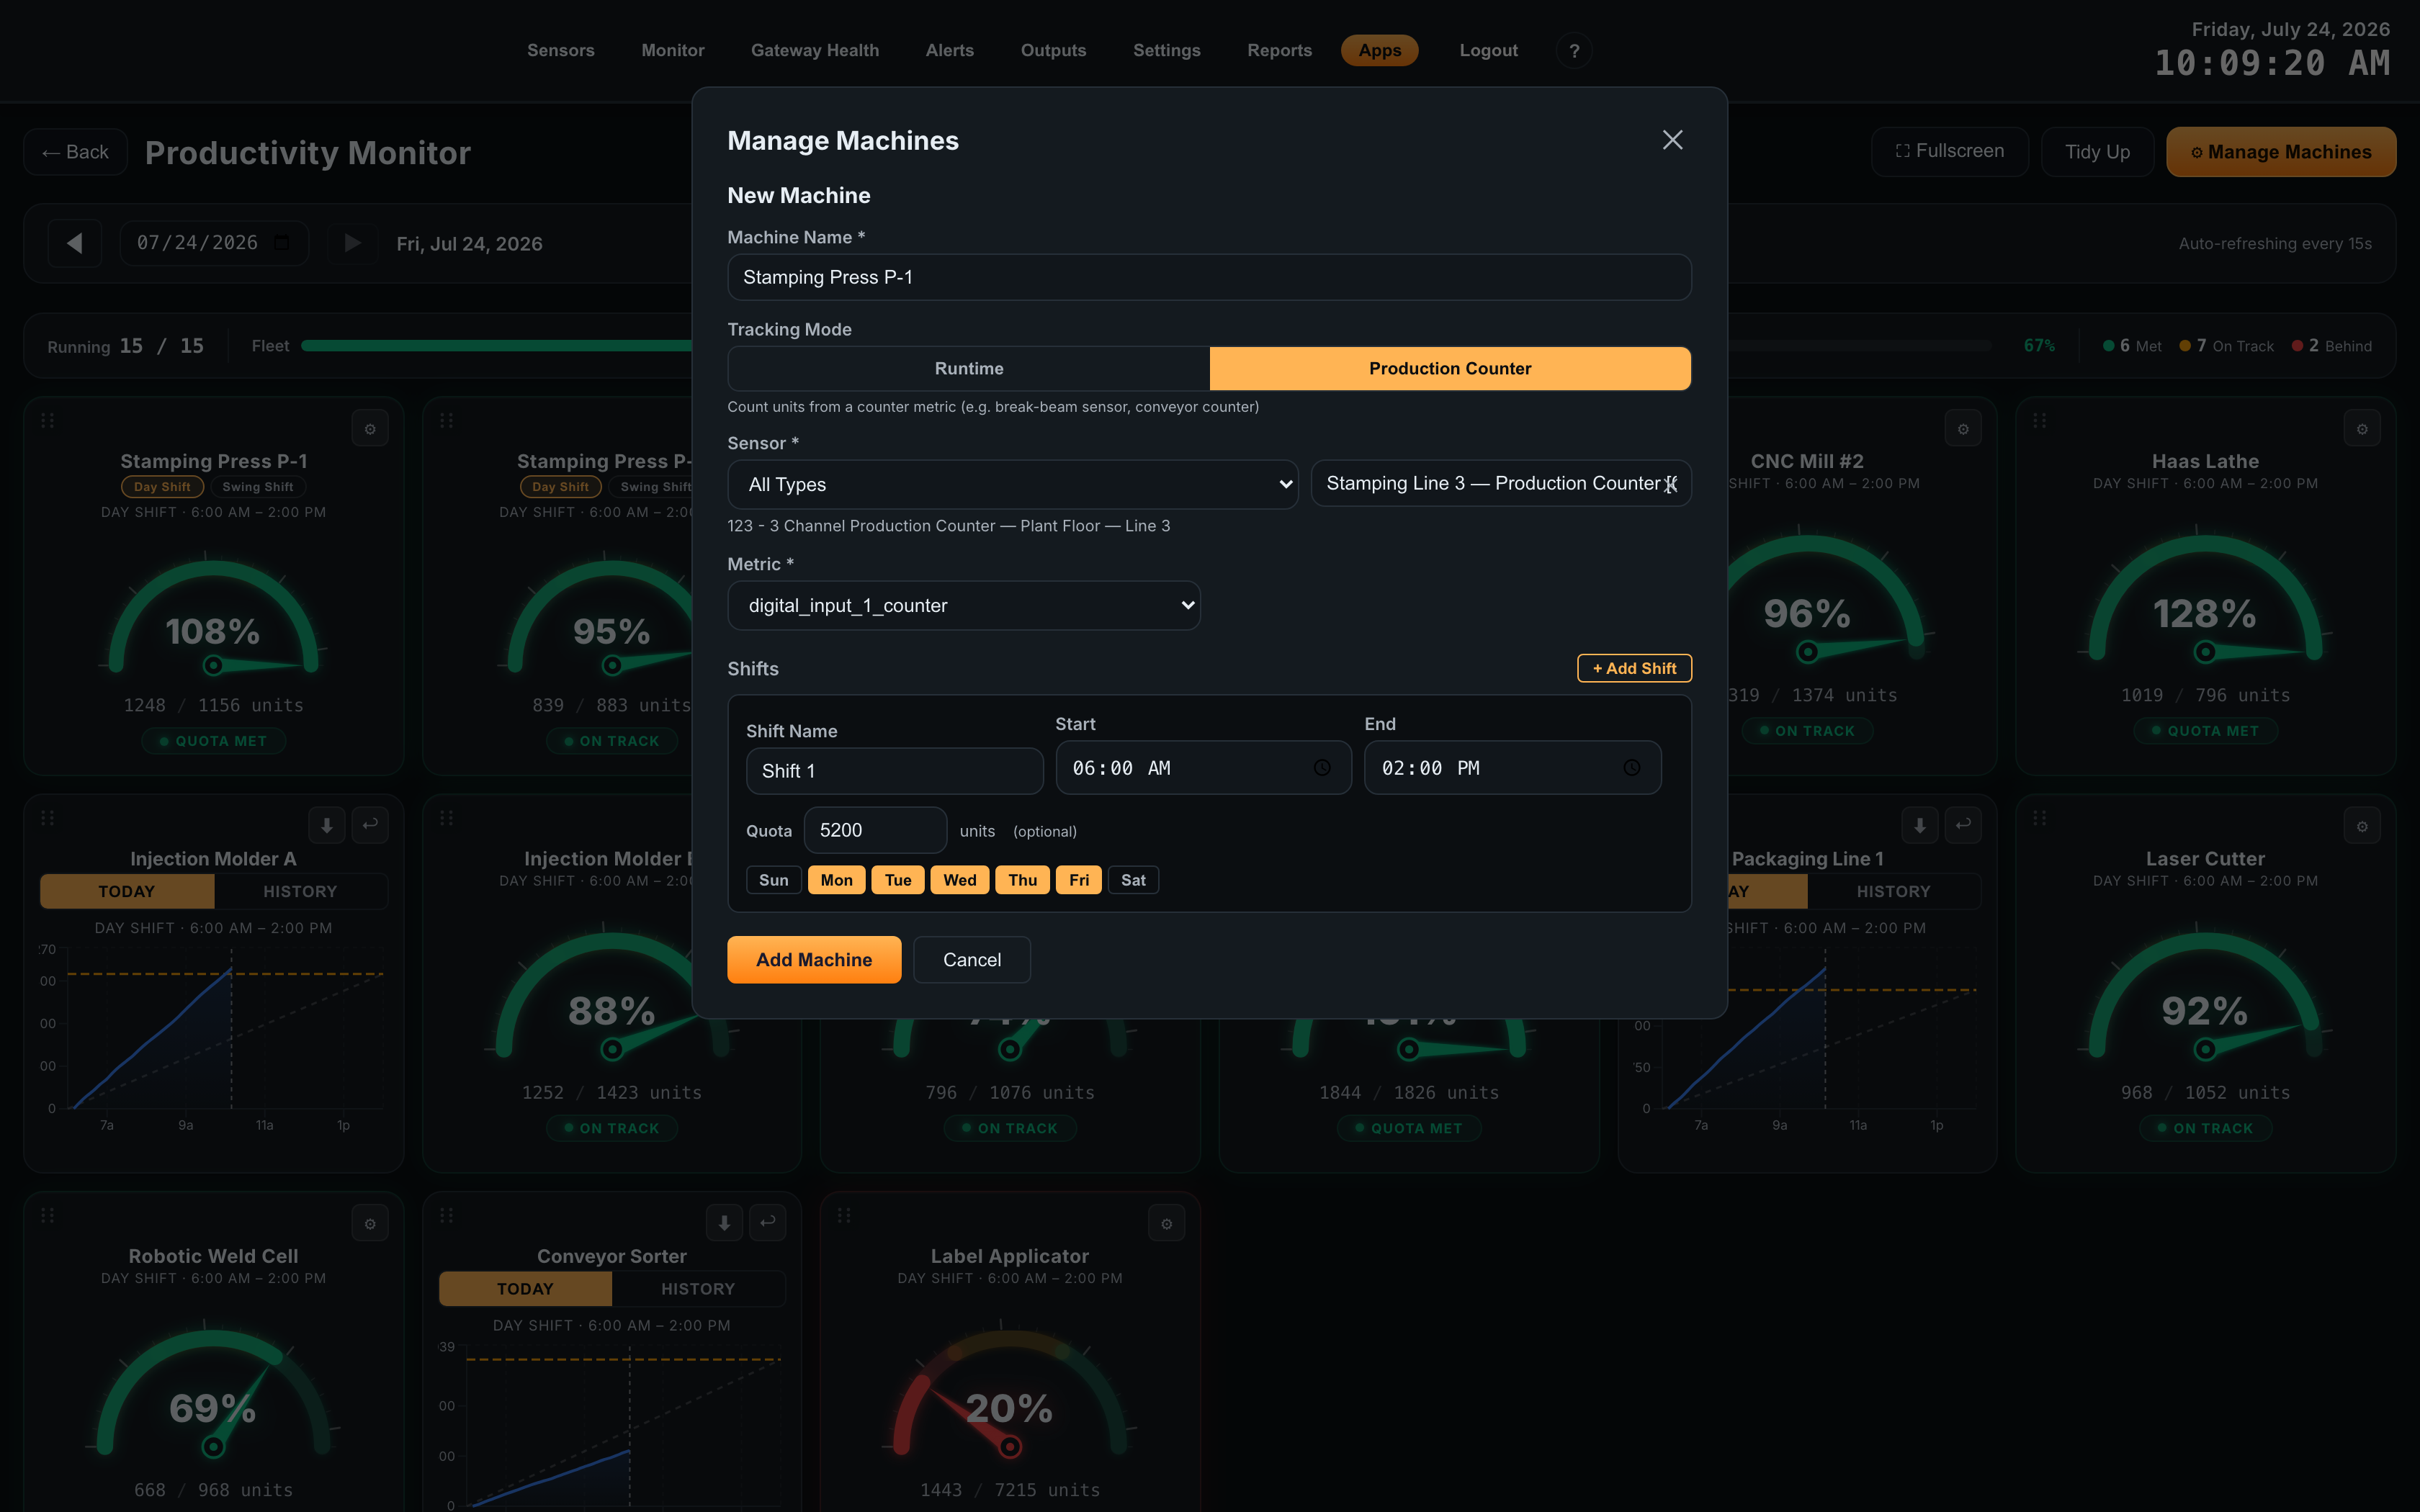
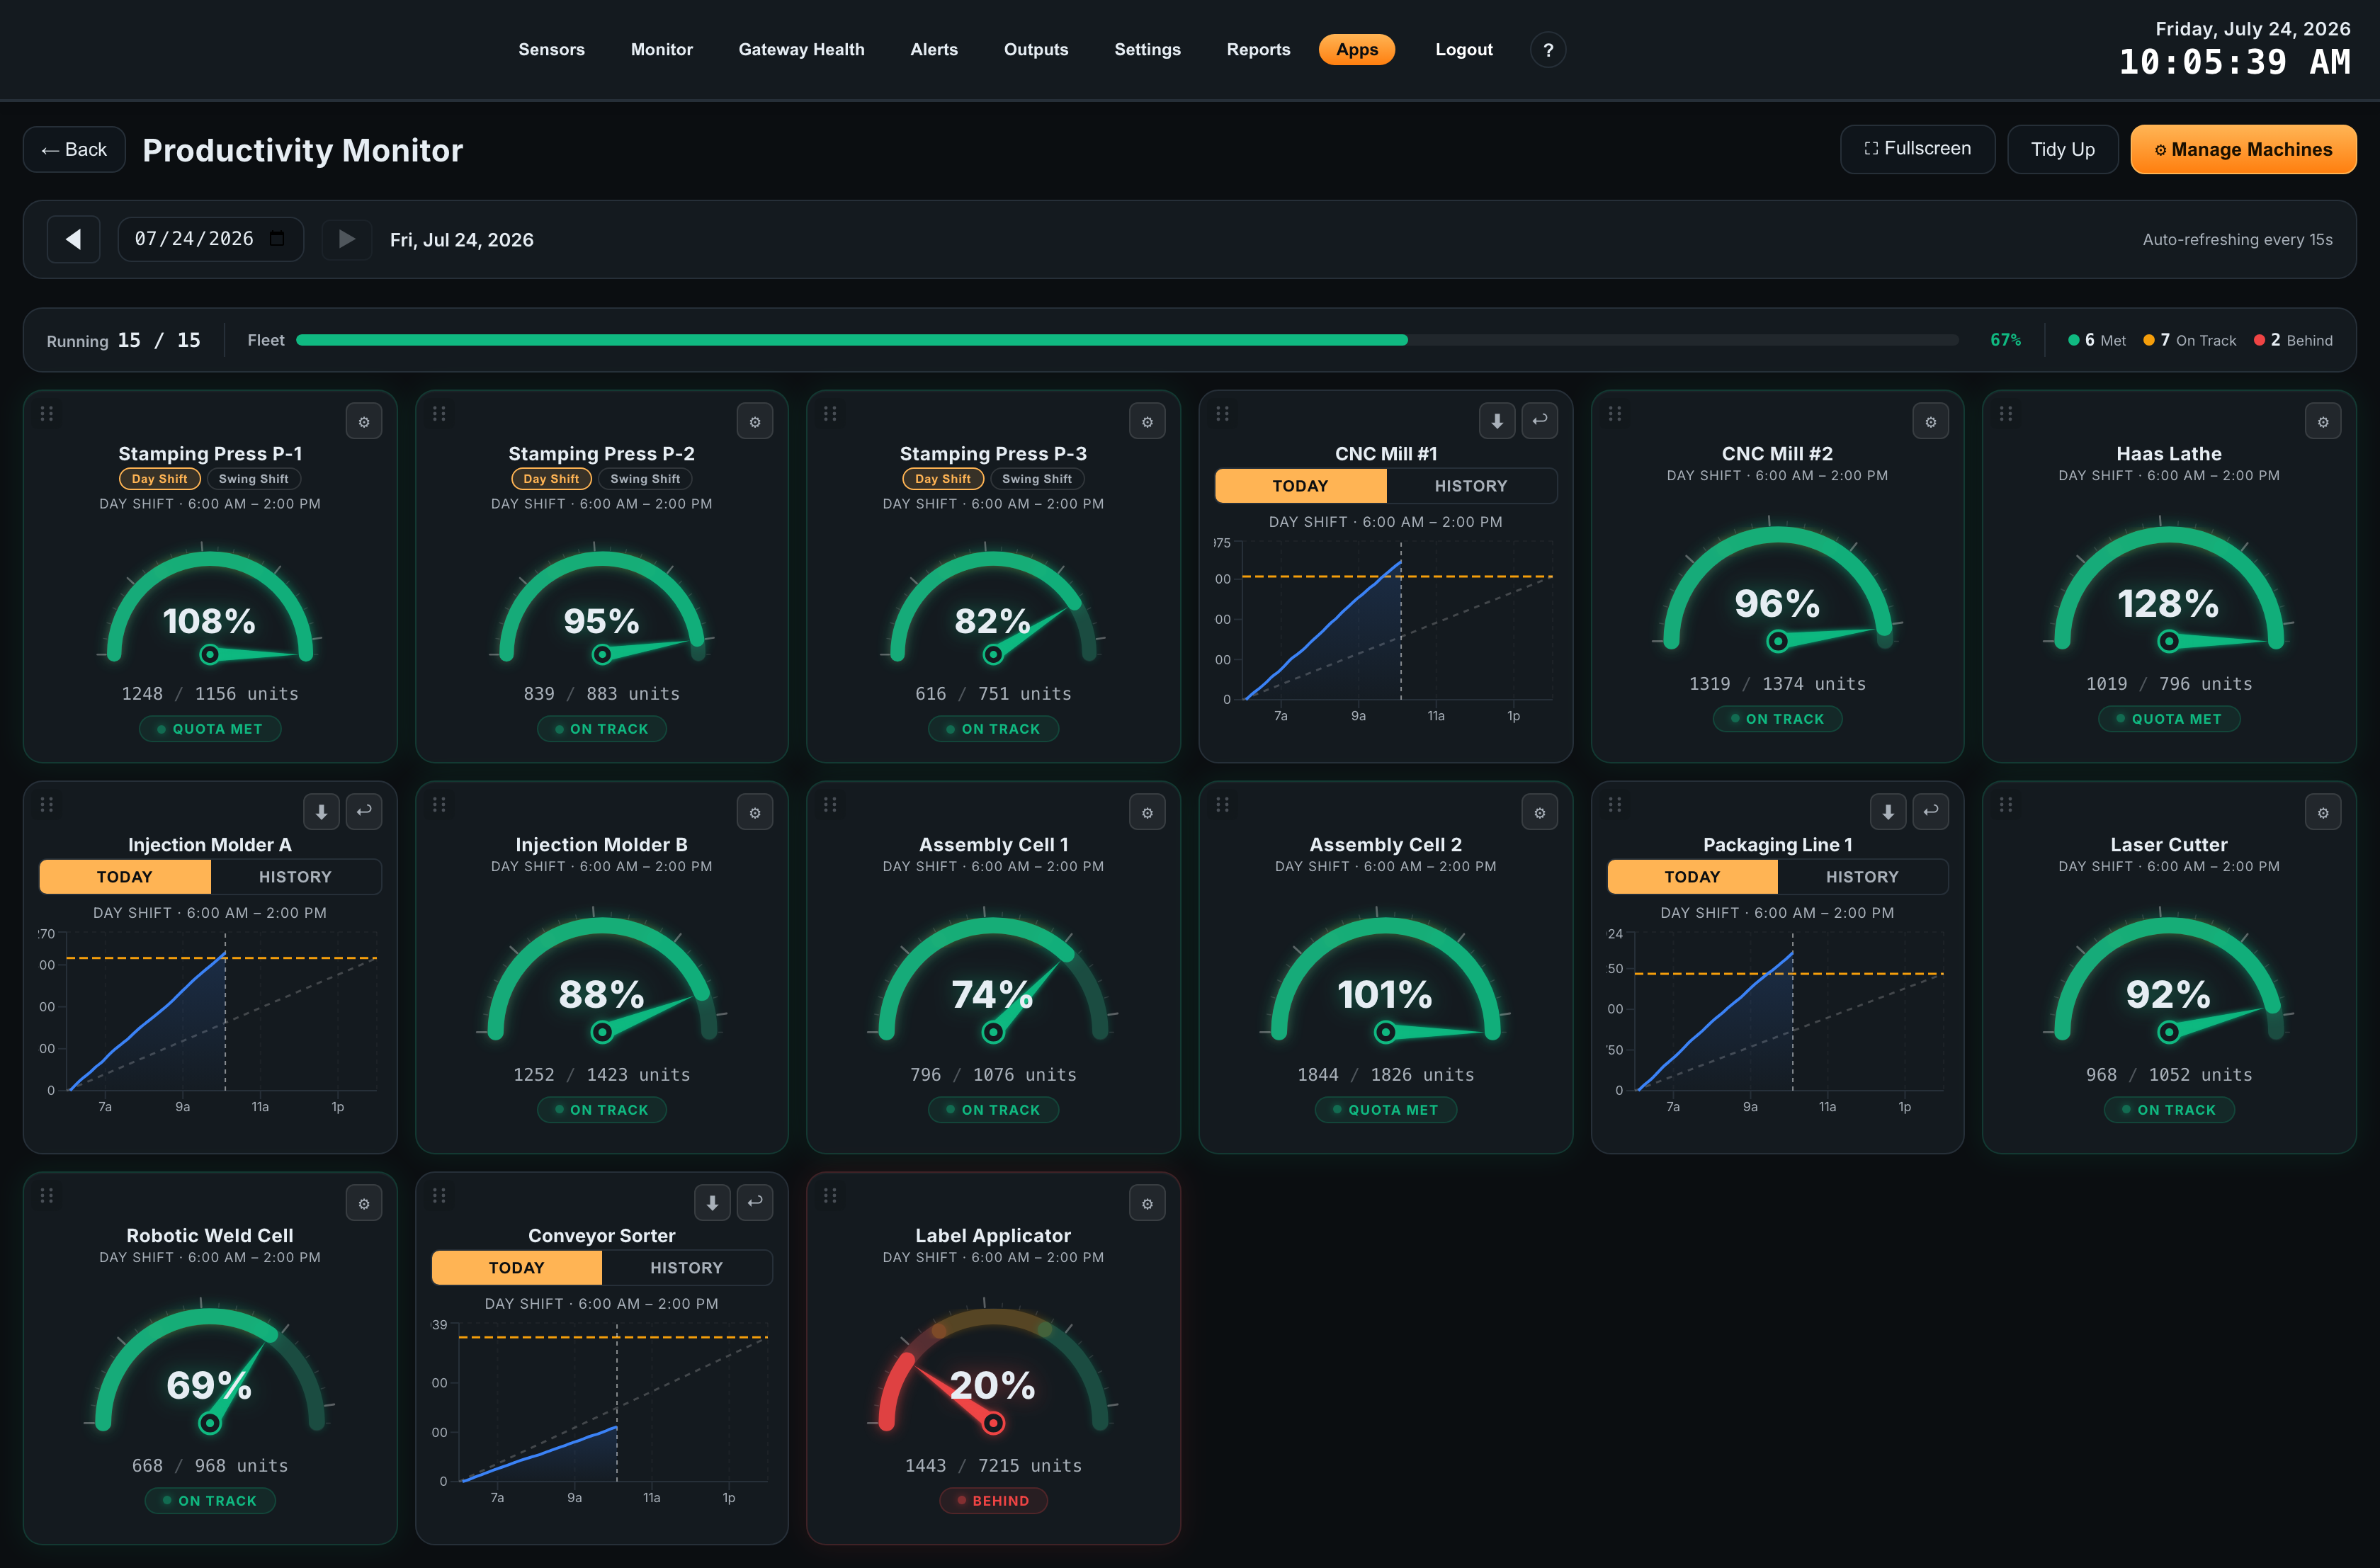
Once configured, each machine shows a live gauge of units produced versus the shift target, flagged Quota Met, On Track, or Behind. The fleet view rolls every line up into a single at-a-glance board.
10Sensor Dashboard
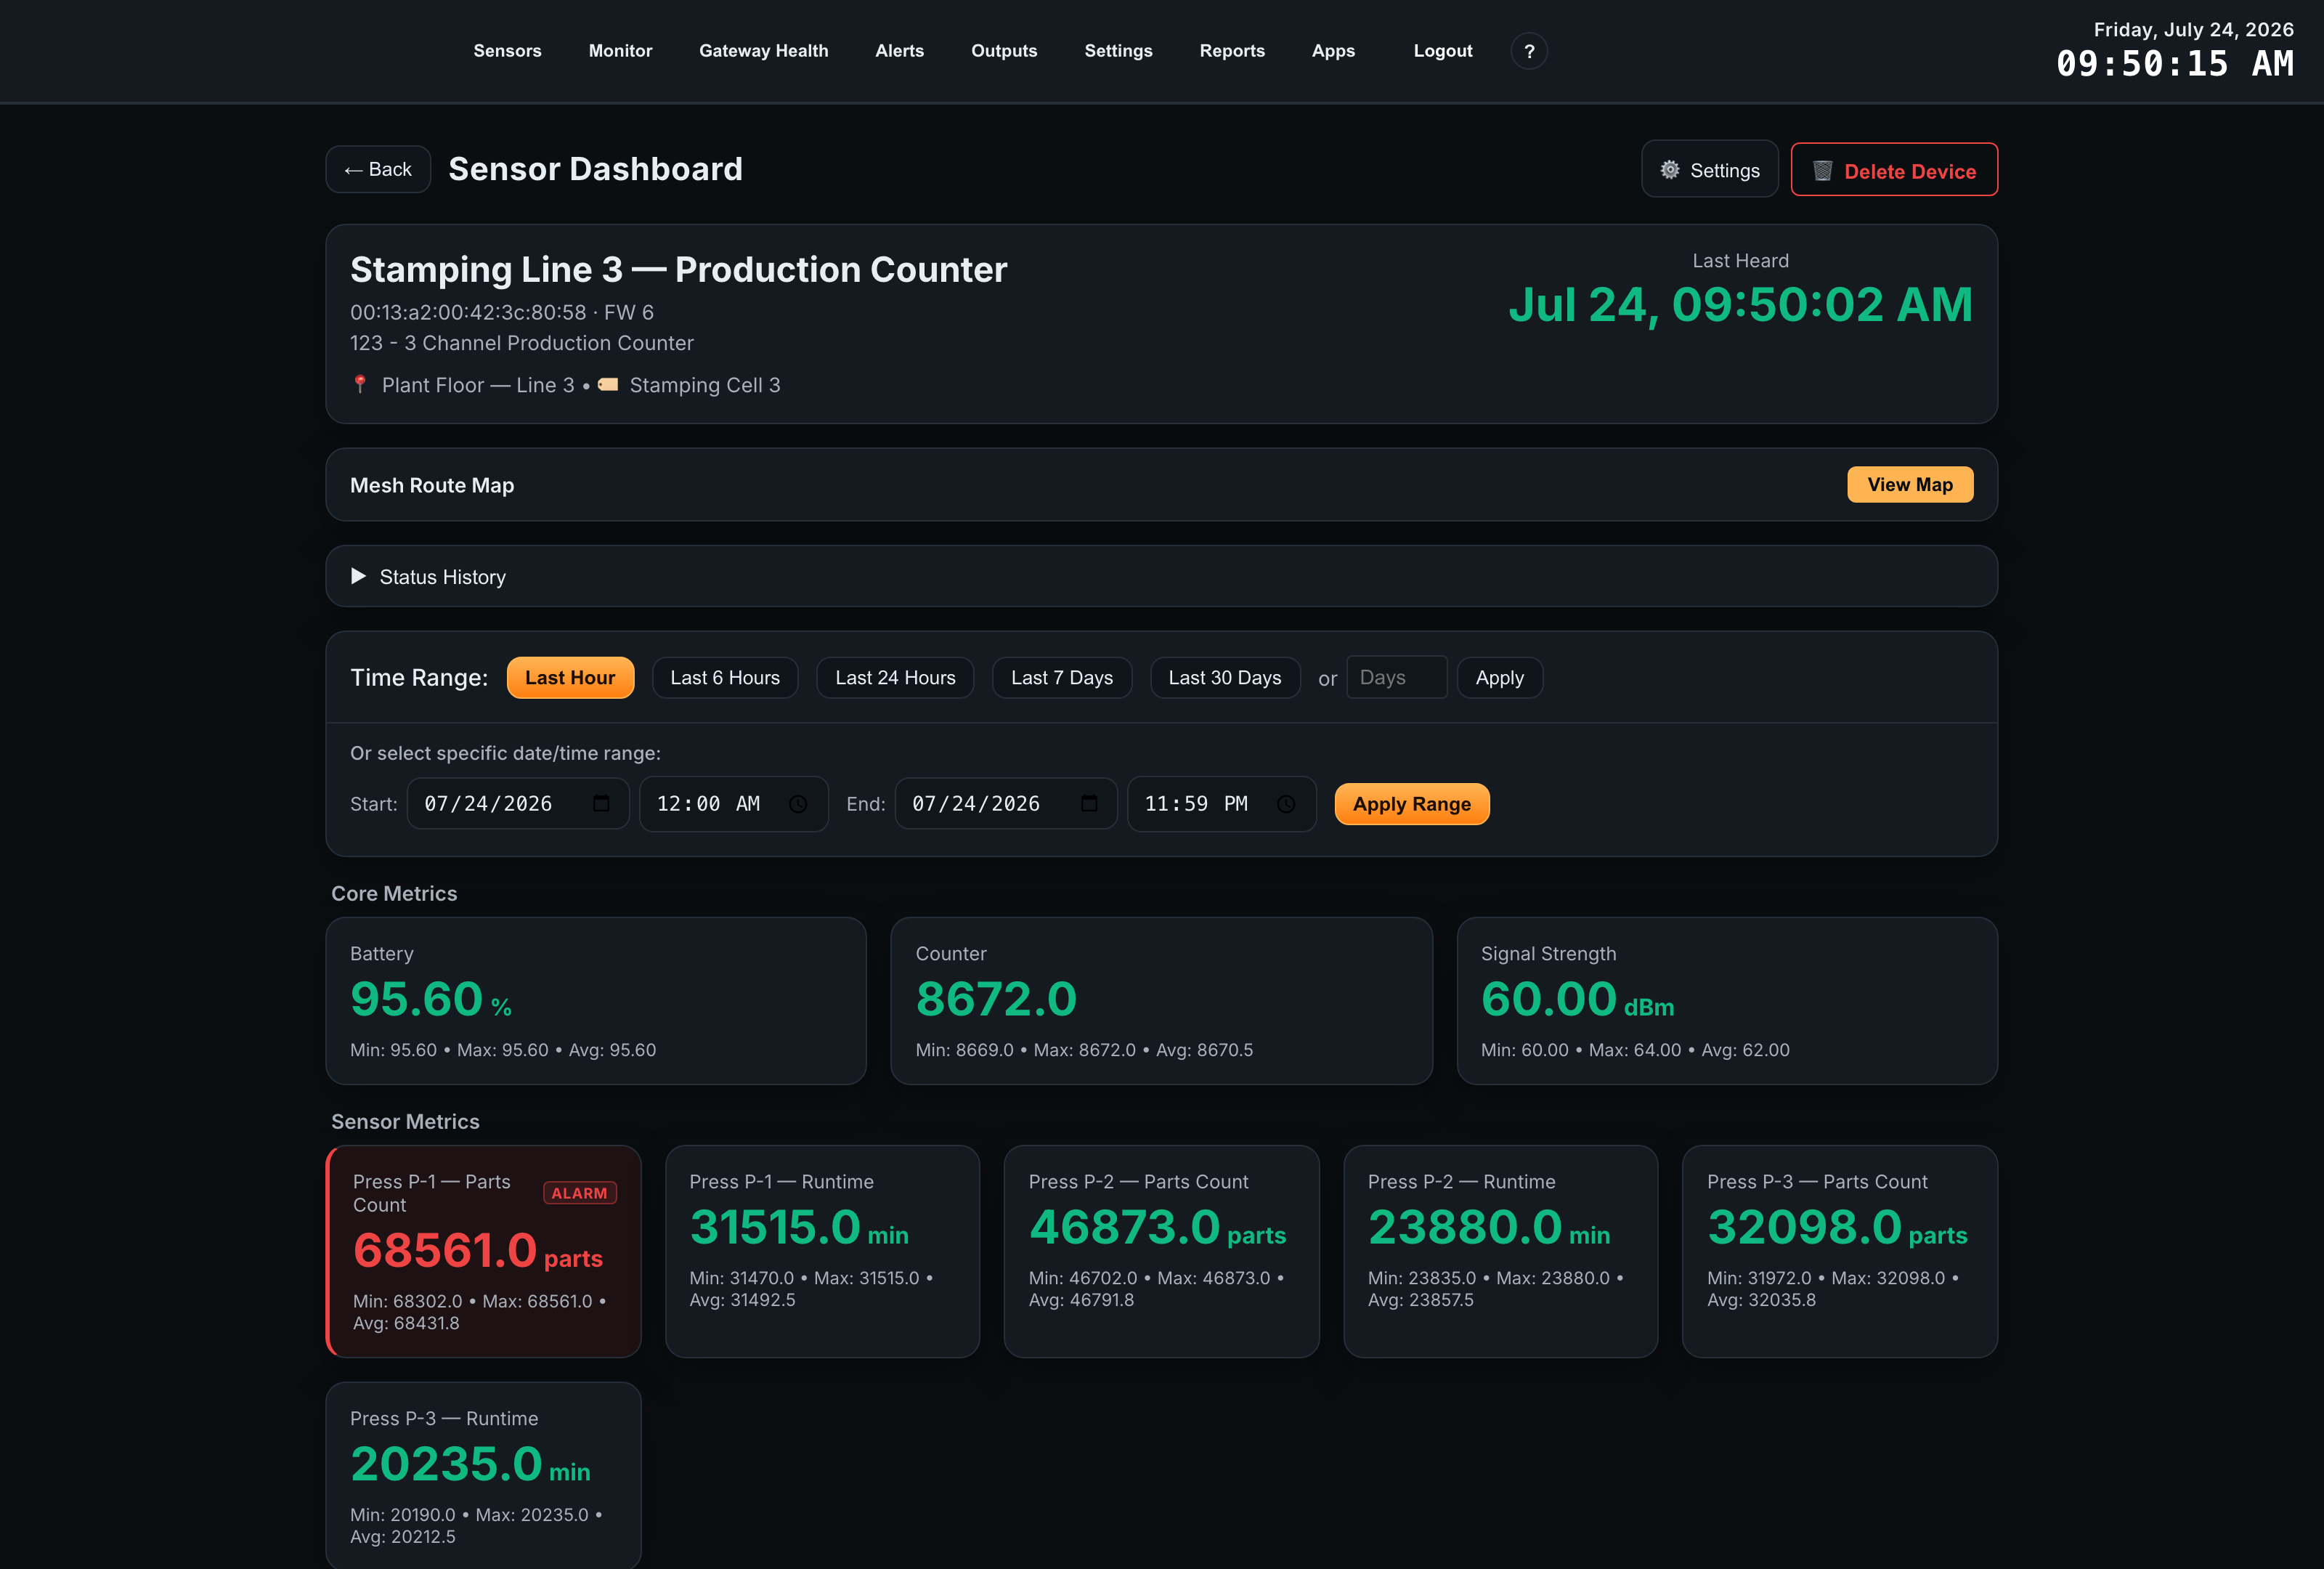
The Sensor Dashboard provides a real-time and historical view of all data from this counter. Access it by clicking the sensor in the Sensors list and selecting Dashboard.
Live Metrics
| Metric | Unit | Description |
|---|---|---|
| Input 1–3 Counter | count | Cumulative cycles counted on each channel since the last reset |
| Input 1–3 Uptime | seconds | Active time accumulated on each channel since the last reset |
| Input 1–3 State | HIGH / LOW | Live logical state of each input at the last transmission |
| Report Type | — | Why the most recent transmission was sent (Regular / Shift End / Interrupt / Threshold) |
| Battery Pct | % | Estimated remaining battery capacity |
| RSSI | dBm | Received signal strength — reported as positive magnitude; higher values indicate a weaker signal |
| Counter | — | Packet counter that increments with each transmission; useful for detecting missed packets |
Time Range & Charts
Use the time range selector to view historical data for the last hour, 6 hours, 24 hours, 7 days, or 30 days. A custom date/time range is also available. Each metric has its own interactive chart — drag to zoom into a time window, double-click to reset. Charting cumulative counters over time shows production volume; the slope of the line is the production rate.
Mesh Route Map
Click View Map in the Mesh Route Map panel to visualize how this counter’s data routes over the wireless mesh to reach the gateway. Useful for diagnosing signal path issues in multi-sensor deployments.
Interactive Preview
The panel below simulates the Atrium Sensor Dashboard for this Production Counter (3-Channel) sensor. Data updates every 5 seconds to demonstrate the live monitoring experience.
11Setting Alerts
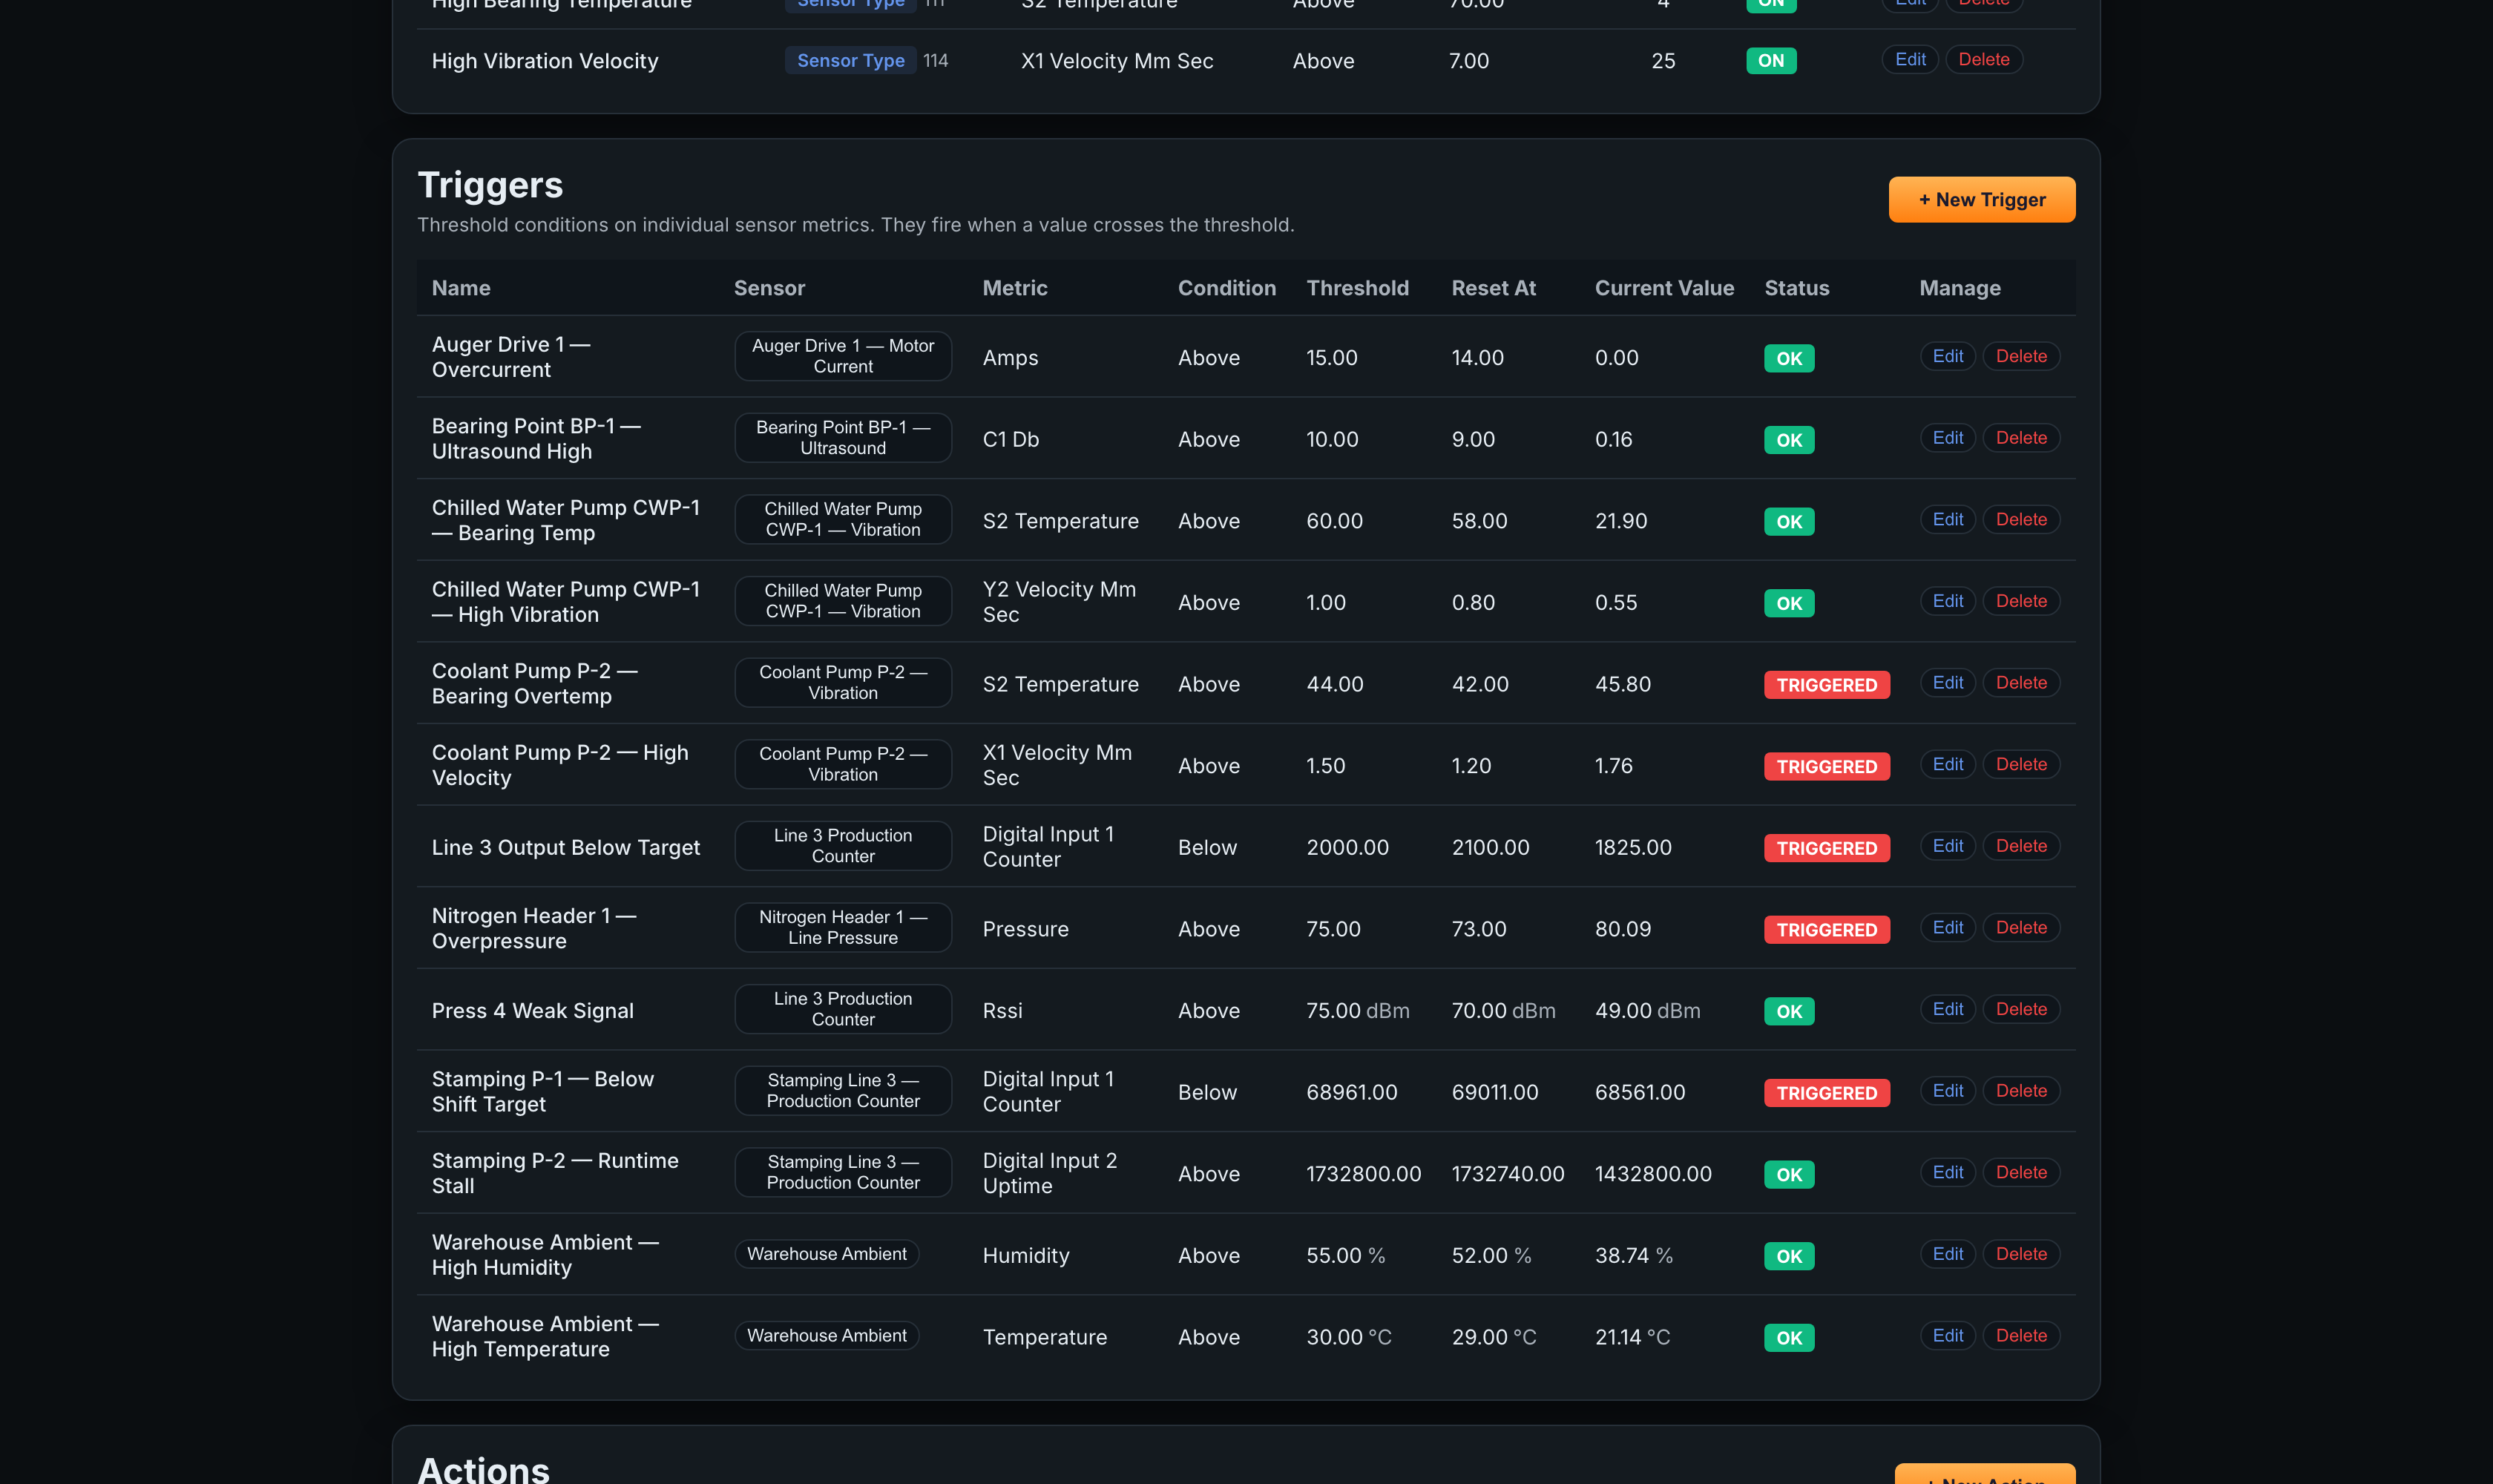
Atrium uses a Triggers & Actions model for alerting. A Trigger defines the threshold condition on a metric. An Action defines what happens when all triggers fire simultaneously (e.g. send an email or activate a relay output). Navigate to Alerts in the top navigation (the page is titled Alerts & Actions) to configure.
Creating a Trigger
-
1
Go to Alerts → TriggersClick + New Trigger to open the Create Trigger form.
-
2
Configure the triggerSelect the Device, Metric (e.g.
digital_input_1_counterordigital_input_2_uptime), Condition (Above or Below), and Threshold value — for example, alert when a shift count falls below a target, or when uptime drops, indicating a stoppage. The optional Hysteresis field (shown as Reset At in the trigger table) prevents repeated firing when the value oscillates near the threshold. Click Create Trigger.
Creating an Action
-
1
Go to Alerts → ActionsClick + New Action. Actions link one or more triggers to a response — when all assigned triggers fire simultaneously, the action executes.
-
2
Assign triggers and configure the responseSelect the trigger(s) to watch and configure the response — an email notification or a relay output. Email must be configured in Settings → Gateway Configuration for email actions to work.
12Exporting Data
All counter data can be exported to CSV directly from the Sensor Dashboard for use in spreadsheets, OEE calculations, reporting tools, or other analysis software.
-
1
Open the Sensor DashboardNavigate to the counter and click Dashboard.
-
2
Select a time rangeChoose the time range you want to export using the selector at the top of the dashboard — for OEE reporting, align this with a shift or a day.
-
3
Click “CSV” on the desired metricEach metric chart has a CSV download button. Click it to download a timestamped CSV of that metric’s data — counter, uptime, or input state — for the selected time range.
13Product Notes
Reference information for ordering and accessories.
| Item | Detail |
|---|---|
| Wireless Module | Required selection at order: 900 MHz (North & South America), 868 MHz (Europe), or 2.4 GHz (Worldwide). Determines frequency and range. |
| M12 Connector / Cable | Optional M12 8-pin connector or pre-wired M12 cable for landing sensor wiring. |
| Break-Beam Sensor | Optional add-on photo/break-beam sensor for part detection. |
| External Power | Optional 12–24 V DC supply (e.g. 12 V 1.25 A) connected via the barrel connector; select ON EXT on the power switch. |
| Magnetic Mounting | Optional magnetic mounting plate for ferrous surfaces. |
Order this counter, choose your wireless-module frequency, and add optional accessories on its product page:
14Troubleshooting
Common issues and their solutions.
Counter not appearing in Atrium
- Confirm the power switch is on ON BAT or ON EXT. Press the CFG button — the TEST LED should light, confirming power.
- Verify the counter’s Network ID matches the gateway’s Network ID (default:
7fff). - Confirm the antenna is attached to the RP-SMA connector.
- Move the counter within ~1 meter of the gateway to rule out range issues; press RESET and wait ~15 seconds for a transmission.
- Check that the Atrium gateway is powered on and connected to your network.
Counter showing as Offline in Atrium
- Verify the Report Interval in Sensor Meta matches the Delay in Sensor Hardware Settings (both default to 600).
- Check the battery percentage on the last received reading — replace the battery if below 10%, or switch to external power.
- Check the RSSI value — readings consistently above 75 dBm may indicate marginal signal (higher values = weaker signal in Atrium); consider repositioning the counter or gateway, or adding a repeater.
Count is wrong, missing, or double-counting
- Check the Edge Detection setting — counting on the wrong edge (rising vs falling) can miss or double cycles.
- Increase the Input Debounce Time if a noisy mechanical contact is producing extra counts; decrease it if fast cycles are being missed.
- Verify the jumpers (Contact Closure Selection, Operating Voltage, Pull Up/Down) match your sensor type (PNP vs NPN) and wiring.
- Confirm the input signal is within the 3.3–24 V range and lands on the M12 pins selected by the Contact Closure jumper.
Hardware settings not updating on the counter
- Settings are staged and applied on the counter’s next check-in. Wait one full reporting interval after saving.
- Confirm the counter is actively transmitting by checking the Last Heard timestamp on the dashboard.
- If the device was previously configured on another network, perform a Factory Reset (below) to clear a mismatched Destination Address or Network ID.
15Factory Reset
A factory reset restores the counter’s wireless module to default settings. This is useful if the counter is not being detected by a gateway, or if you are redeploying it to a new network. The procedure uses the physical RESET and CFG (Configuration) buttons on the PCB.
Factory Reset Procedure
- 1Open the enclosureRemove the four screws and lift the lid to expose the PCB, RESET button, and CFG button.
- 2Press and release RESETPress and release the RESET button, then wait approximately 1 second.
- 3Hold CFG for more than 15 secondsPress and hold the CFG (Configuration) button for more than 15 seconds, then release. The hold must exceed 15 seconds to trigger a factory reset — a 5–15 second hold only enters Configuration Mode.
- 4Wait 3–5 secondsAllow 3–5 seconds for the reset to complete. The device sends a factory-reset notification, then a “ready for configuration” message.
- 5Press RESET, then close the enclosurePress and release the RESET button to return the counter to normal RUN mode. Replace the lid and re-secure the four screws.