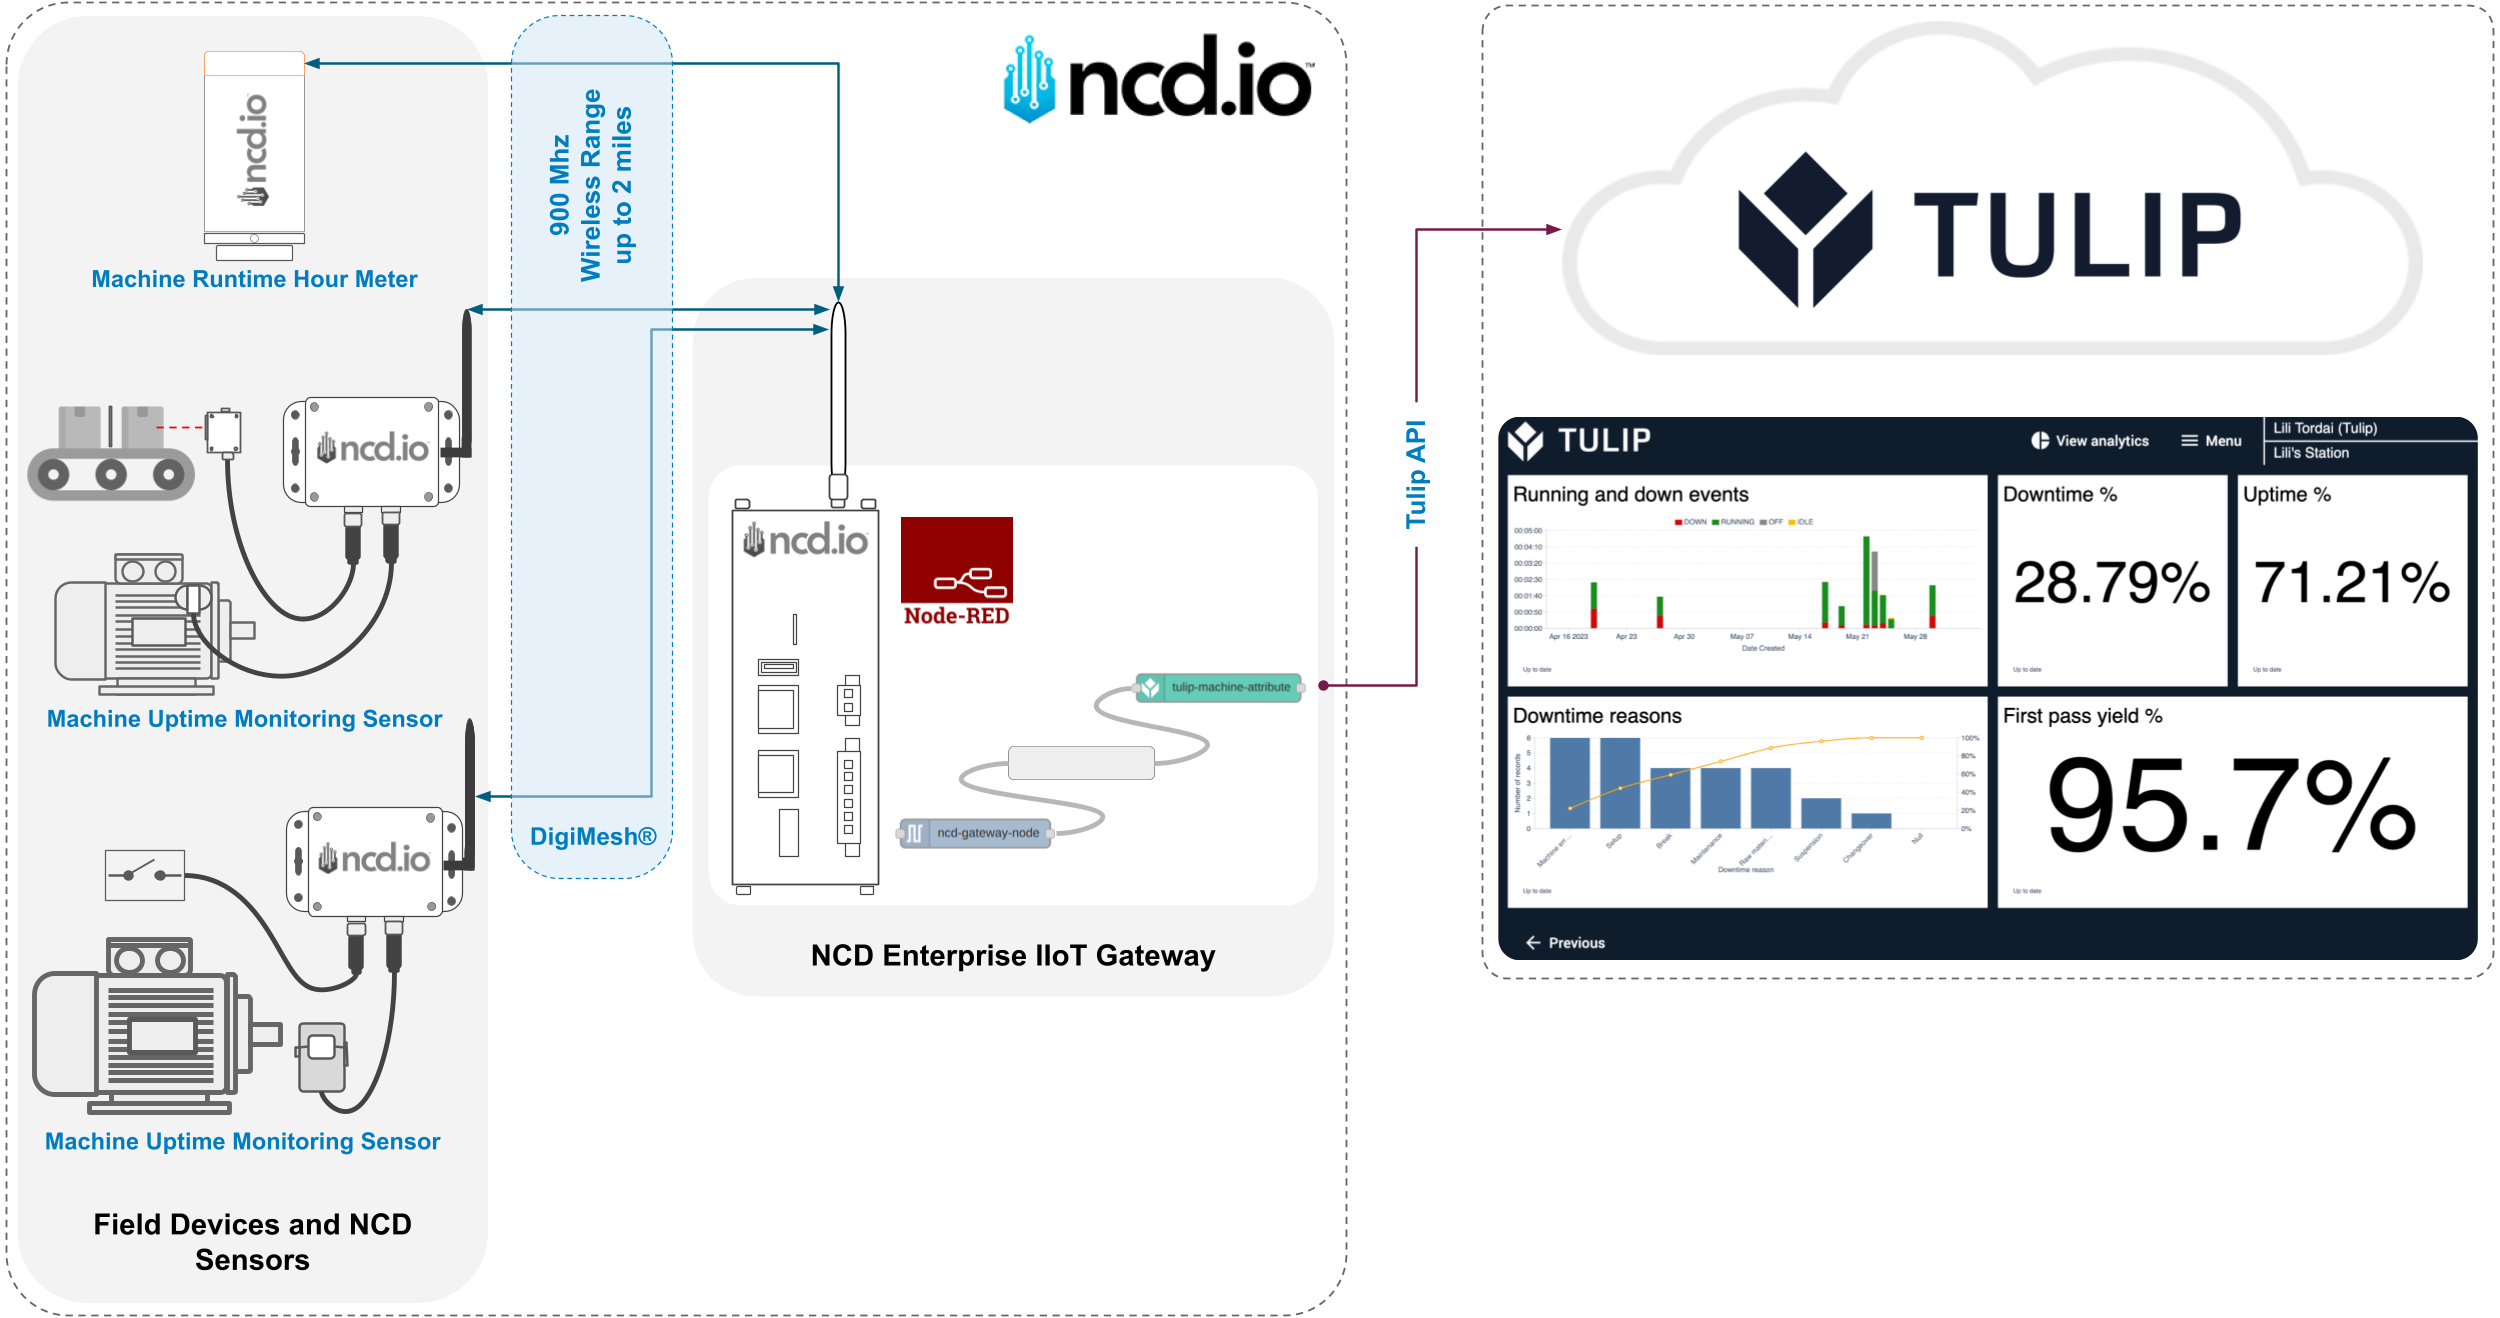
In today’s industrial landscape, the gap between the physical shop floor and digital decision-making is often filled with manual logs and disconnected silos. This guide demonstrates how to bridge that gap by integrating NCD Enterprise IIoT hardware with the Tulip Platform.
Together, these technologies provide a seamless, “plug-and-play” solution that transforms raw electrical signals into real-time, actionable insights for your workforce.
The Platform: Tulip—The Next-Generation MES
While NCD captures the data, Tulip provides the interface for your people. As a cloud-based, no-code platform, Tulip allows manufacturers to digitize their processes without the rigidity of traditional Manufacturing Execution Systems (MES).
No-Code Flexibility: Operators and engineers can build custom, interactive apps—like digital work instructions or quality checklists—using a drag-and-drop interface.
Frontline Centricity: Tulip is designed for the people on the shop floor, providing them with the exact data they need to optimize their daily tasks.
Real-Time Analytics: The platform acts as a unified namespace where machine data (from NCD) meets human activity, enabling instant calculations for OEE (Overall Equipment Effectiveness) and automated downtime tracking.
Refer to each Quick Start Guide depending of your NCD Sensor.
Flow Data Overview
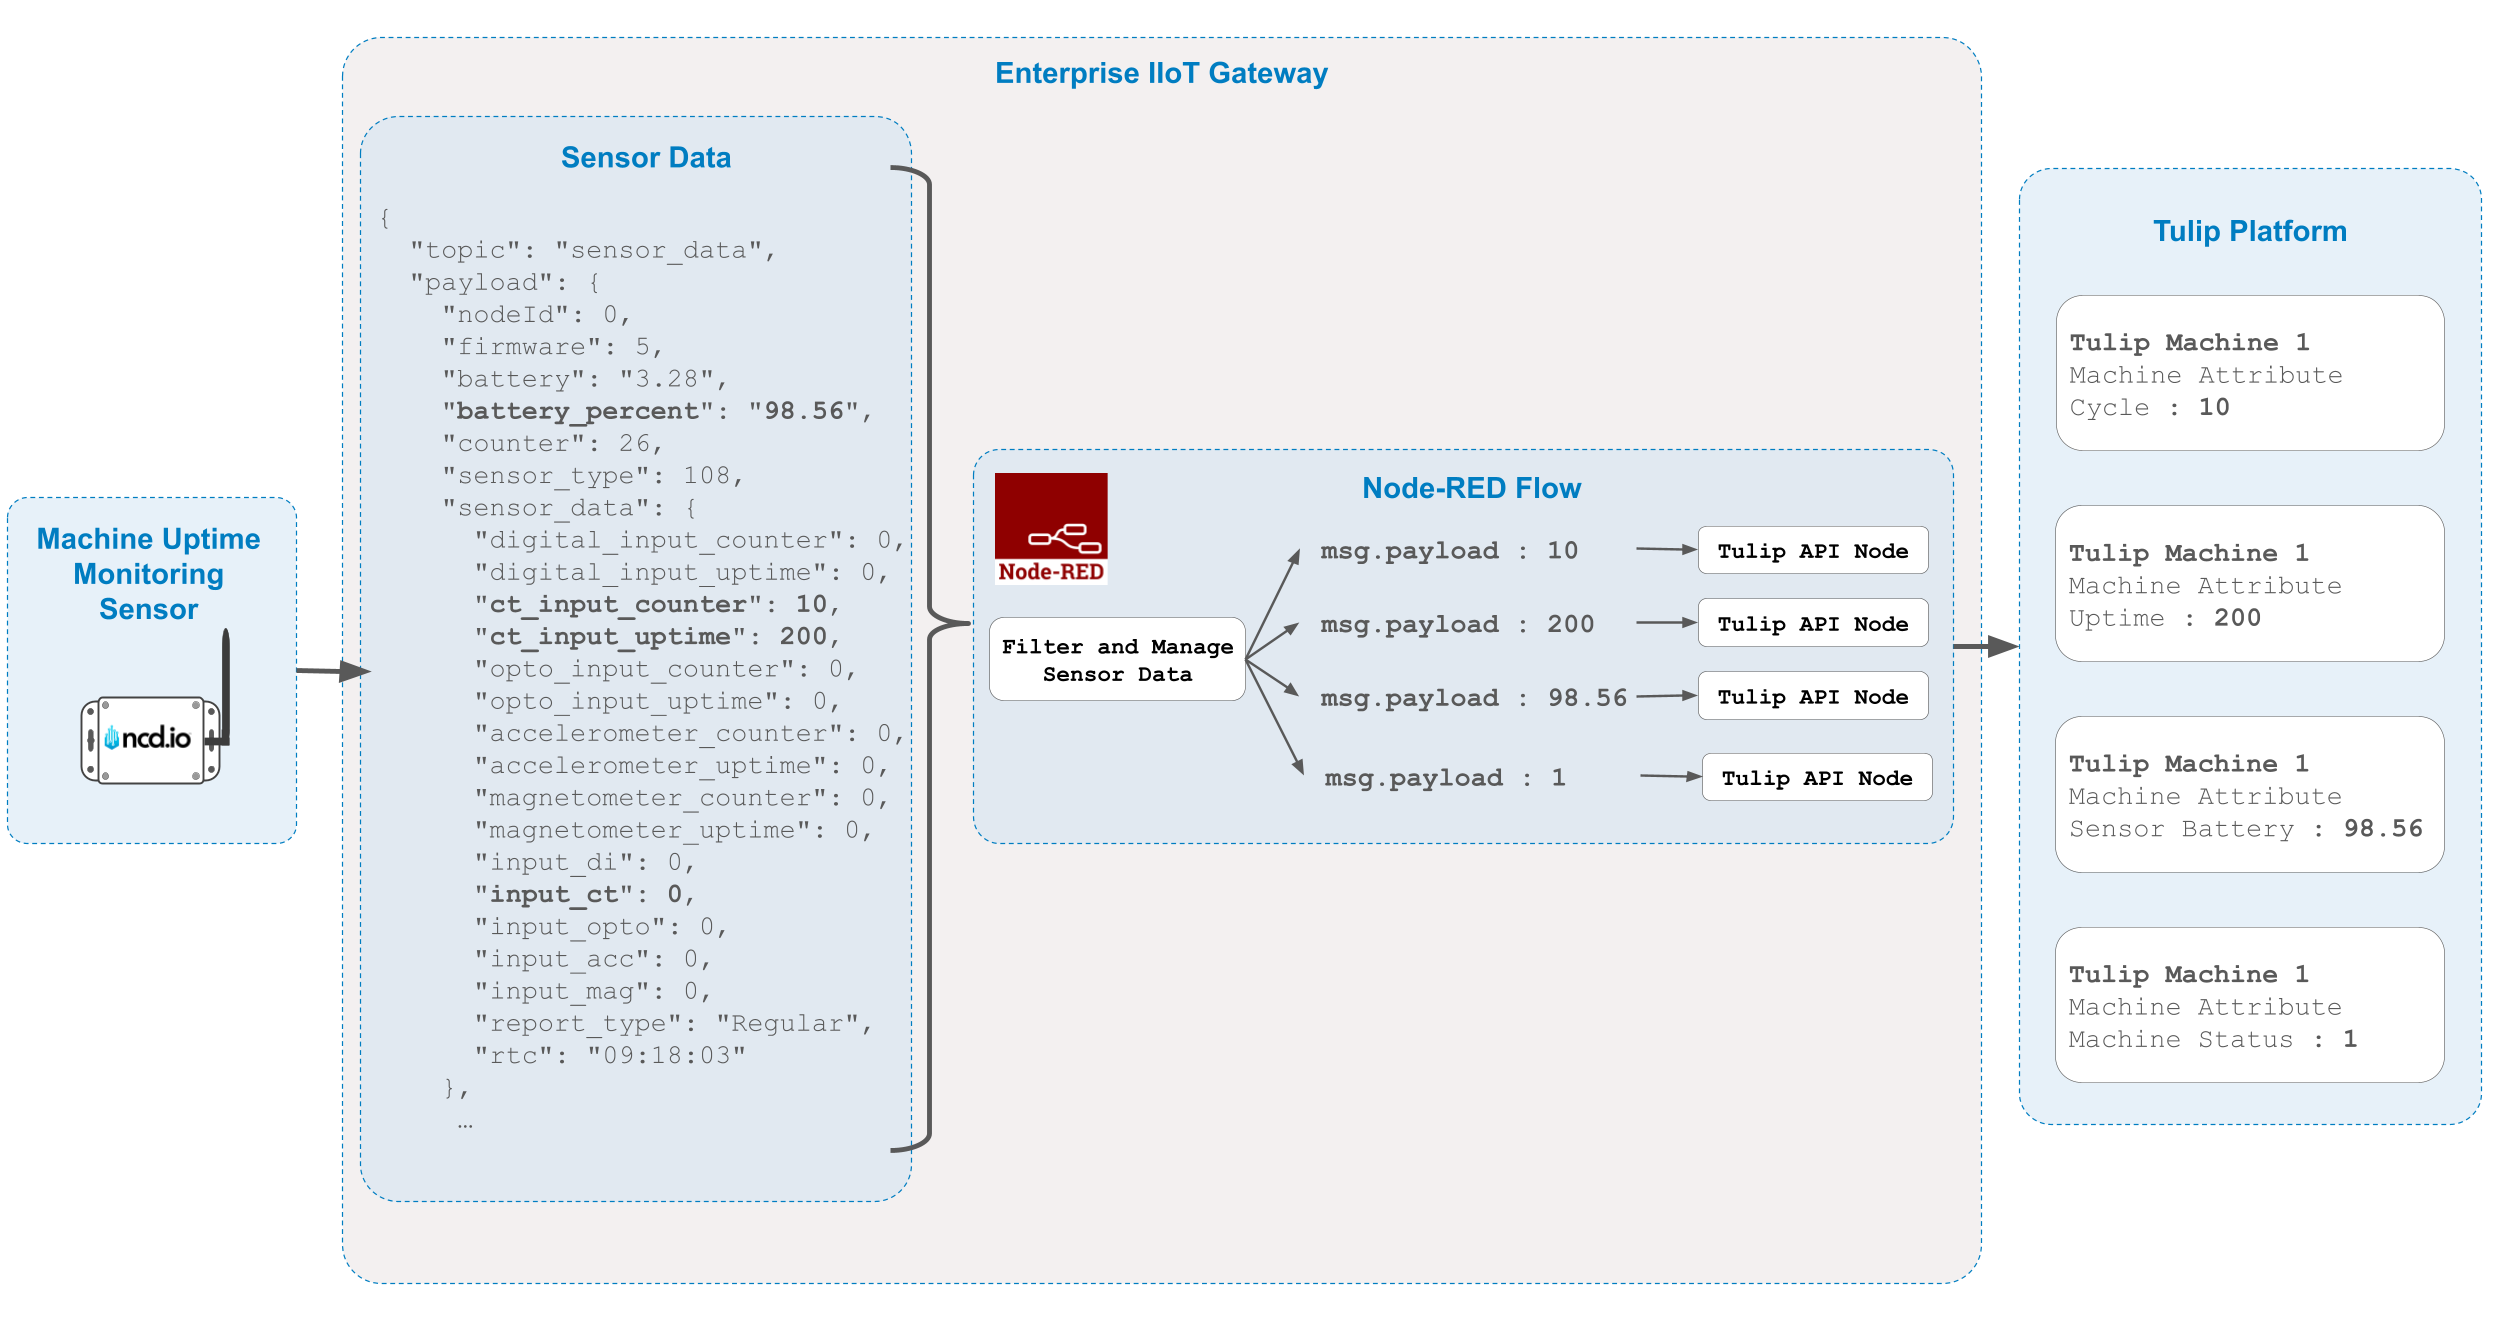
For this guide, we will use the Machine Uptime Monitoring Sensor (PR55-87A). This sensor is specifically designed to track machine cycles and production uptime in industrial environments. Powered by advanced technology—including accelerometers, magnetometers, digital inputs, and current sensors—this device offers real-time monitoring capabilities with exceptional accuracy.
In this walkthrough, we will use the CT current probe to measure machine cycles and uptime. While the sensor can monitor multiple inputs simultaneously, we will focus exclusively on the CT current probe for now. We recommend reviewing the user manual for more detailed information on other input types. If you choose to use a different sensor probe, you can still use this guide as a reference.
We will transmit these values to the Tulip platform, along with the battery percentage, which is a critical metric for maintenance monitoring. In summary, we are interested in the following data points:
msg.payload.sensor_data.ct_input_counter: This represents the machine cycles. Each time the NCD sensor detects AC current, it increments this counter by one.
msg.payload.sensor_data.ct_input_uptime: This value represents the machine uptime in seconds, tracking the total duration the NCD sensor detected AC current.
msg.payload.battery_percent: This represents the remaining battery life of the NCD sensor, allowing for proactive status monitoring.
Procedure
To streamline the sensor data before sending it to the Tulip platform, we will implement a few basic nodes.
Filter the sensor data message.
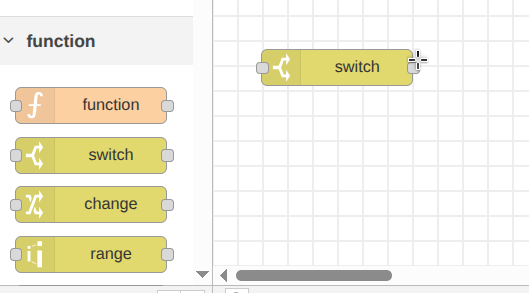
NCD sensors transmit various messages to indicate status, all of which are decoded and sent to the Wireless Gateway node output. Since our goal is to transmit only specific data, we must filter these messages. We recommend to take a look at Sensor User Manual to learn more about sensor data messages. To filter the sensor data messages, we will use the Switch node. In Node-RED, the Switch node acts as a conditional gatekeeper. It evaluates a specific message property against defined criteria and routes the message to an output only if those criteria are met.
Step 1: Drag and drop a Switch node from the Function group into your flow palette.
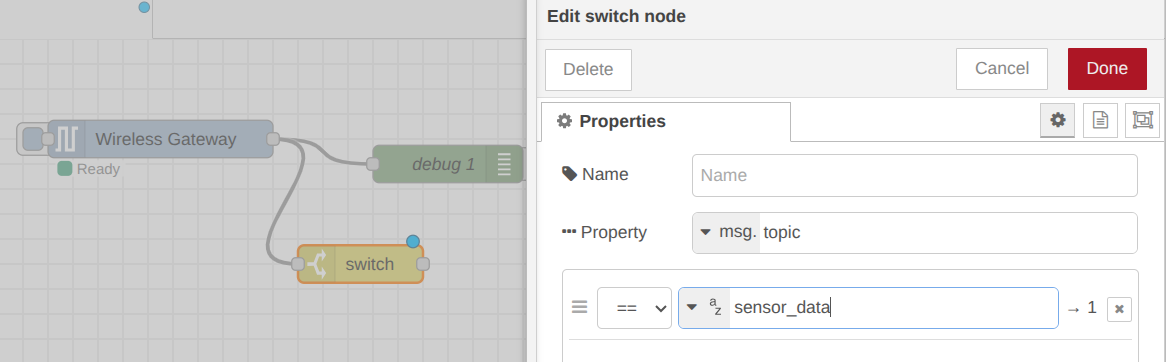
Step 2. Connect the output of the Wireless Gateway node to the input of the Switch node. Double-click the Switch node to access its properties. In the Property field, replace payload with topic. Under the rules section, set the condition to search for the string “sensor_data” and click on the “Done” button.
Click to Expand
Once configured, the Switch node will only output data when the sensor performs a transmission with the “sensor_data” topic. The next step is to isolate the specific properties we want to monitor:
msg.payload.sensor_data.ct_input_counter
msg.payload.sensor_data.ct_input_uptime
msg.payload.battery_percent
Extracting Data with Change Nodes
To isolate these values, we will use Change nodes. The Change node is a versatile tool used to modify messages as they move through a flow. It can set, change, delete, or move message properties.
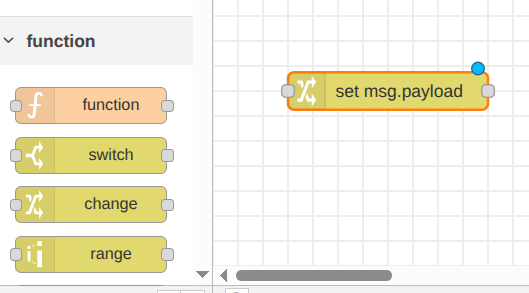
Step 1: Drag and drop a Change node from the Function group into your workspace.
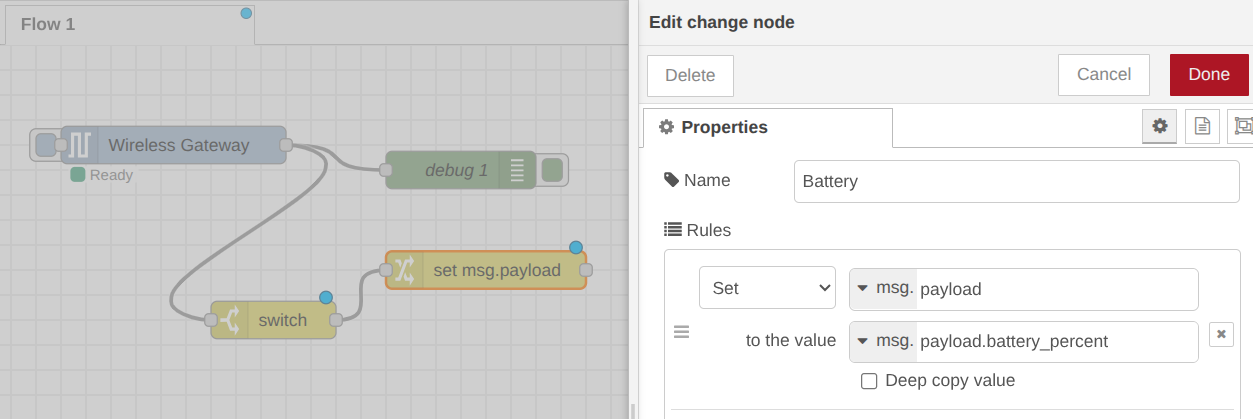
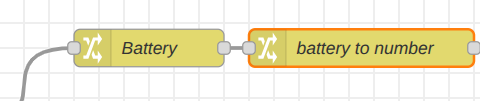
Step 2: Connect the Switch node output to the input of the Change node. Double-click the Change node to edit its properties. Assign the name “Battery” to this node. Under the rules, Set msg.payload to the value msg.payload.battery_percent in the “to the value” field then click the “Done” button. This moves the battery percentage value directly to the main payload, which is the property the Tulip node expects in the following steps.
Click to Expand
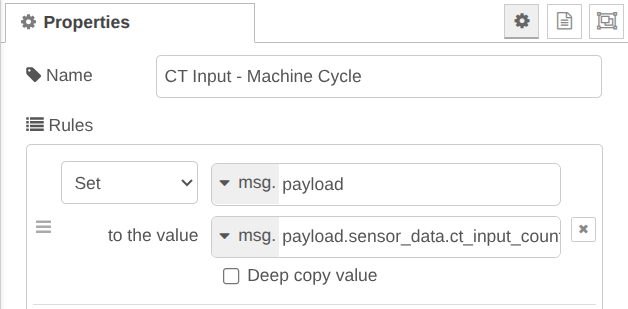
Step 3: Add two additional Change nodes and connect them to the Switch node. Configure them as follows:
Set msg.payload to the value msg.payload.sensor_data.ct_input_counter
Set msg.payload to the value msg.payload.sensor_data.ct_input_uptime
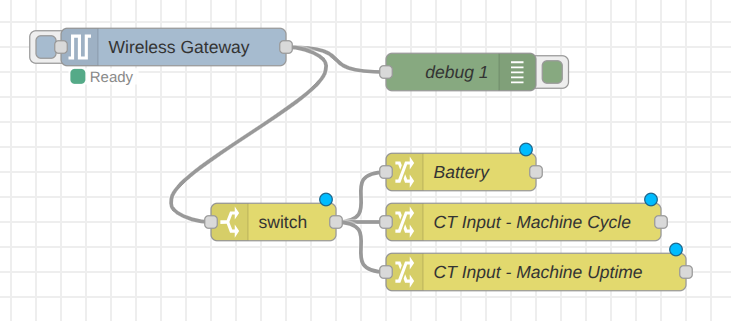
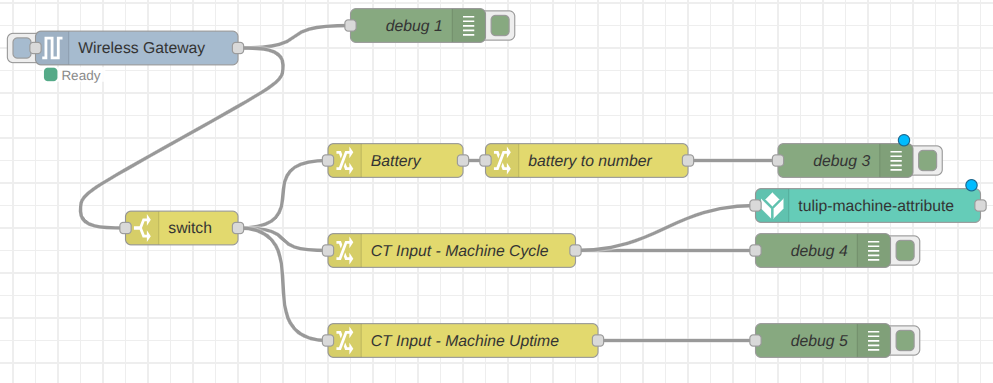
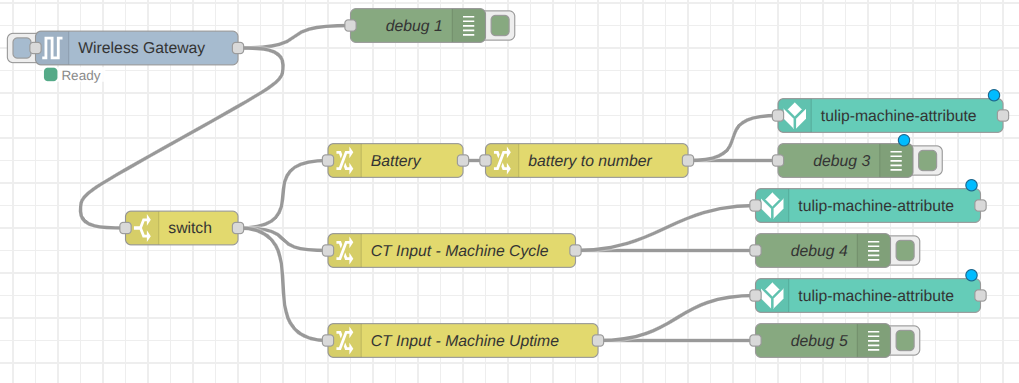
Your flow should look like this:
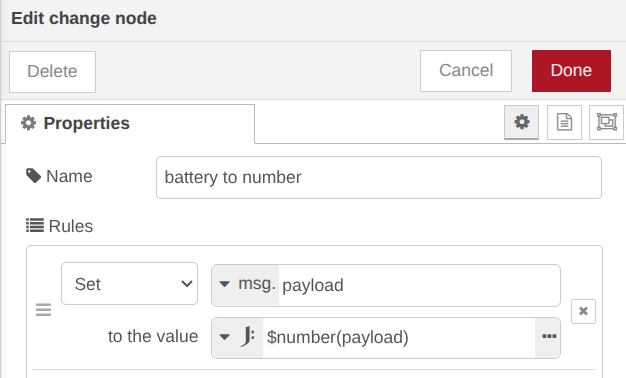
Step 4: We will configure one final Change node to ensure data consistency. This node will convert the battery percentage from a string to a number, matching the format of the cycle and uptime data. Connect this new Change node to the output of the Battery Change node and apply the data type conversion. Then set as follow:
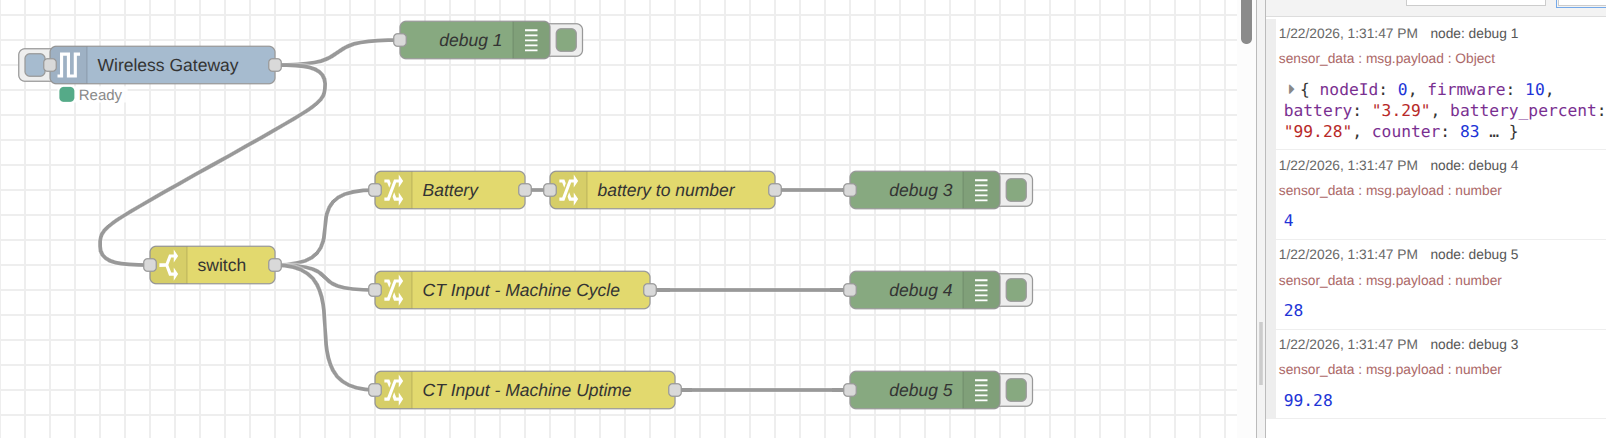
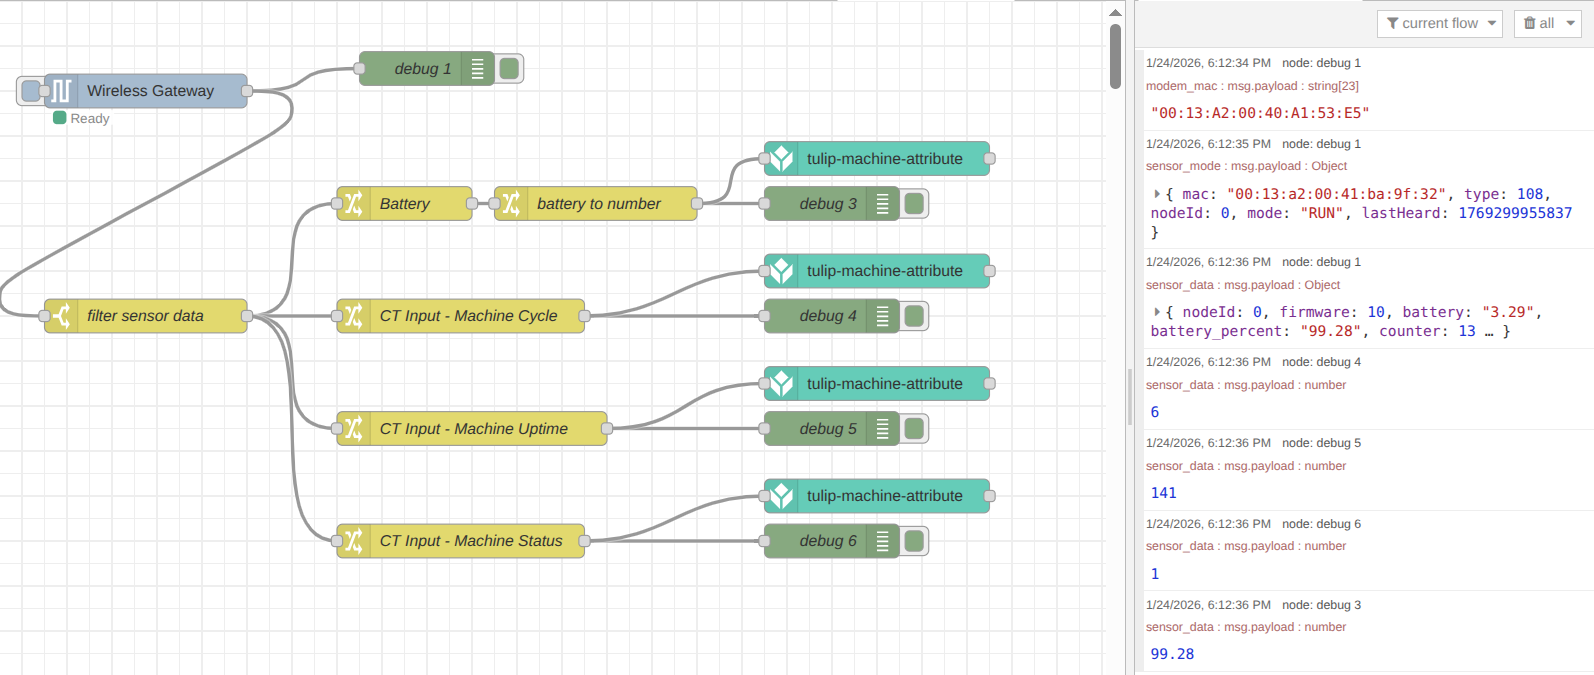
Your flow should now be organized to split the single sensor message into three distinct data streams.
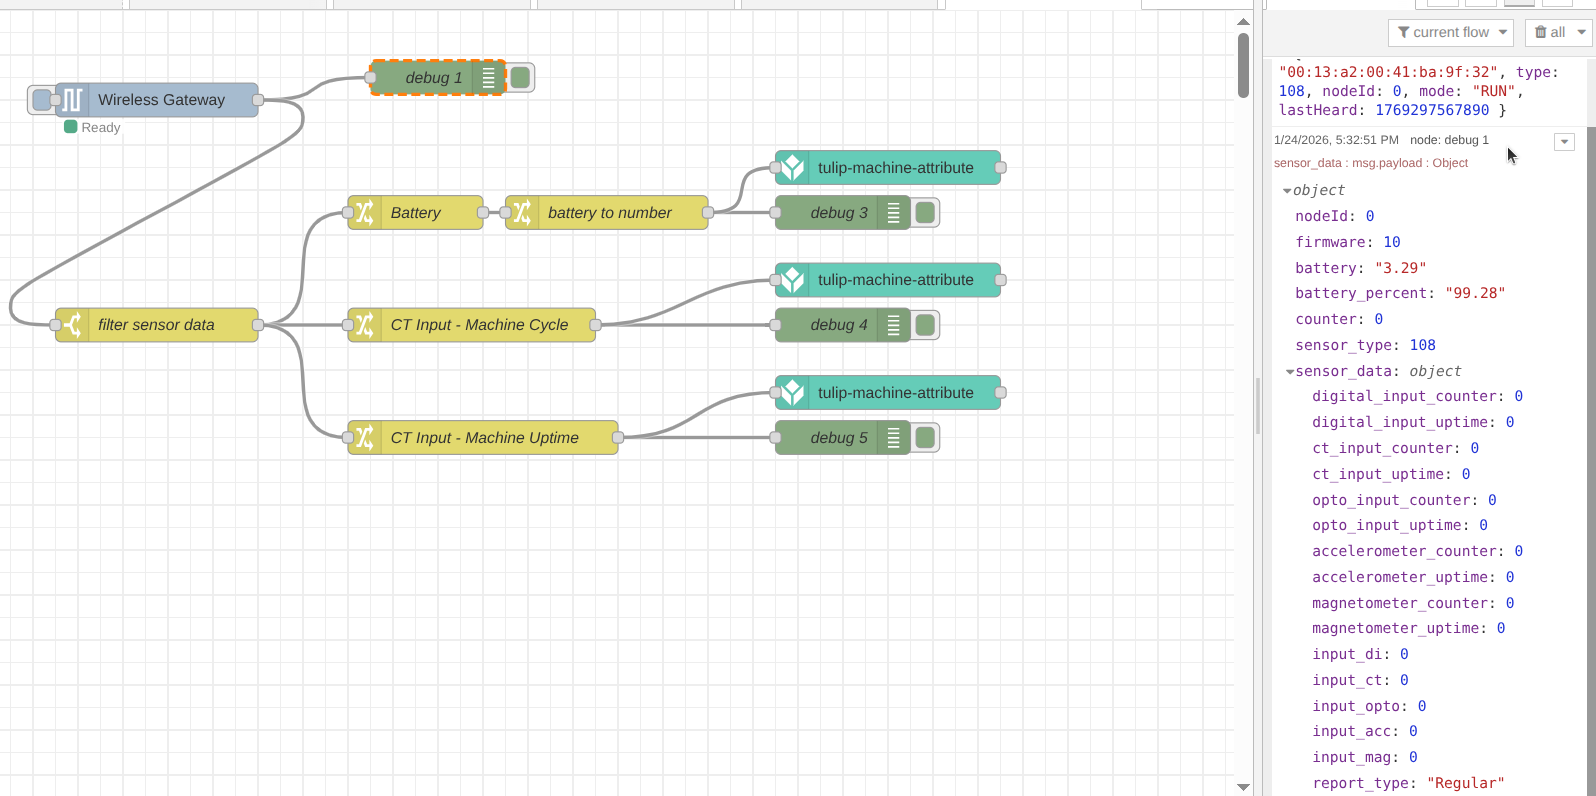
Once complete, click the Deploy button to save and apply your changes. To verify the flow, you can connect a Debug node to the output of each Change node and deploy again. When the next sensor transmission occurs, you will see each data point displayed separately in the debug sidebar—exactly what is needed to send individual values to the Tulip platform.
Click to Expand
NoteIf you have multiple sensors of different types connected to the gateway, it is best practice to add a Switch node to filter by sensor type. This ensures that only data from the relevant sensor reaches your logic.
NoteIf you are using multiple Machine Uptime Monitoring sensors, you should add a Switch node to filter data by MAC address. This allows you to route data specifically based on which individual sensor sent the transmission.
Tulip Library Installation
Now that we have created a flow to filter sensor messages and isolate individual properties, the next step is to install the Node-RED Tulip Library. This library provides nodes that communicate with the Tulip platform via the Tulip API, offering an intuitive way to transmit your data.
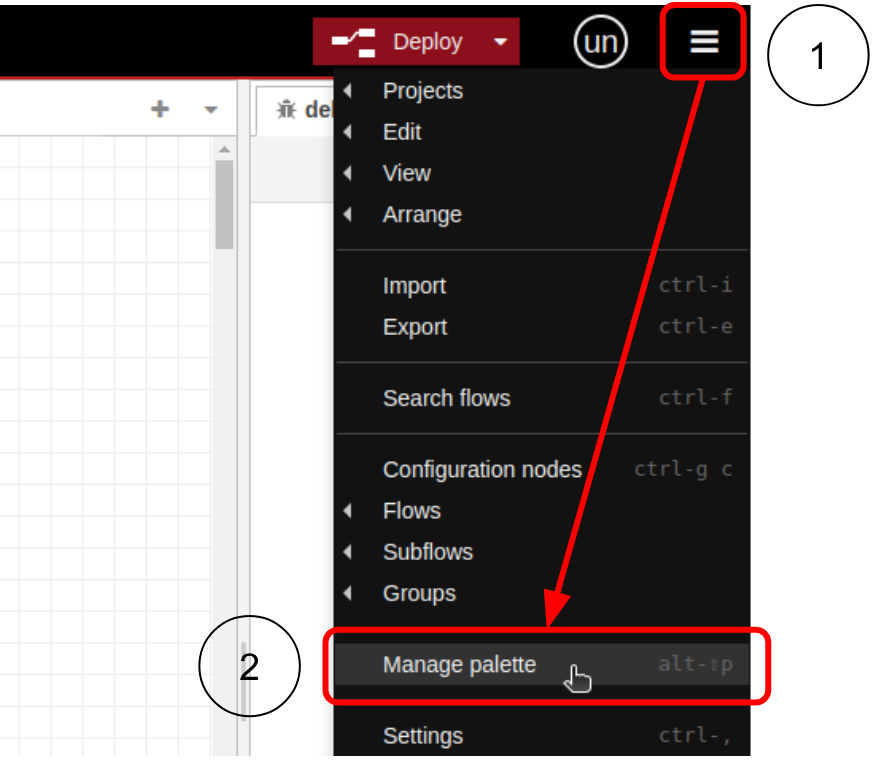
Step 1. Open your Node-RED editor and navigate to Menu, click on the Manage palette option.
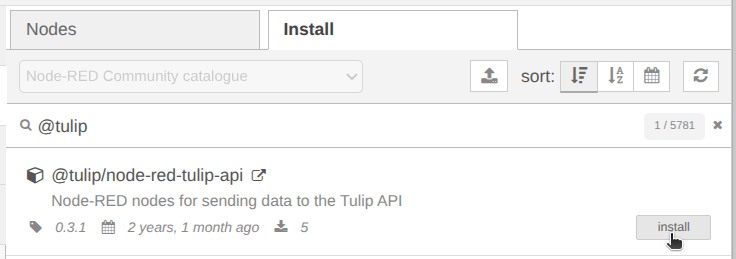
Step 2. Click on the Install tab and search for @tulip/node-red-tulip-api
Step 3. Click on the Install button, confirm the installation and wait for installation complete.
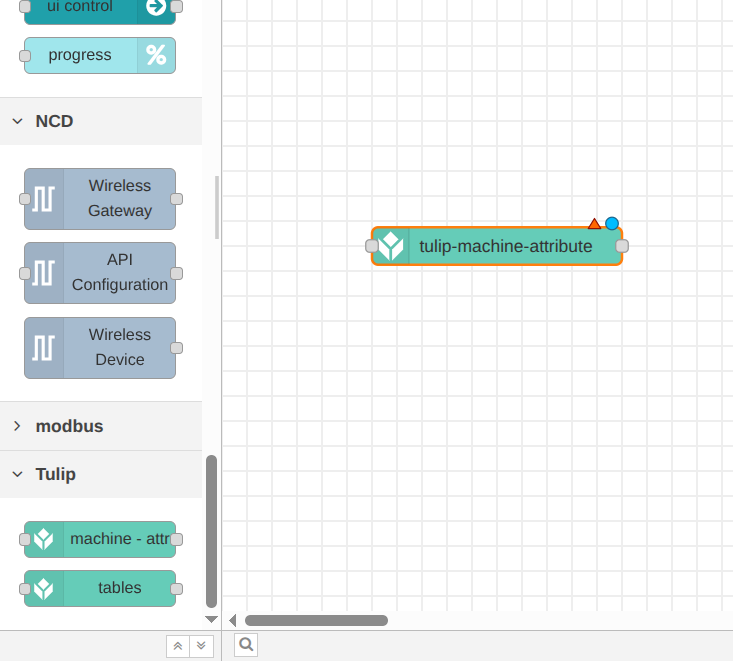
Step 4. If the installation is successful, the tulip-machine-attribute and tulip-tables nodes will be visible in the palette (left sidebar) under the category Tulip
Configuring the Tulip Platform
Before integrating the Tulip nodes into Node-RED, you must configure the Tulip platform to receive sensor data via the API. Access your Tulip account and complete the following configuration steps.
How to use the Machine Attributes API
The Machine Attributes API allows you to send data to a specific attribute of a Machine via a RESTful API using the /attributes/report endpoint. This enables many flexible options to integrate with Tulip from Node-RED, Python or other languages and services.
Setting up the Machine API
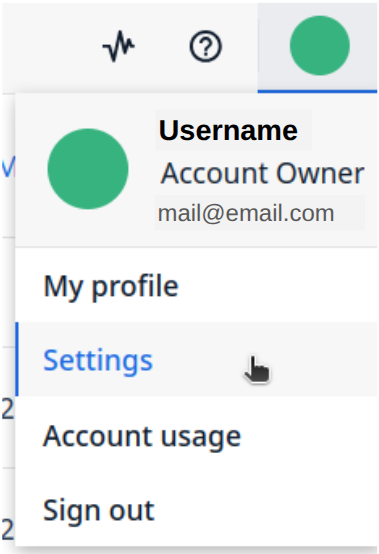
Step 1. Navigate to your account (located in the upper right) and click on Settings:
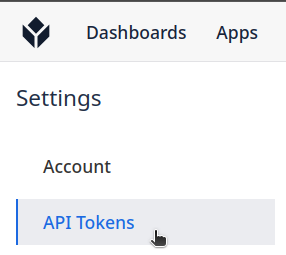
Step 2. On left menu click on API Tokens:
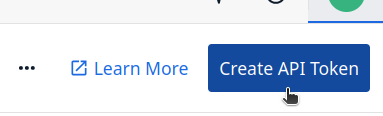
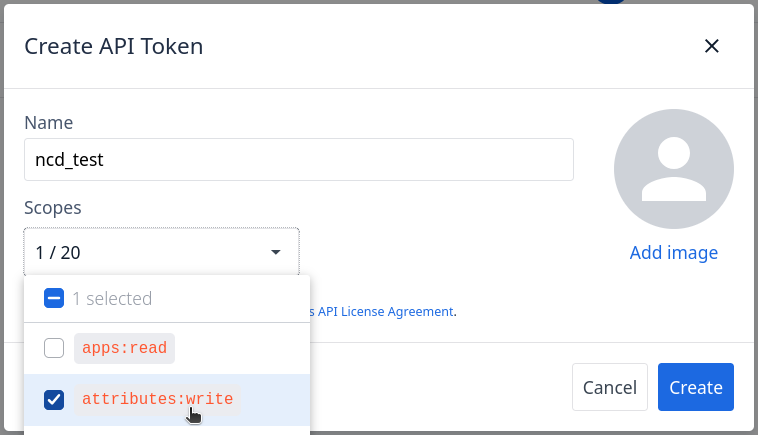
Step 3. Click Create API Token in the upper right-hand corner of your screen:
Step 4. Name your API Token, and select attributes:write for its scope:
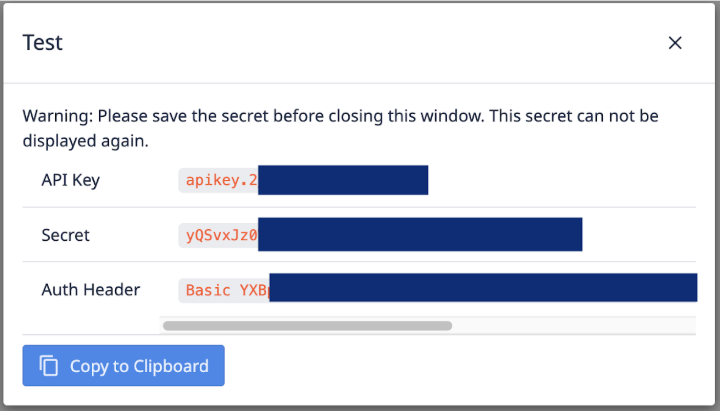
Step 5. A modal with your API Key, Secret and AuthHeader will appear. Please save this information as it cannot be accessed again.
Finally, Click on the Close button.
Create a Machine Type
Machine Types allow you to group machines by brand or functionality. Machine States, Attributes, DowntimeReasons, and Triggers are configurable for a machine type and all machines under this machine type will inherit these.
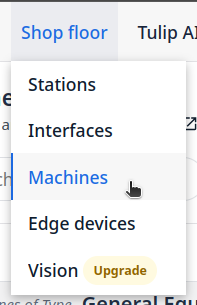
Step 1. Go to ‘Shop floor’ menu and click on the Machines option:
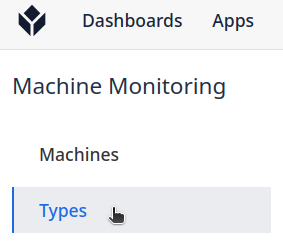
Step 2. Click on Types:
Step 3. Click on the ‘Create Machine Type’ button:
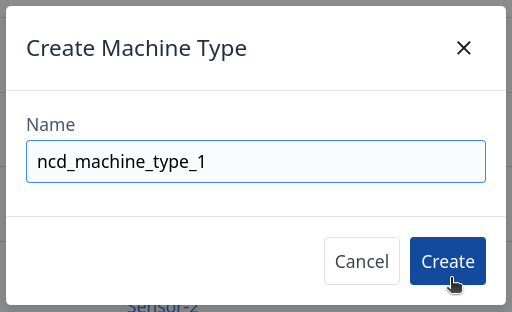
Step 4. Enter your Machine Type Name and click on the ‘Create’ button:
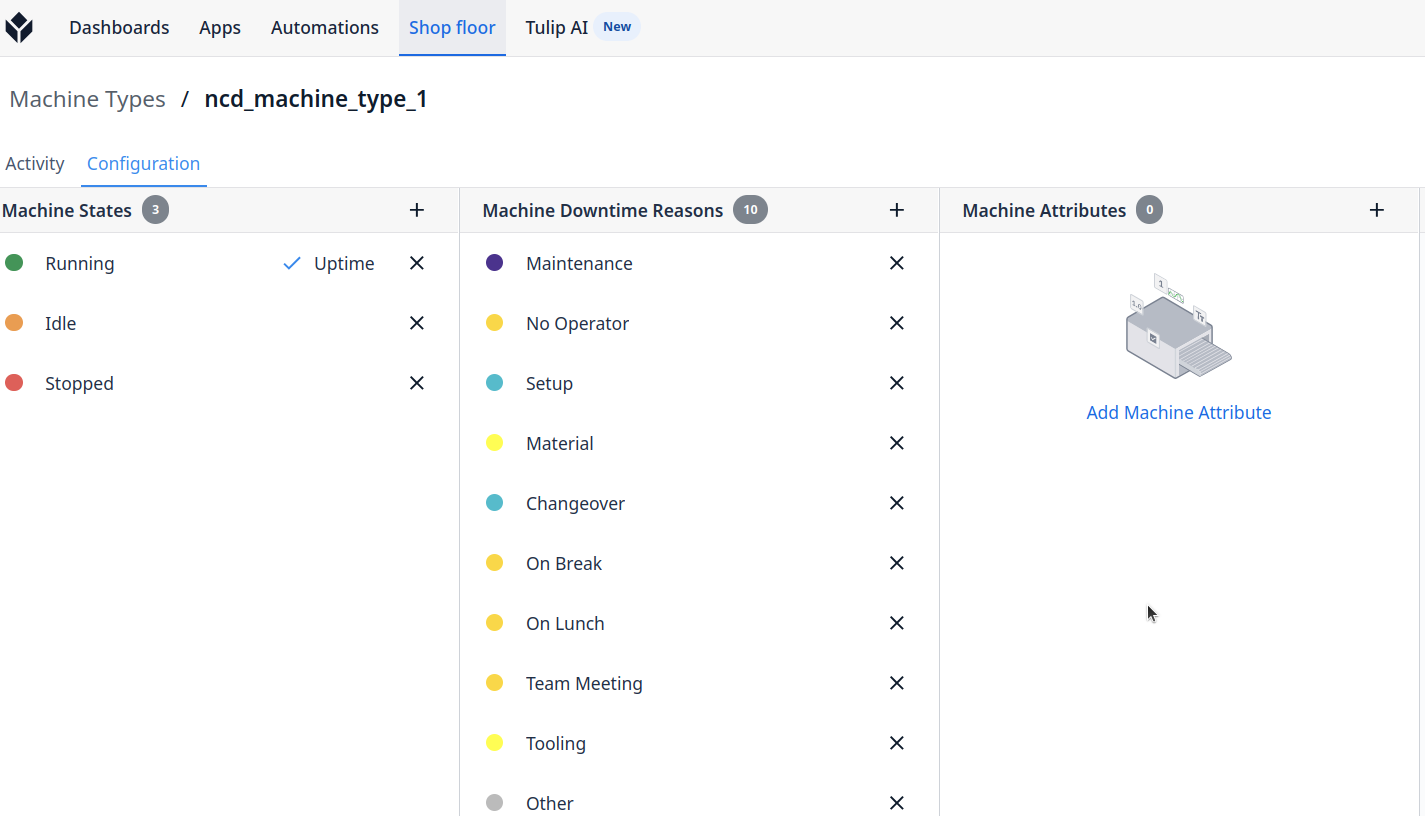
Step 5. Once you have created your machine type, you will see the following window:
Click to Expand
Setting up a new Machine
Machine: A Machine is a digital representation of a physical datasource. Machines have Attributes that are updated through the Tulip API.
Step 1. To create a new machine, navigate to the Machine Library, click on ‘Shop floor’ menu and select ‘Machines’:
Step 2. Click on the Create Machine button:
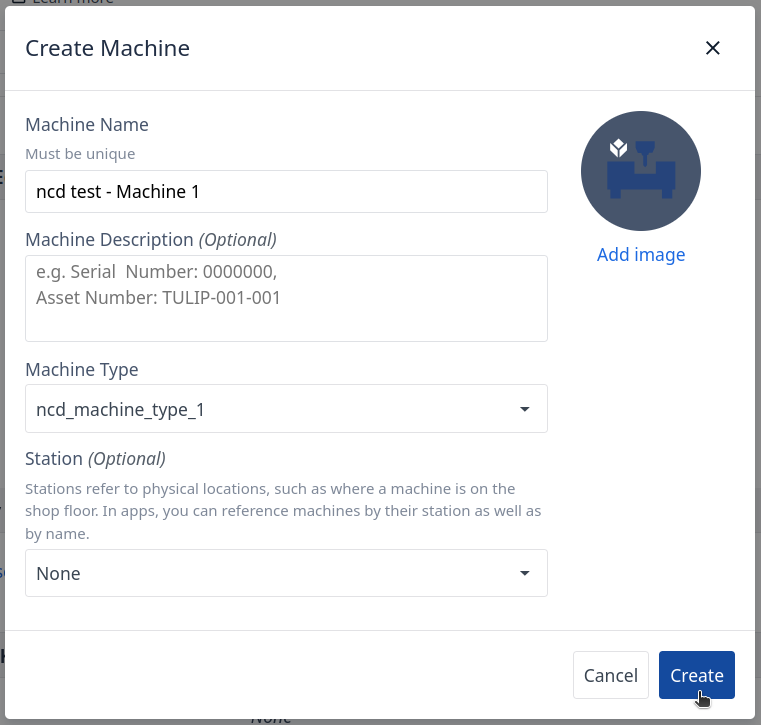
Step 3. The following modal will appear:
Machine Name (Required): Name your machine.
Machine Description (Optional).
Type (Required): If no Type is available create a type first, in this example the type created is named ncd_machine_type_1
Station (Optional).
Finally click on the ‘Create’ button.
Create a Machine Attribute
Now that your machine is created, you’ll need to add an attribute. Attributes are properties. In Tulip, an attribute generally references the property of a machine. Attributes can be either set points or actuals. Ex. Cycle time, Spindle speed, Feed rate, ect.
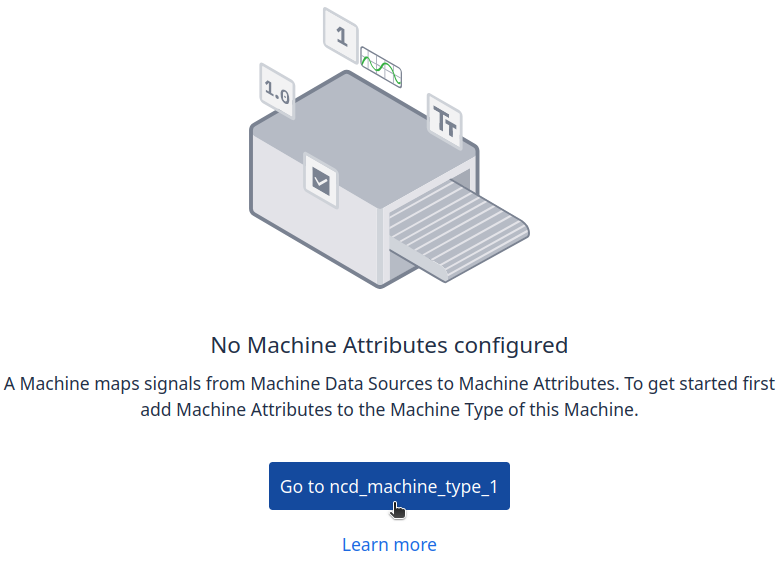
Step 1. Click on the ‘Go to ncd_machine_type_1’ button:
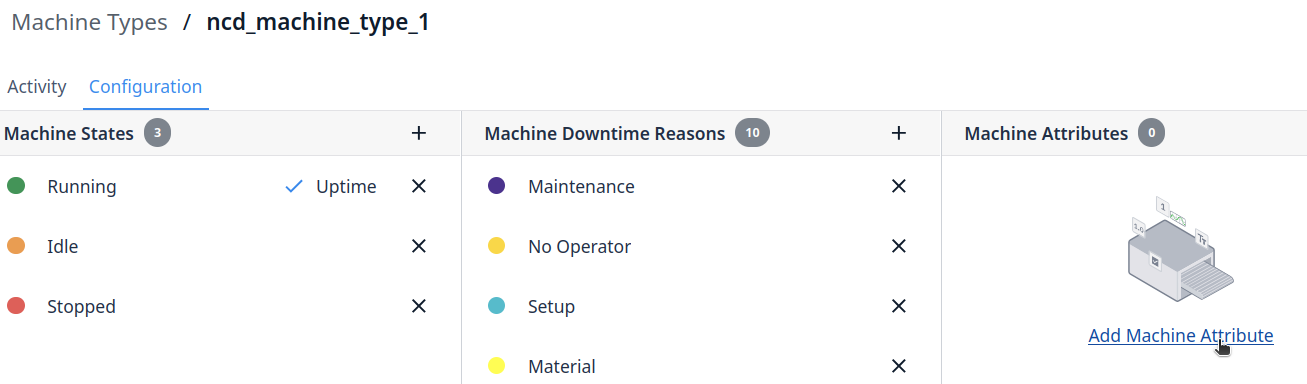
Step 2. You will see the following, click on the ‘Add Machine Attribute’ option:
Click to Expand
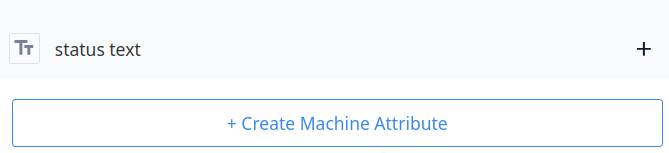
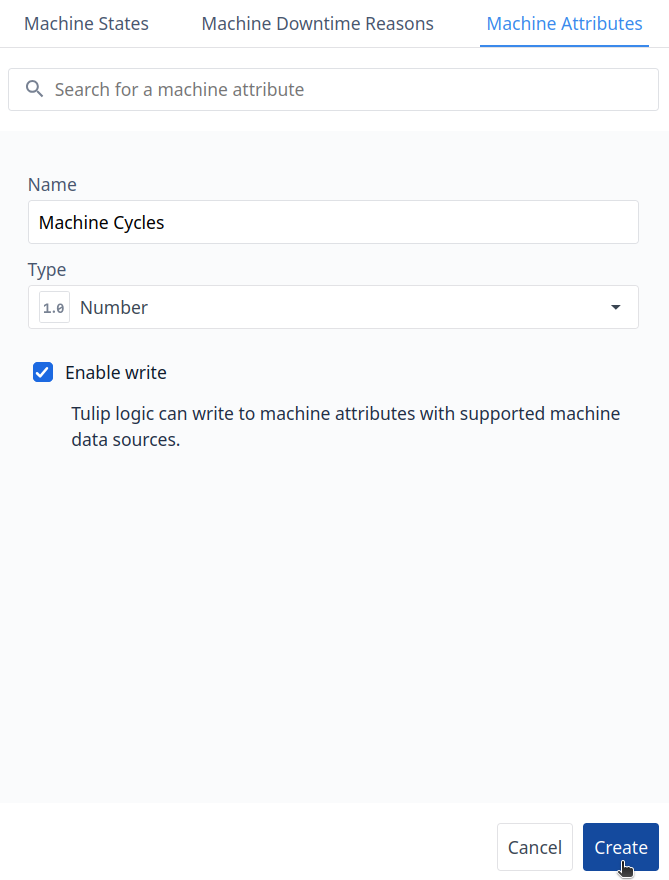
Step 3. Click on the ‘+ Create Machine Attribute’ button:
Step 4. You need to assign the Attribute Name and Type, for this example, Machine Cycle and Machine Uptime are Integer Type:
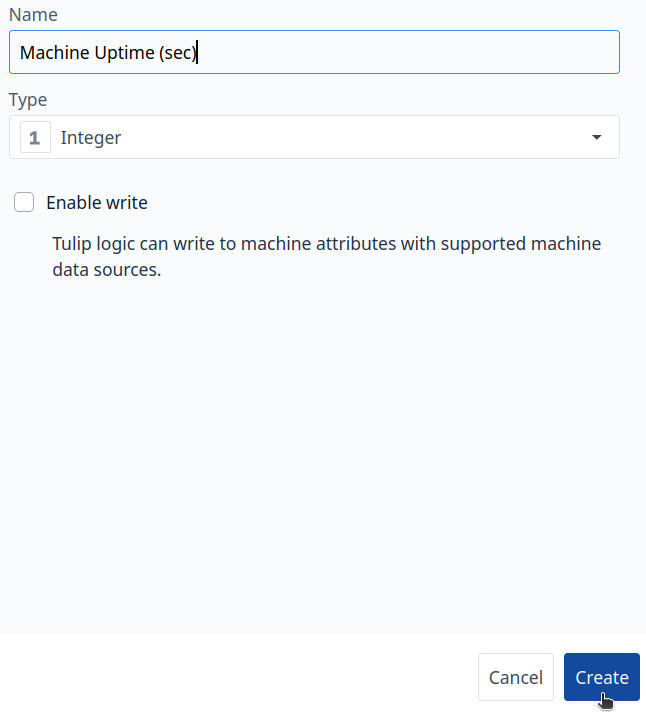
Step 5. Create a new attribute for Machine Uptime:
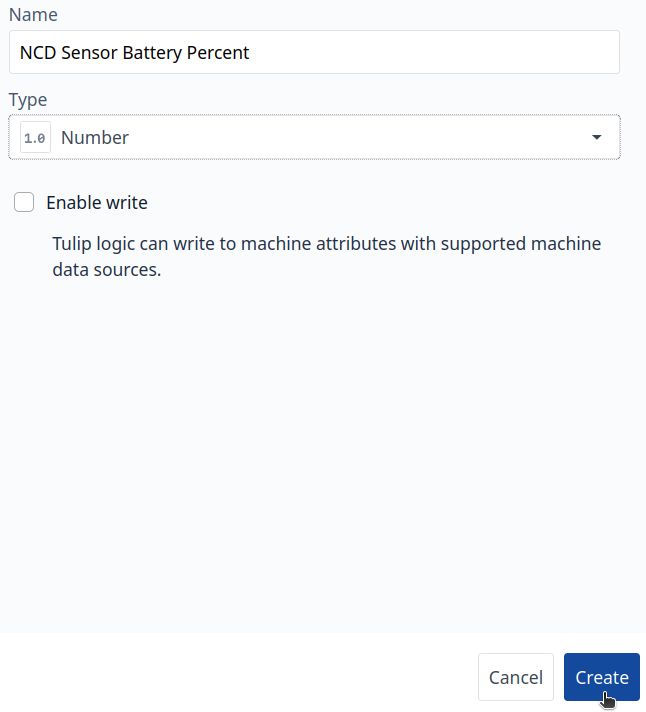
Step 6. Create a new attribute for the NCD Sensor Battery Percent, for this attribute the type could be Number:
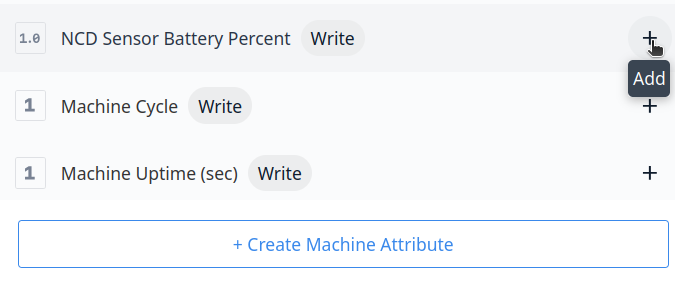
Step 7. The next step is to add the attributes to your machine, to do this, click on the ‘+’ add button:
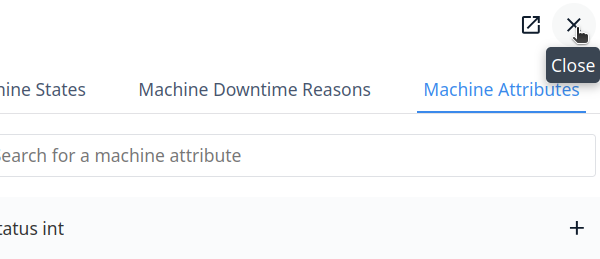
Step 8. Once you add the attributes, click on ‘Close’ button:
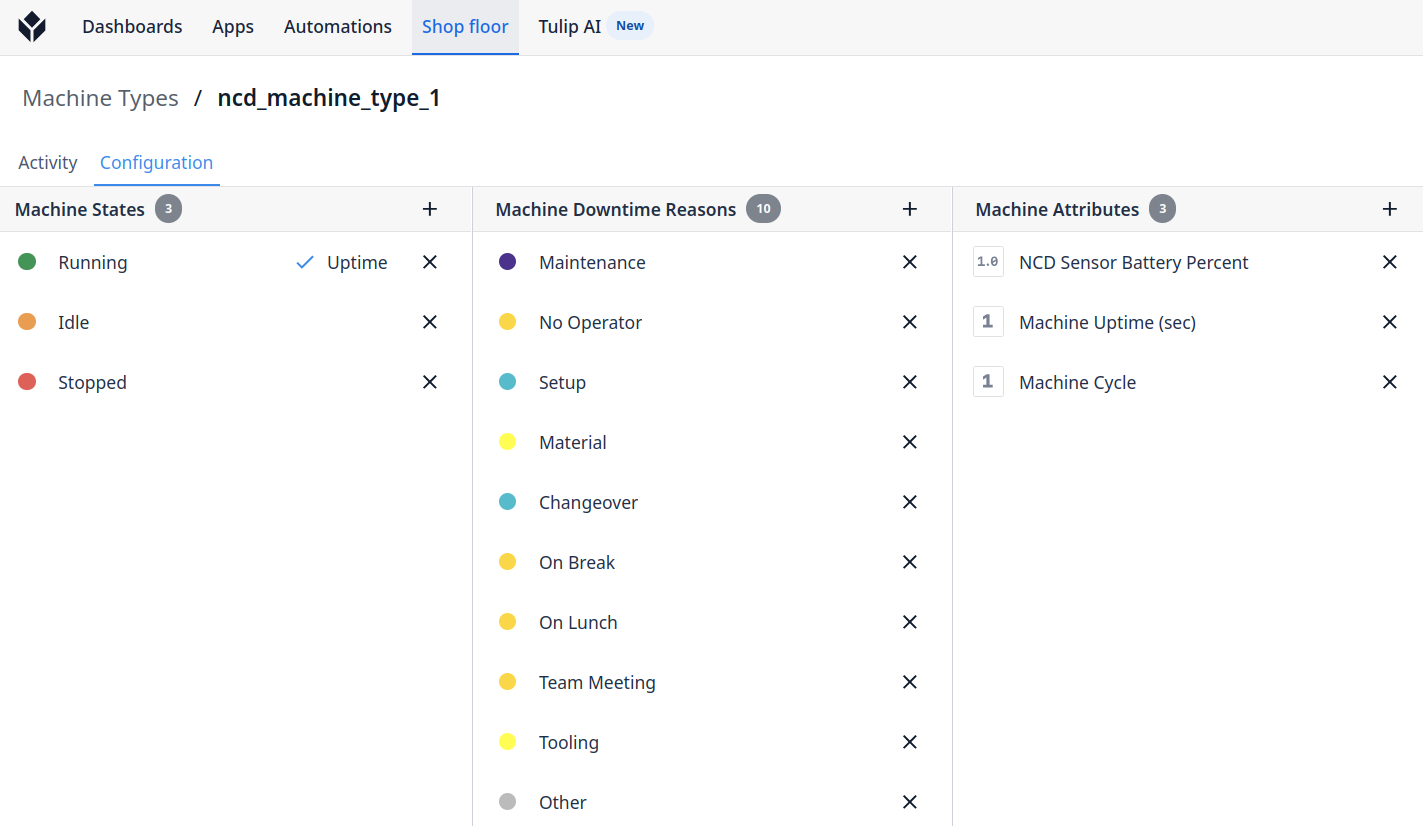
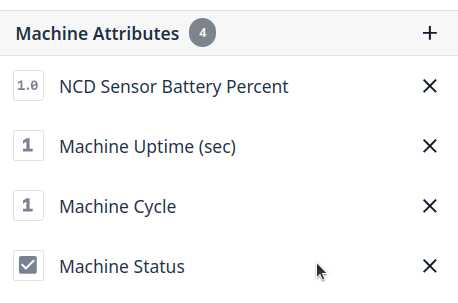
Step 9. Once you added your machine attributes you will see the following:
Click to Expand
Configure the Attributes Data Source
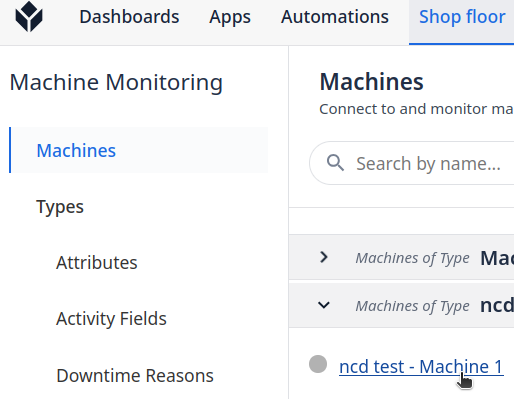
Step 1. Go to ‘Shop floor’ menu and click on ‘Machines’:
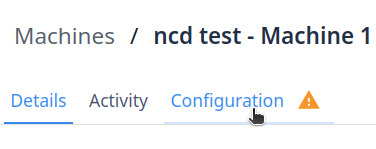
Step 2. Click on the machine you just set up:
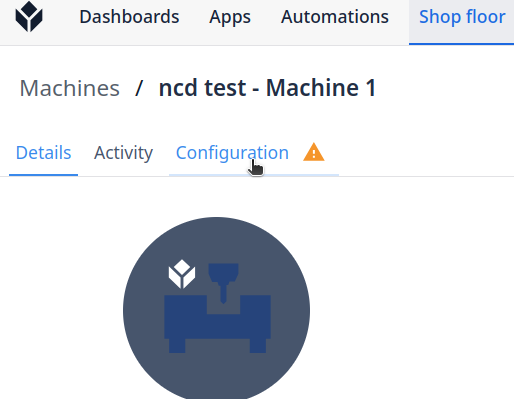
Step 3. Go to ‘Configuration’ tab:
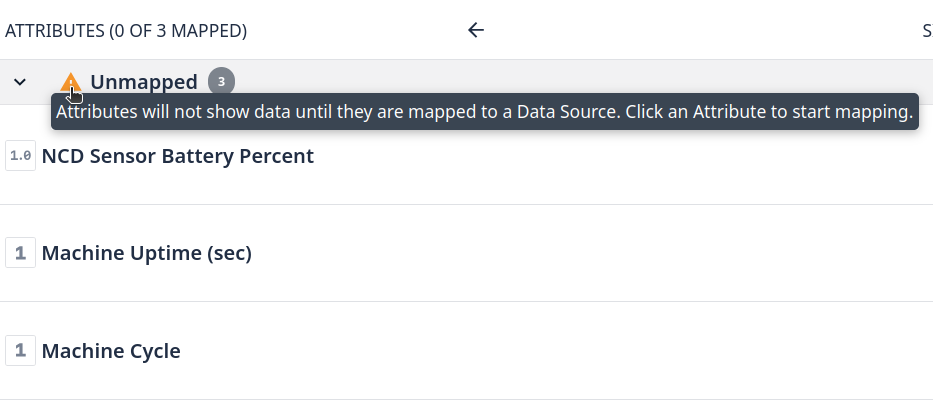
You will see that the new attributes are not mapped to a Data source:
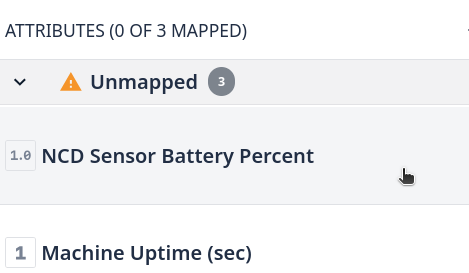
Step 4. Click on each attribute to access its properties:
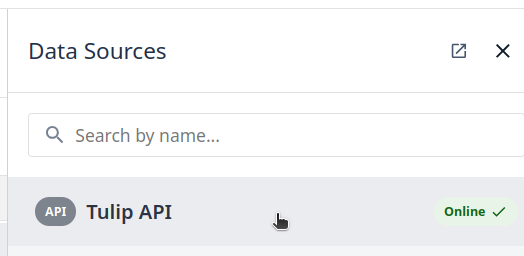
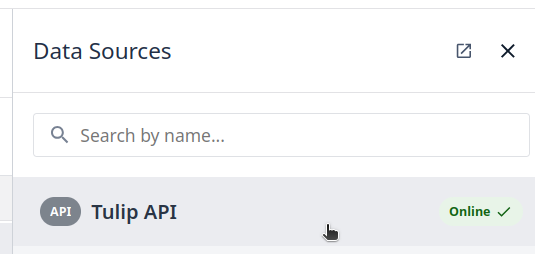
Step 5. Enable the Tulip API Data source for each attribute by clicking on ‘Tulip API’ option:
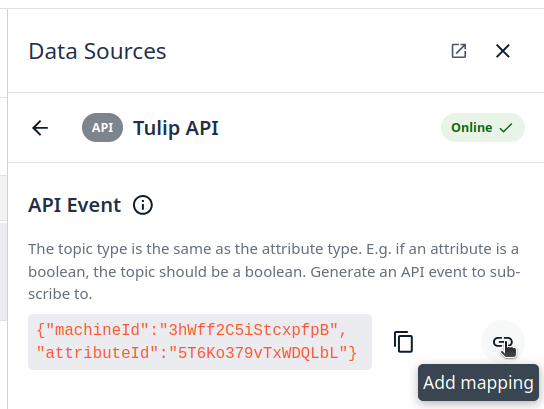
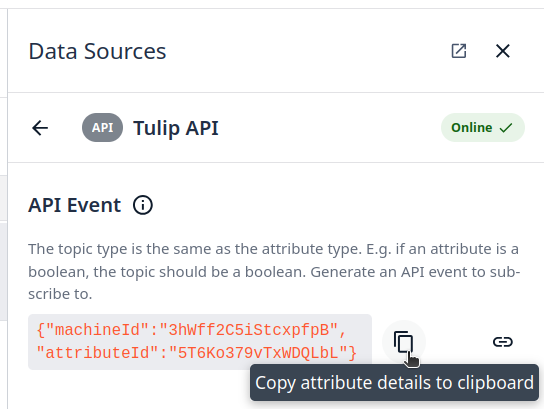
Step 6. Click on Add mapping Icon:
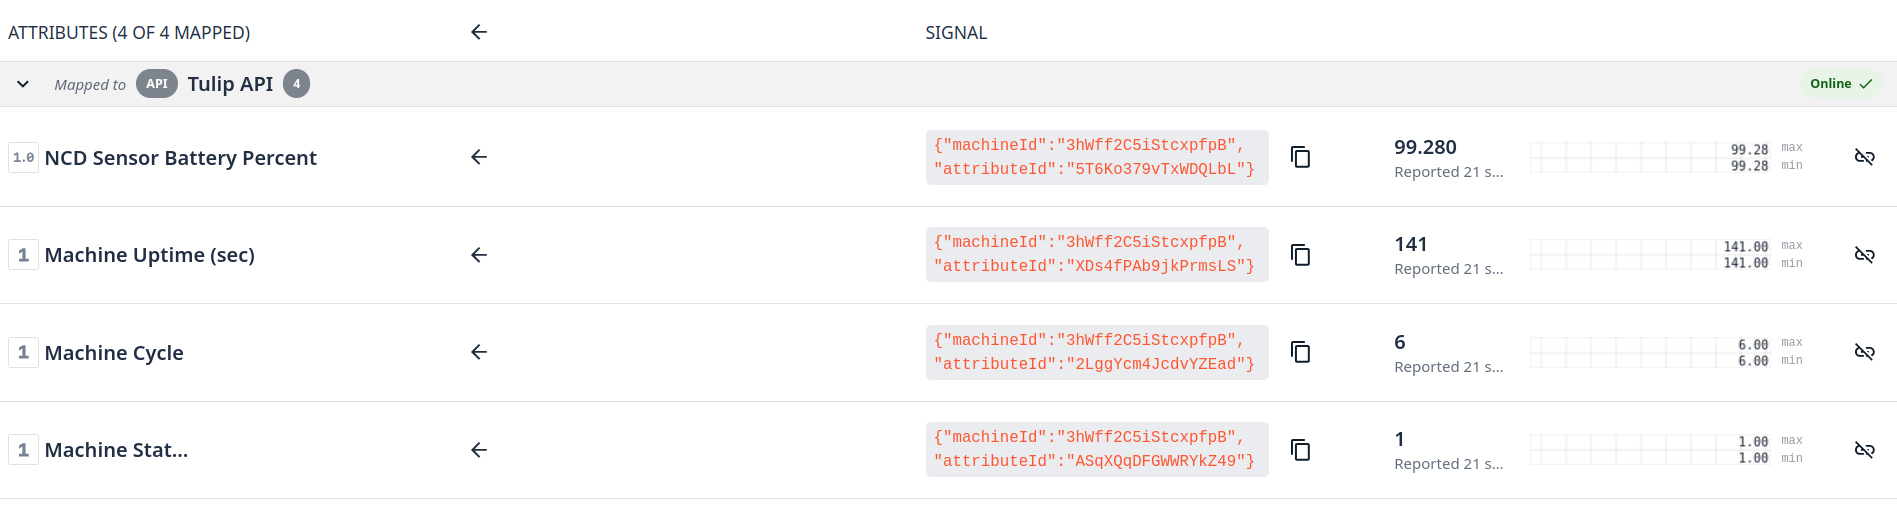
You can copy and save the attribute details; we will use this to configure the Node-RED Tulip Nodes.
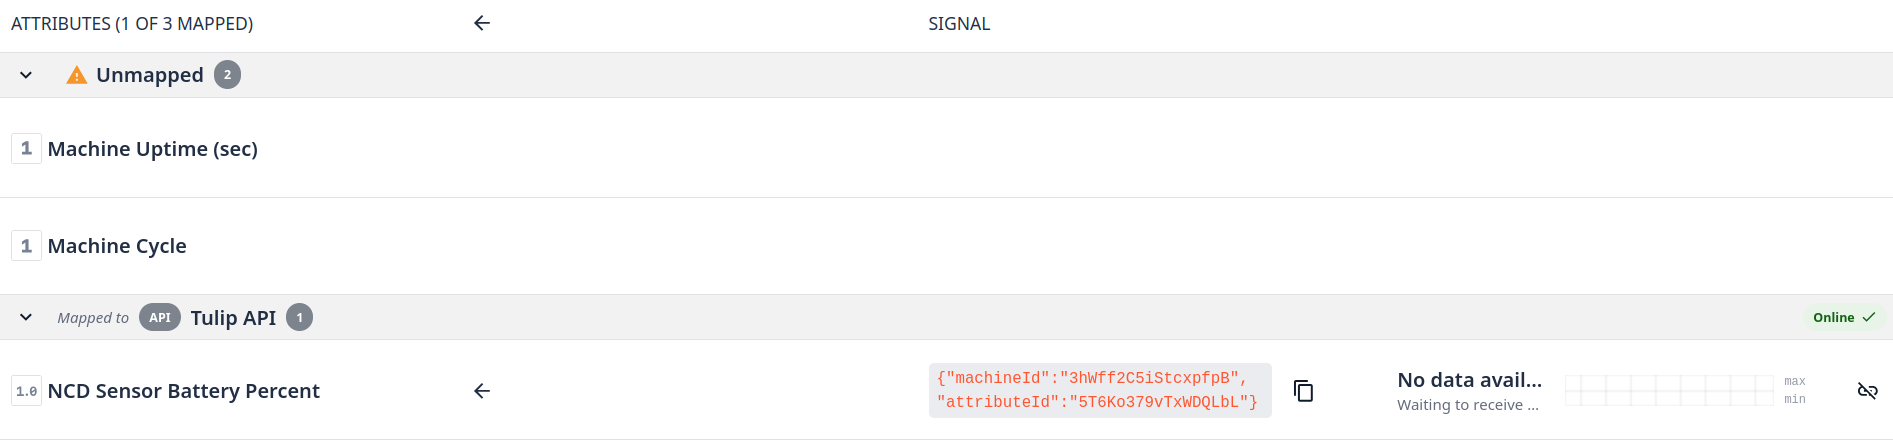
Once you map the data source you will see the attributes into mapped tab:
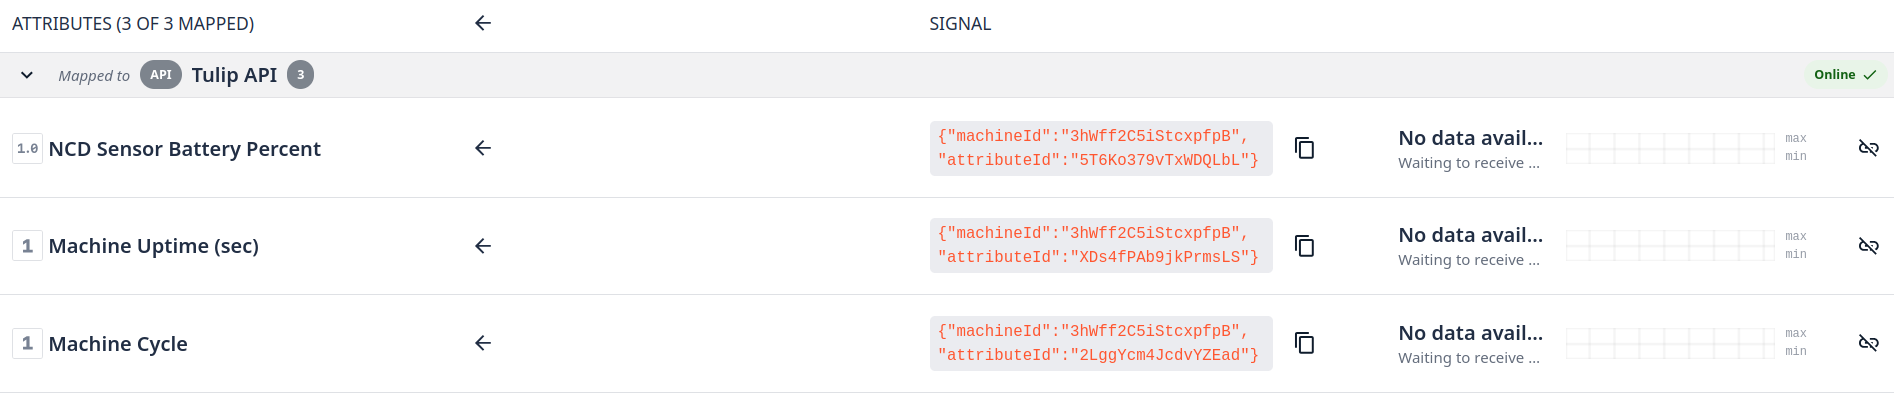
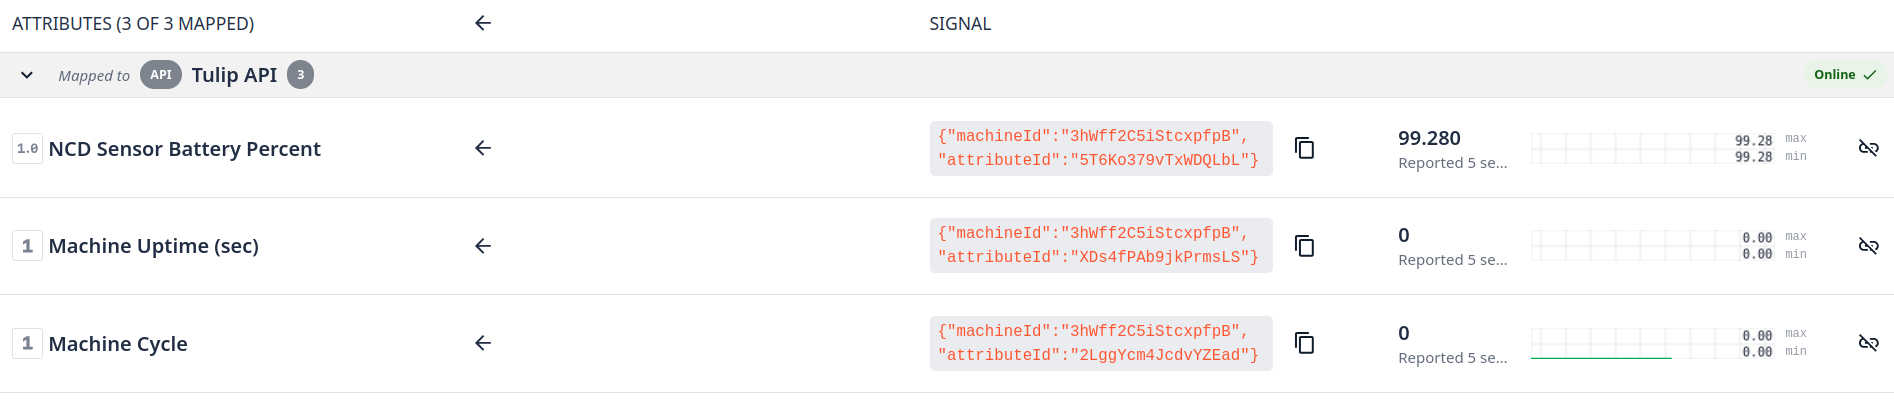
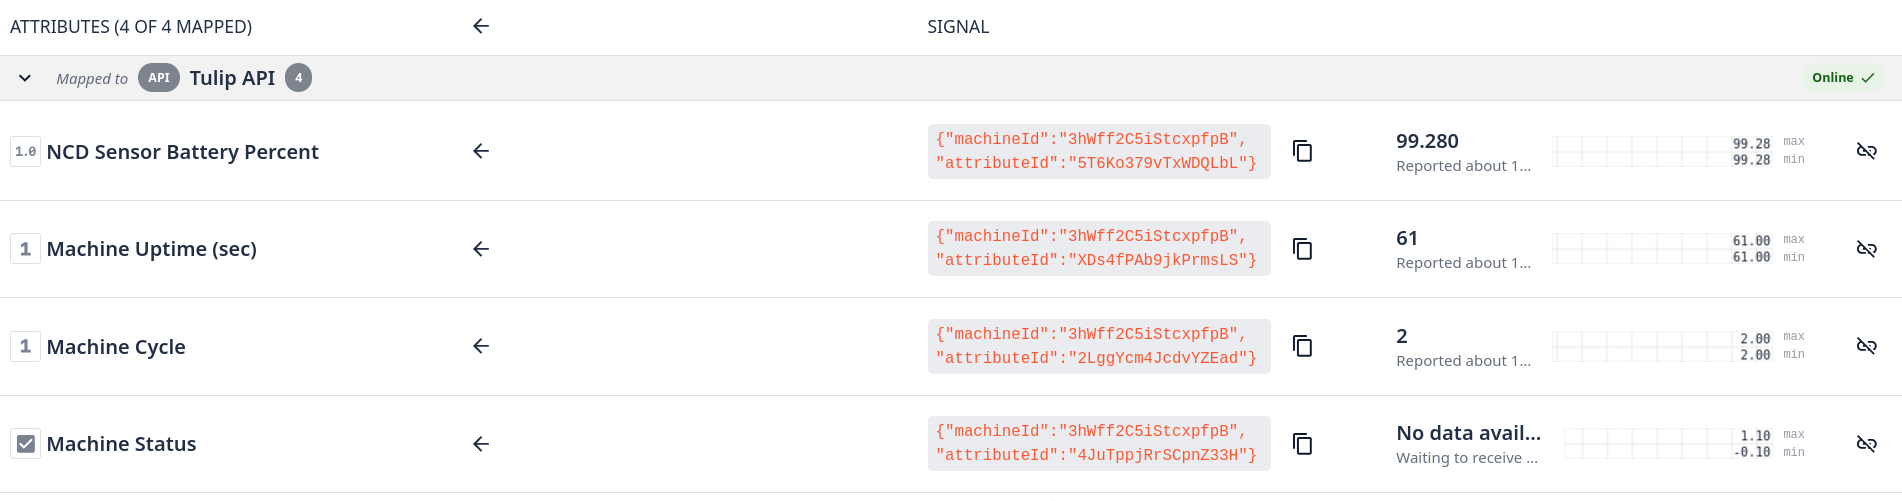
Step 7. You will need to map each attribute, after completing you will see something like this:
Configure the Tulip Node-RED Flow
Return to Node-RED on Enterprise IIoT Gateway. Drag and drop a Tulip Machine Attribute node into your flow.
Configure the tulip-machine-attribute node to match the target machine attribute. We will use the machine attribute we’ve configured previously. Note that the Machine Data Source is the Tulip API.
NoteFor example when expanding the “Device Info” field it will appear with the “attributeId” and
“deviceId” fields. The “deviceId” field name will need to be changed to “machineId”.
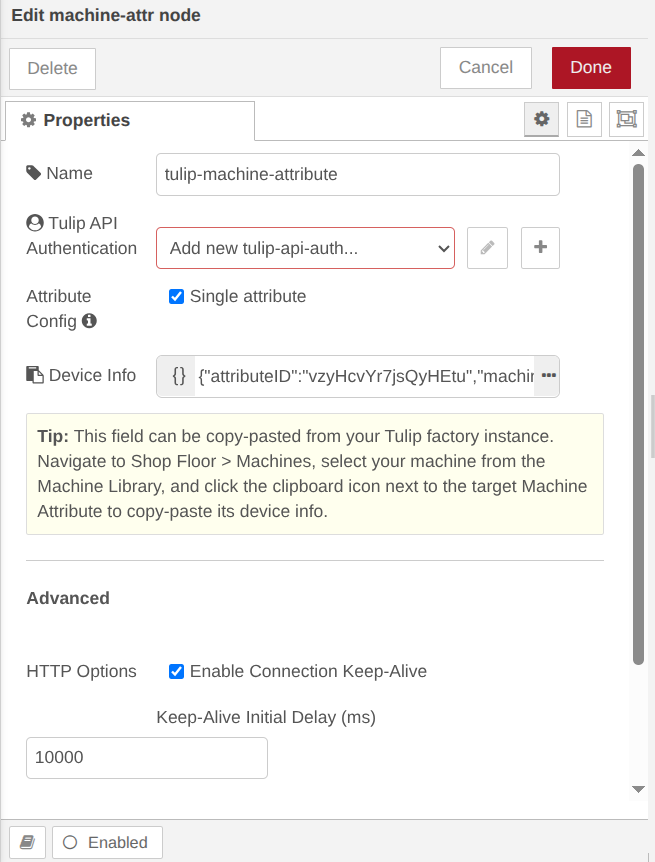
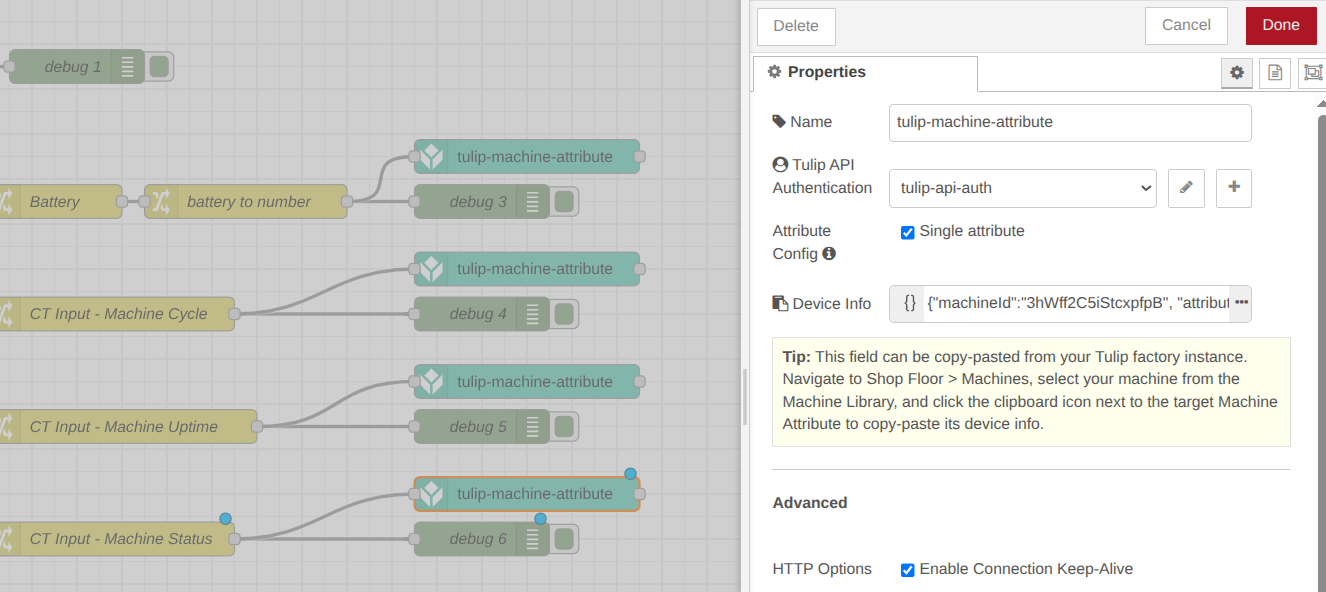
Step 1. Double-click the tulip-machine-attribute node to open its properties, then configure the node to match your specific machine attribute. For example, your configuration should look similar to this (We will configure the Tulip API Authentication node in next steps):
Tulip Api Authentication: A configuration node with authentication details for an API token on your Tulip account. The API token must have tables:read and tables:write permissions for read and write operations respectively. See more details in the Tulip API Auth Node section.
Attribute Config: If checked, specify a single machine attribute to send data to (identified by machineId and attributeId). Write values to that attribute through the configured attribute source.
If not checked, you can dynamically pass as msg.payload a list of attributes and values to write.
Device Info: This field can be copy-pasted from your Tulip factory instance. Navigate to Shop Floor > Machines, select your machine from the Machine Library, and click the clipboard icon next to the target Machine Attribute to copy-paste its device info. Don’t forget to change the “deviceId” string to “machineId” string to match what is in Tulip.
Advanced
HTTP Options:
Enable Connection Keep-Alive: Whether to set keepAlive=true for the http agent. Note that this sets the keep-alive behavior of the HTTP agent, which is different than setting the ‘Connection’: ‘Keep-Alive’ HTTP header. Keep-Alive Initial Delay (ms): Sets the keep-Alive Initial delay (ms) of the http agent. Only relevant is keep-alive is enabled.
Configuring the tulip-api-auth config node
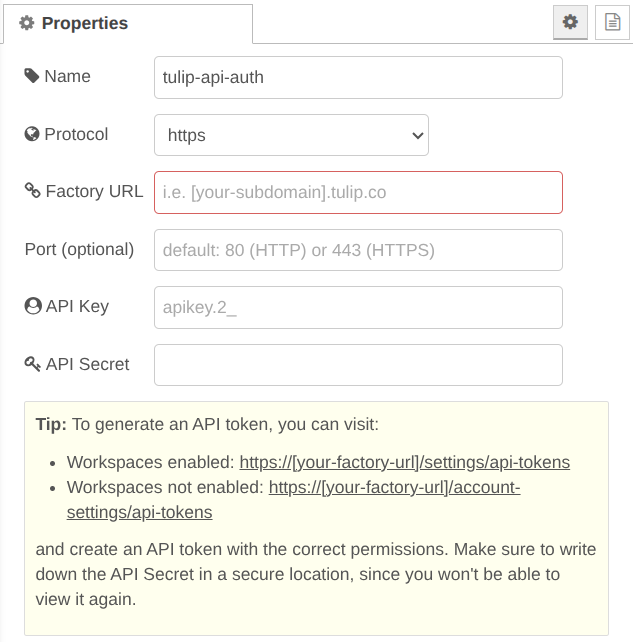
With the Tulip API Authentication node configured as follows (fill in your authentication credentials):
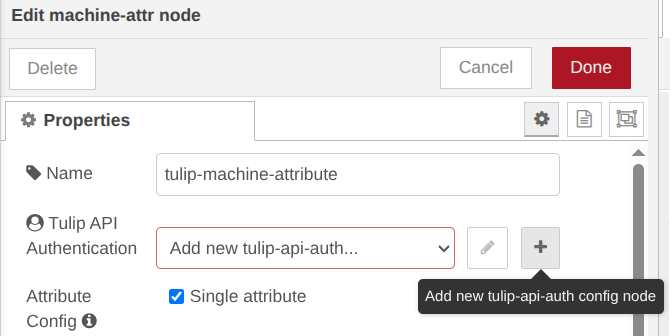
Step 1. Click on the ‘Add new tulip-api-auth config node’ button, then click on Update and then click on Done button.
Each tulip-api-auth node configures authentication for using the Tulip API. The API credentials should be for a key on the specified factory instance that has the correct permissions to make the specified API calls.
Protocol: Which protocol to use for API calls (http or https). Defaults to https. (keep as default) Factory URL: Your instance’s URL (e.g. acme.tulip.co). Use your own instance’s URL. Port (optional): Custom port to use for API calls. Defaults to 80 for http and 443 for https. (keep as default) API Key: Your API Key from the Machine API that you set up. Should start with “apikey.2_”. API Secret: Your API Secret from the Machine API that you set up.
Connecting the NCD Flow to Tulip
Once you have verified the connection and confirmed that data is appearing in your Tulip account, you can connect the NCD flow to your tulip-machine-attribute node to begin live data transmission. For this example, connect the output of the “CT Input – Machine Cycle” node to the “tulip-machine-attribute” node. Click the Deploy button and wait for the next sensor transmission.
As soon as the Enterprise IIoT Gateway receives sensor data, the flow will automatically transmit that data to the Tulip platform. You can replicate and configure the “tulip-machine-attribute” node for the battery and machine uptime signals.
NoteYou can reuse the same "tulip-api-auth" configuration node for all your "tulip-machine-attribute" nodes.
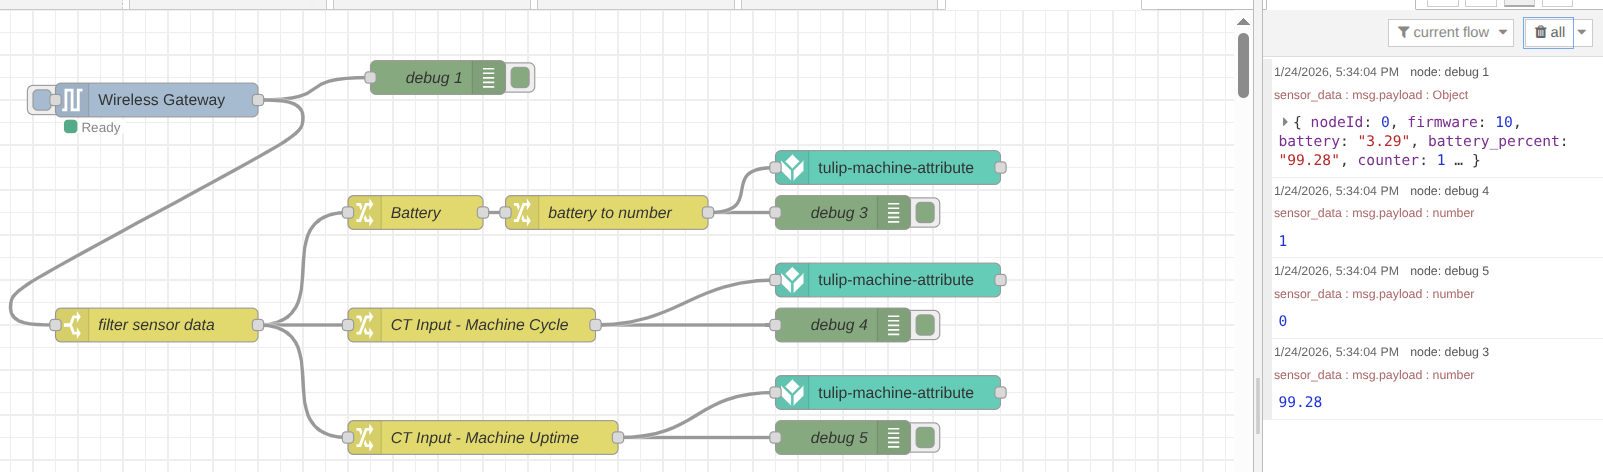
Now we can wait for the next data transmission or force a transmission by pressing the sensor’s RESET button. We can then verify the received values within the debug window in Node-RED.
If our Tulip node configuration is correct, we will be able to visualize the data within our Tulip window as follows:
As soon as the data from the Machine Uptime Monitoring sensor is updated, the values within the Tulip platform should be updated in the next data transmission.
Plus: Sending Current Machine Status
The Machine Uptime Monitoring Sensor also features the input_xx property group, which indicates the current logical status of each corresponding probe. For this application, we will focus on msg.payload.sensor_data.input_ct.
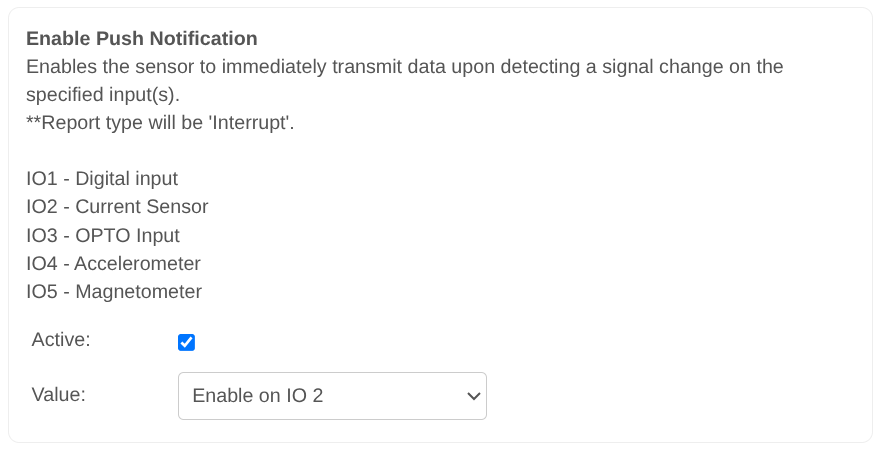
This property allows for the immediate detection of whether a machine is in a “Running” or “Stopped” state. As previously mentioned, the probe detects AC current flow, and the sensor can be configured to transmit data as soon as a status change occurs. With this configuration, the sensor does not only transmit data at user-defined intervals but also triggers an update whenever an input state changes. This ensures you receive a transmission the exact moment a machine starts or stops.
To enable this real-time reporting, we will use the Enable Push Notification setting:
NotePlease refer to the Machine Uptime Monitoring Sensor User Manual for more reference about the Enable Push Notification Setting.
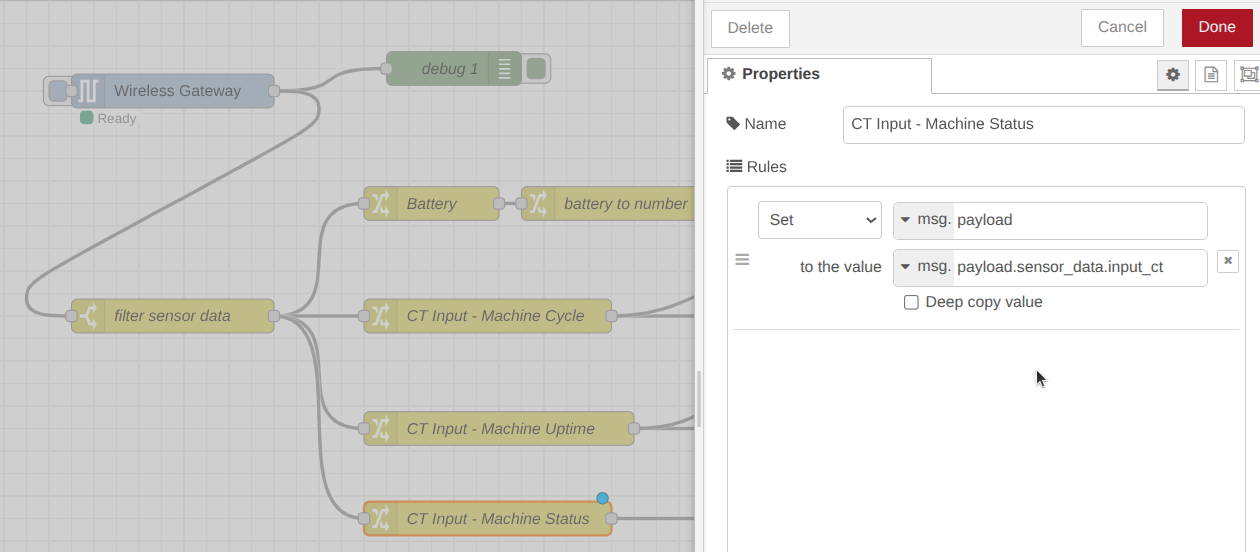
Step 1. Add a new change node, then set the msg.payload to the value msg.payload.sensor_data.input_ct, then click on the Done button.
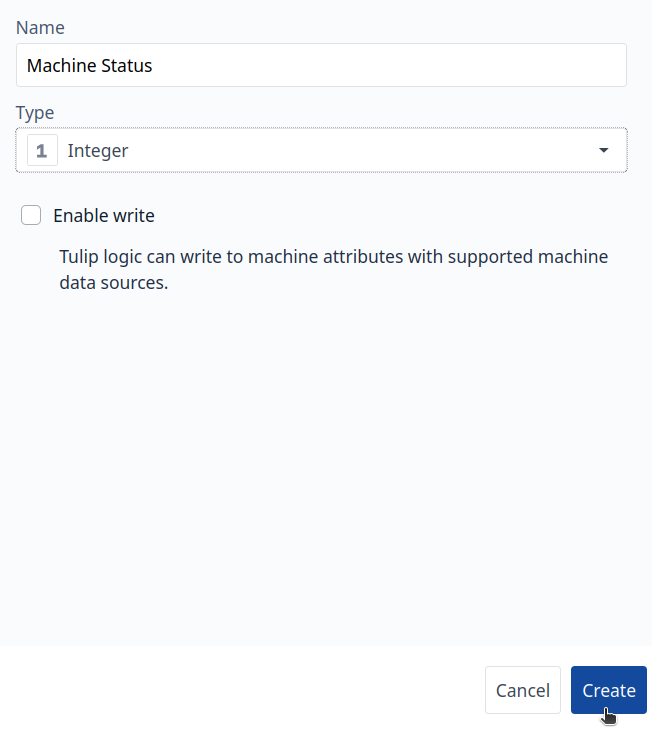
Step 2. Then go to your Tulip platform, and add a new Machine Attribute:
Step 3. Assign an Attribute name and Type, in this case for Machine Status Type is Integer (the value can be 0 or 1).
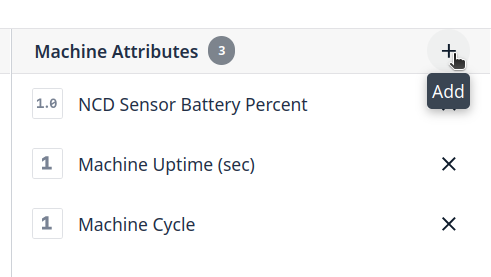
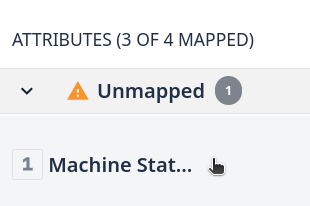
Step 4. Add the Attribute to your Machine, you will see something like this:
Step 5. Now you will need to map the new attribute, go to ‘Shop floor’ menu, then click on Machines:
Step 6. Go to Configuration Tab:
Step 7. Click on the ‘Machine Status’ attribute:
Step 8. Select Tulip API option
Step 9. Copy the attribute details, we will use it into the Node-RED Tulip node.
Step 10. Then click on Add mapping
Now the Machine Status attribute is configured and mapped correctly.
Click to Expand
Step 11. Go to your Node-RED instance, copy and paste a new ‘tulip-machine-attribute’ node and replace the Device info with the Machine Status attribute details and click on the Done button:
Click to Expand
Step 12. Click on the Deploy button to save and apply the changes:
Step 13. You can connect a debug node to check the data, once you receive the next sensor transmission you will see something like this:
Click to Expand
Step 14. If you go back to your Tulip platform you will see the Status data:
Click to Expand
At this point, you have successfully mapped the sensor’s battery percentage, machine uptime (in seconds), machine cycles, and real-time machine status to the Tulip platform. You can now leverage Tulip’s advanced features—such as custom logic, automated alarms, data analytics, and interactive dashboards—to maximize your operational insights.
As an optional next step, we will demonstrate how to create a Machine Trigger using the “Machine Status” attribute to dynamically assign machine states. For a deeper dive into these capabilities, we recommend exploring the extensive resources available in the official Tulip documentation.
Adding Machine Triggers
Step 1. Go to ‘Shop floor’ and click on ‘Machines’:
Step 2. Click on Types option
Step 3. Click on your machine type:
Step 4. Click on ‘Create Machine Trigger’ option:
Click to Expand
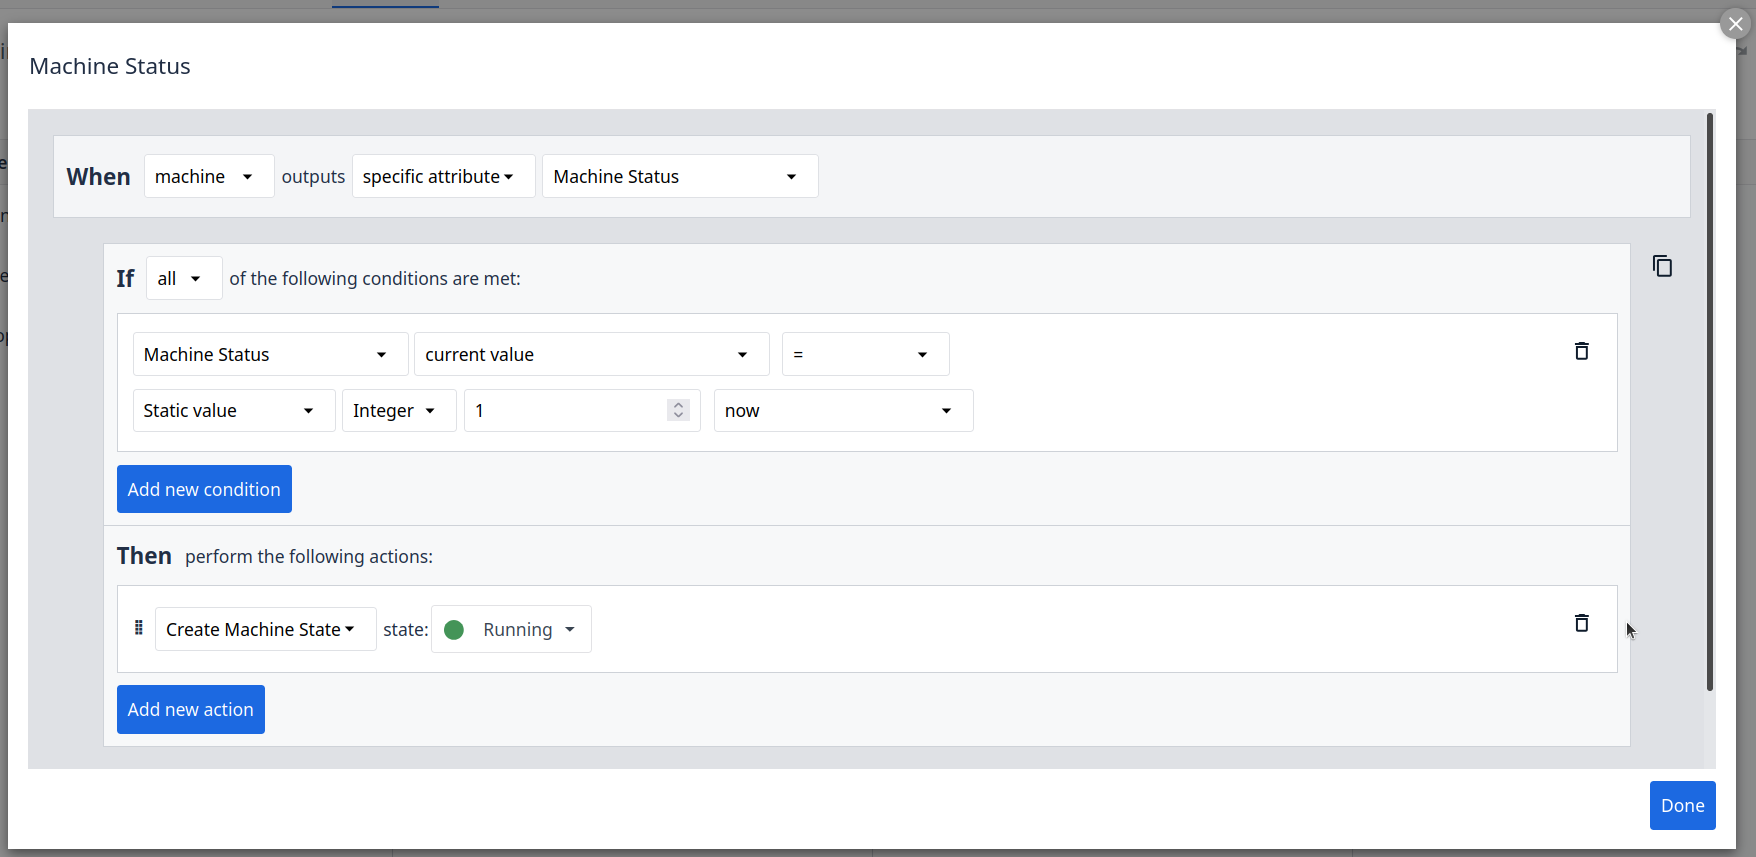
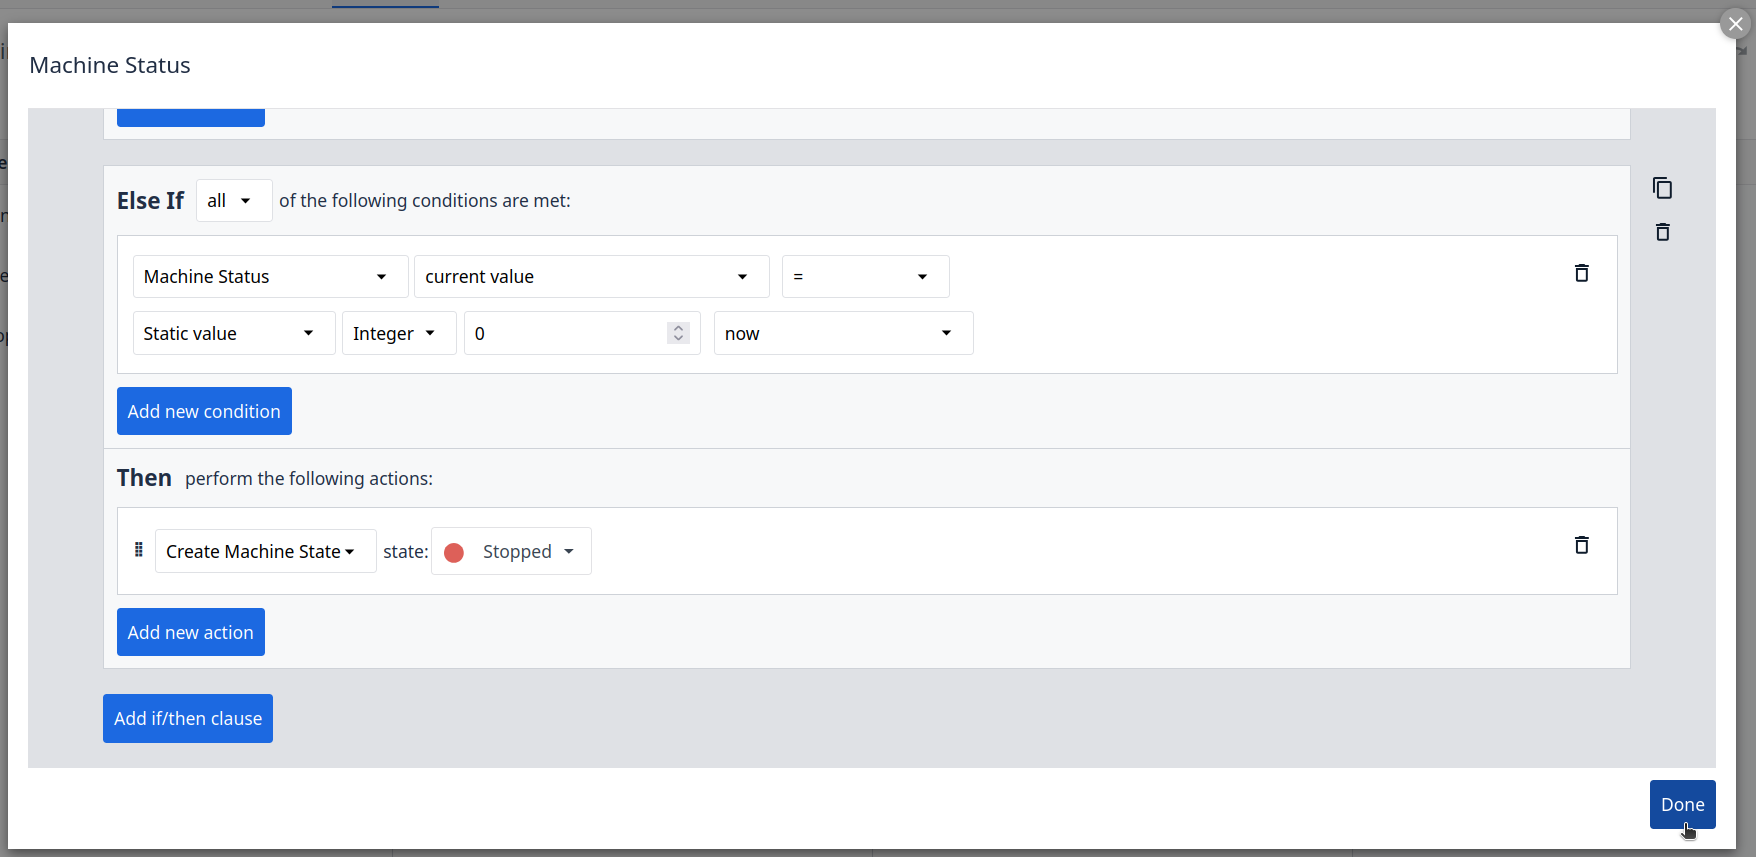
Step 5. Here we can create custom logic using no-code elements, configure the follow settings here:
Click to Expand
Click to Expand
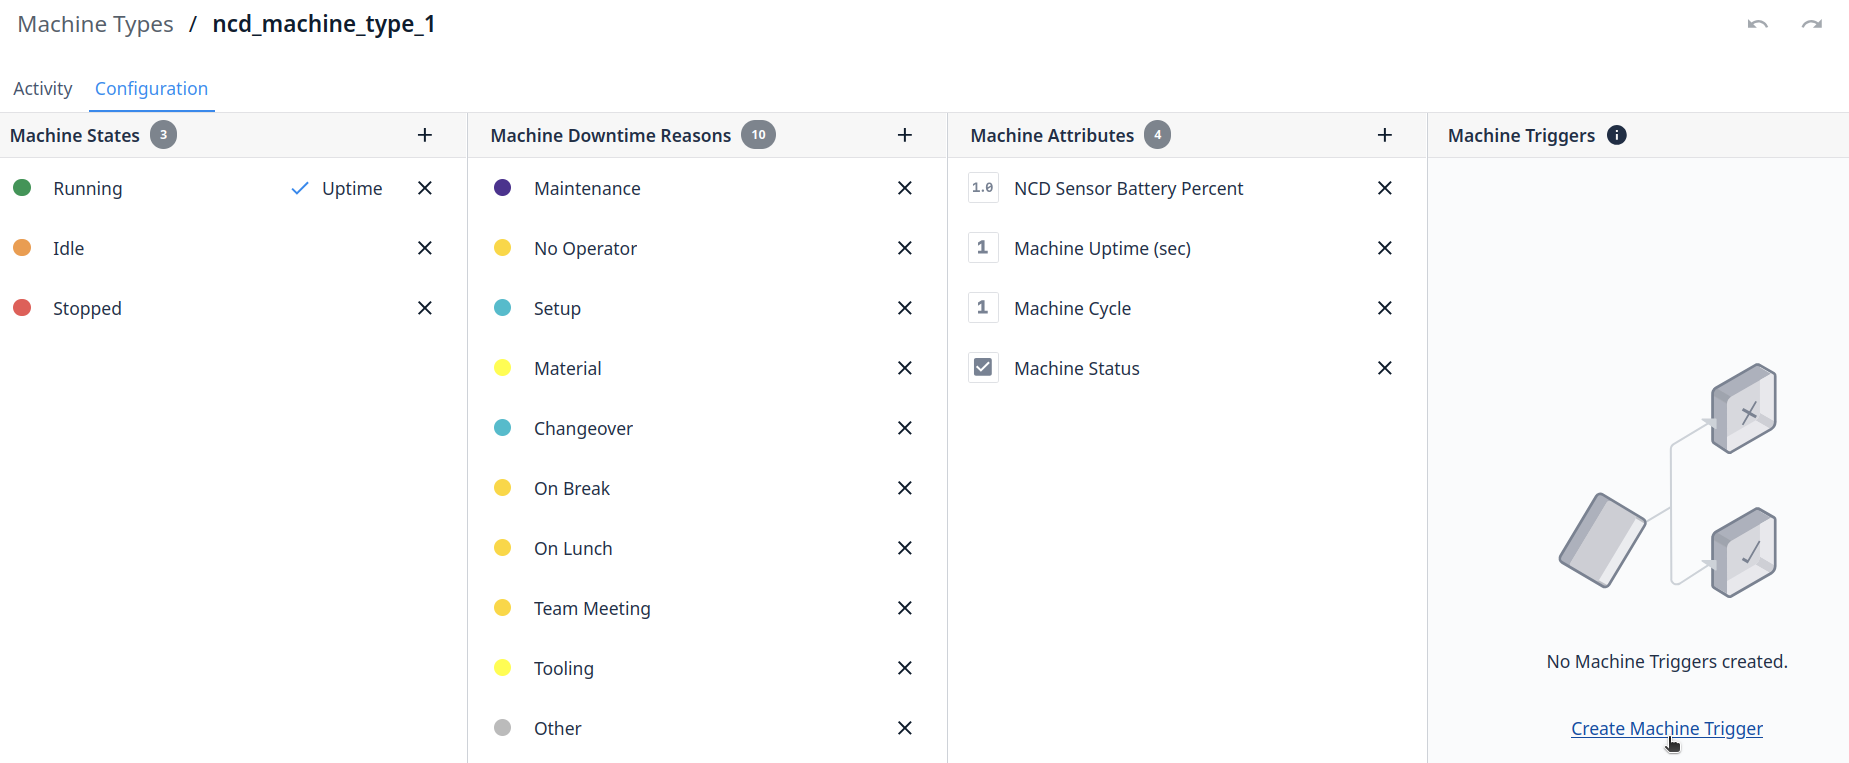
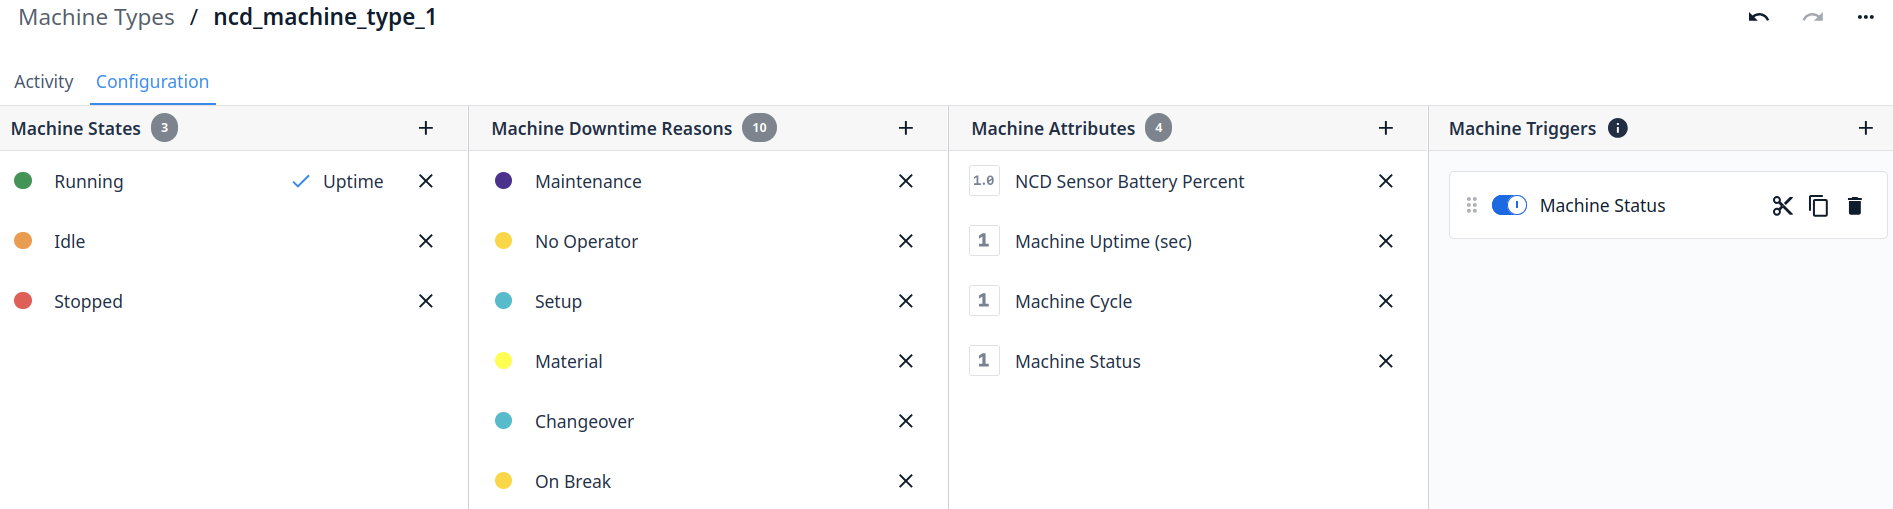
Step 6. You will see the new configured Machine trigger
Click to Expand
Step 7. Go to ‘Shop floor’ and click on Machines:
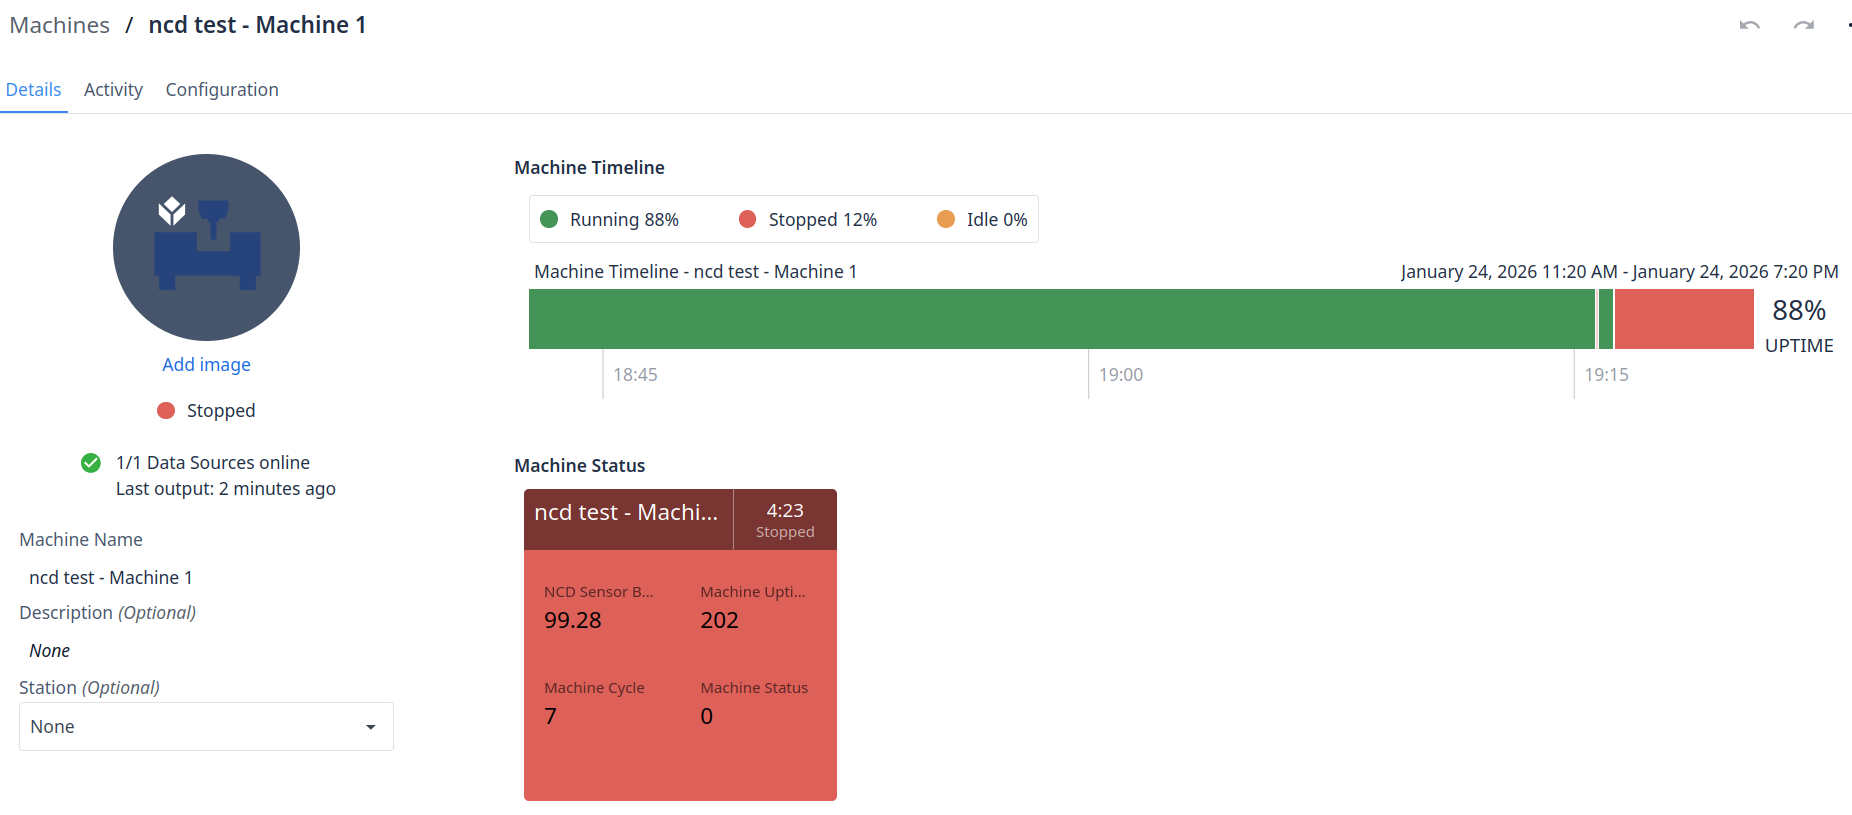
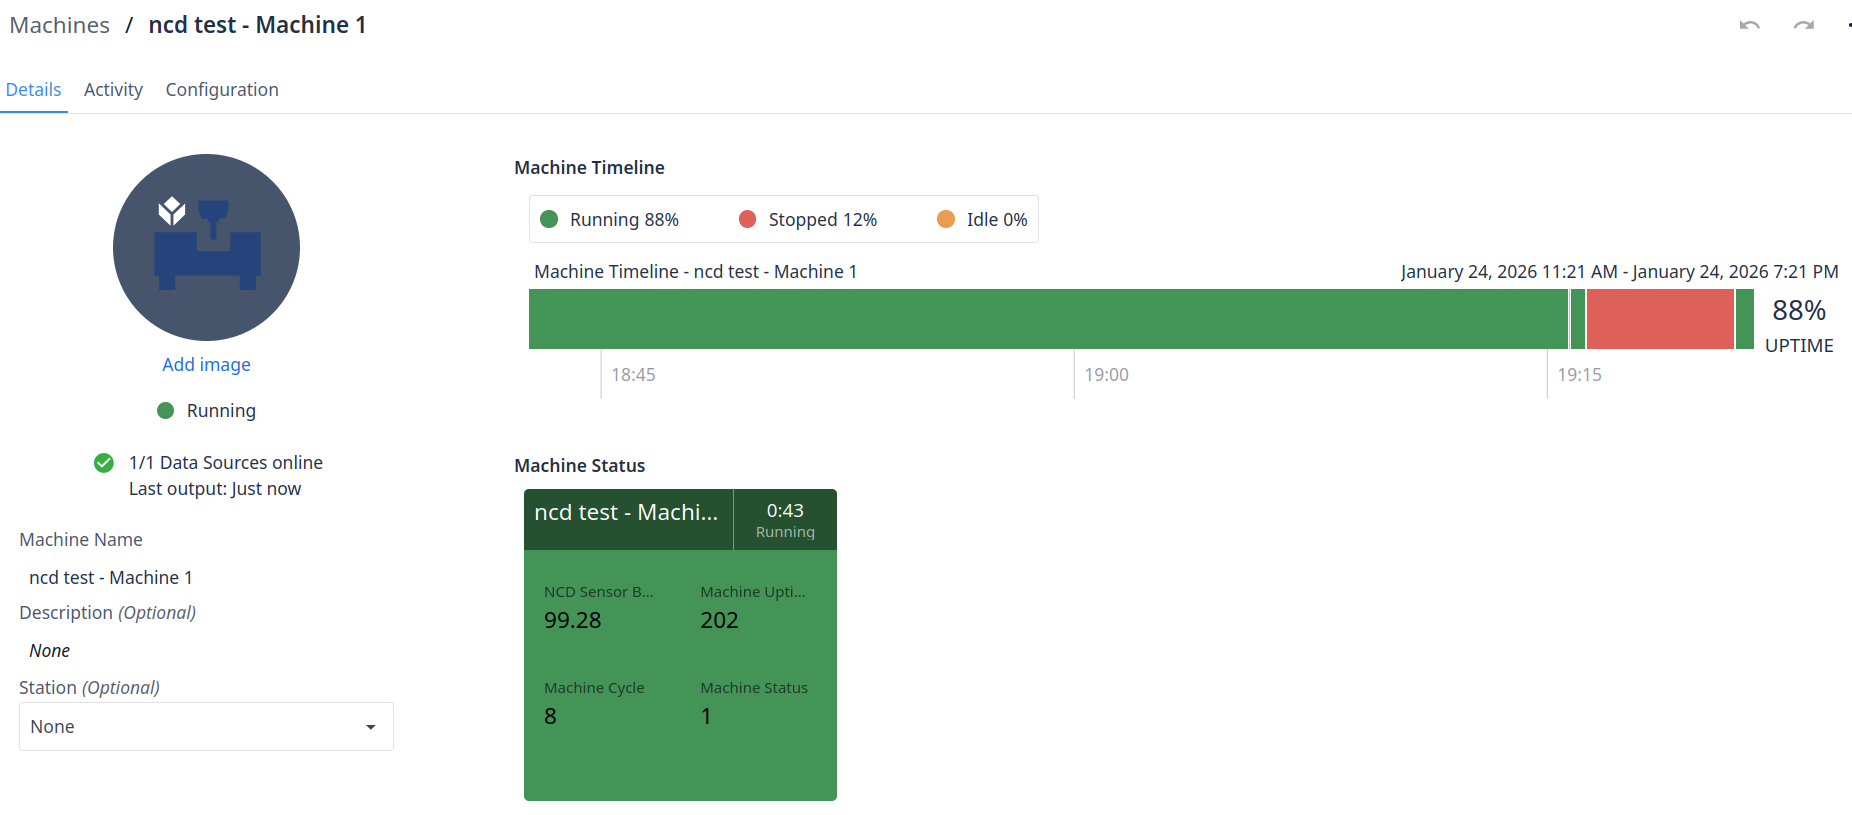
You can now view all machine details, including the current Machine State. In this configuration, the state is determined by the status reported by the Machine Uptime Monitoring Sensor. To verify the setup, you can test the behavior by powering your machine on and off to observe the state changes in real-time. This represents a foundational machine trigger; however, you can explore the full range of Tulip’s capabilities more deeply by referencing the official documentation.
Next Steps
Once your machine status, machine uptime and cycle data are integrated into Tulip, you can visualize real-time status, calculate key metrics like OEE, create custom dashboards, automate downtime tracking, and build operator apps for job management. You can also trigger alerts for faster responses—all through Tulip’s no-code interface for machine monitoring and analytics.
Analytics: Build custom analytics to evaluate trends, identify bottlenecks, and track performance metrics.
OEE Calculation: Automatically track uptime, downtime, and cycles to calculate Overall Equipment Effectiveness (OEE) components.
Additionally, you can integrate more NCD Sensors.
Connect
Seeking next-generation IIoT OEE solutions and support? Here are some next steps: