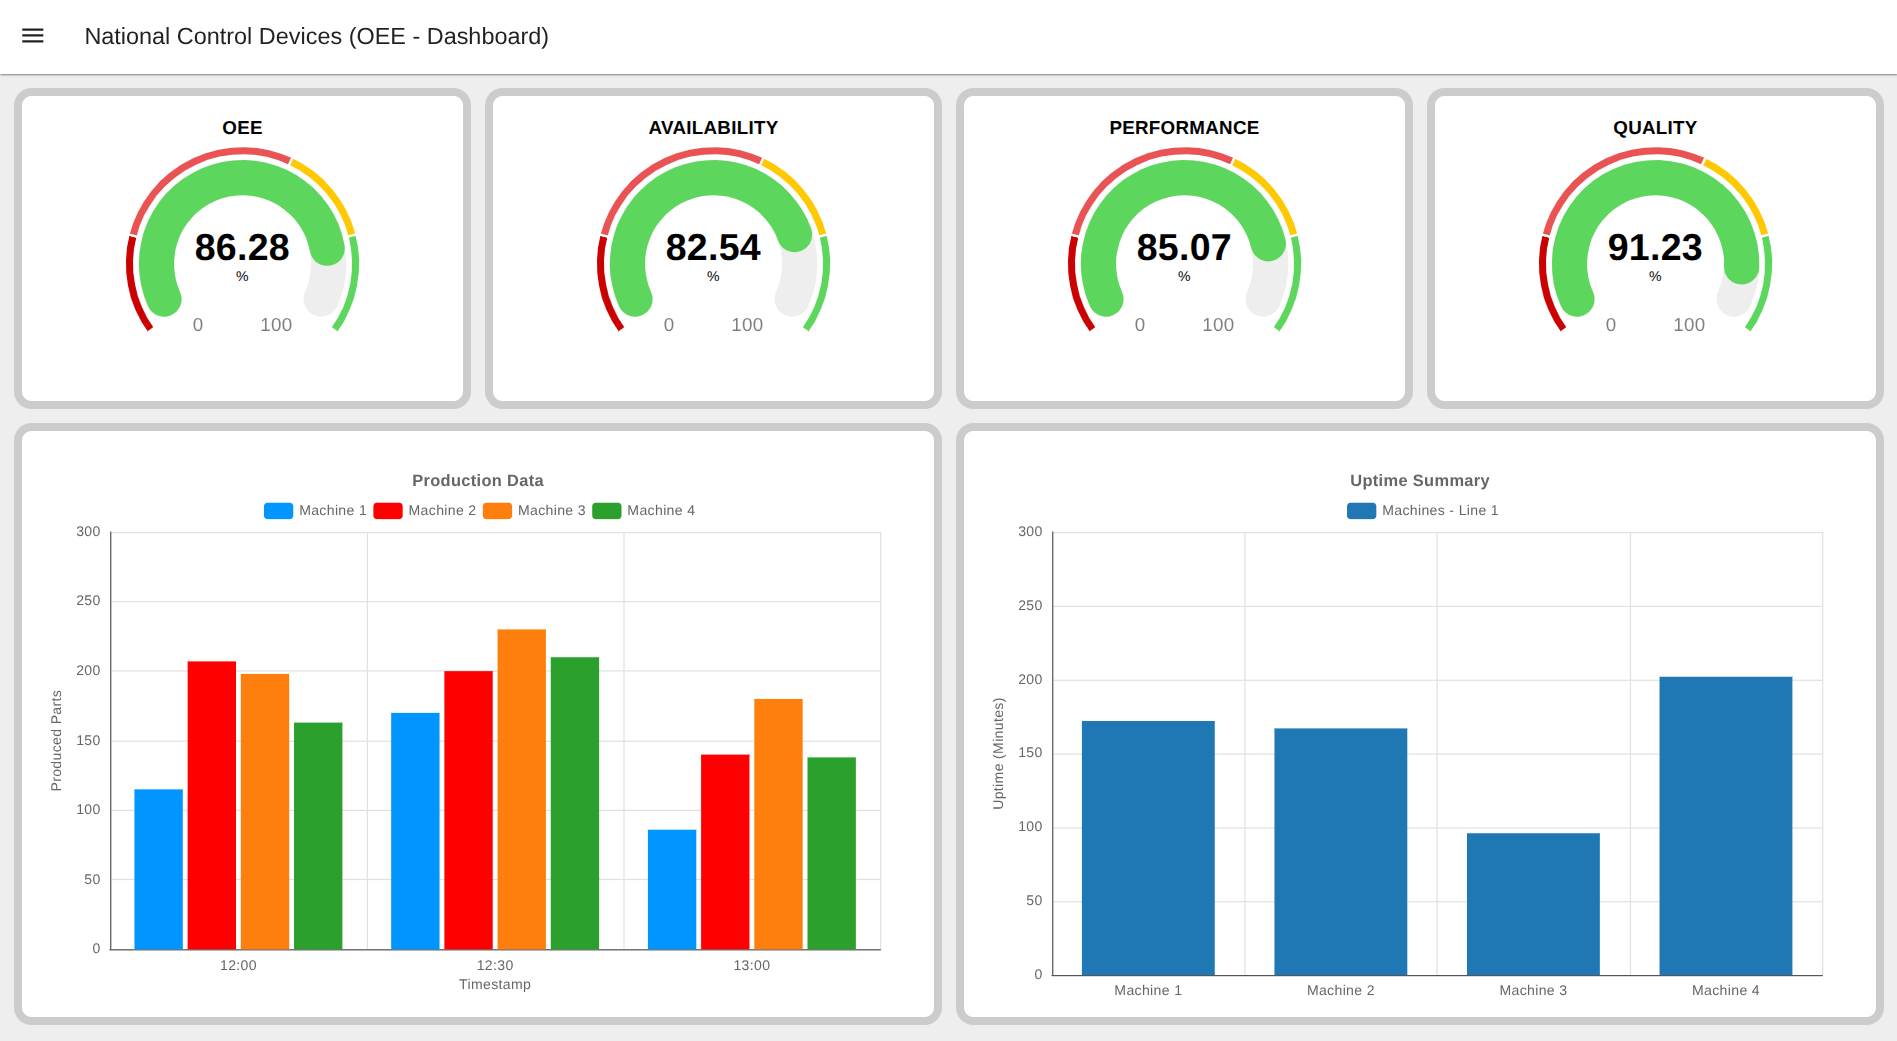
OEE, is a key metric for measuring manufacturing productivity by combining Availability, Performance, and Quality into a single percentage. A high OEE score indicates efficient equipment, while a low score points to losses like downtime, slow speeds, or defects. It helps companies identify inefficiencies, improve performance, and optimize production time.
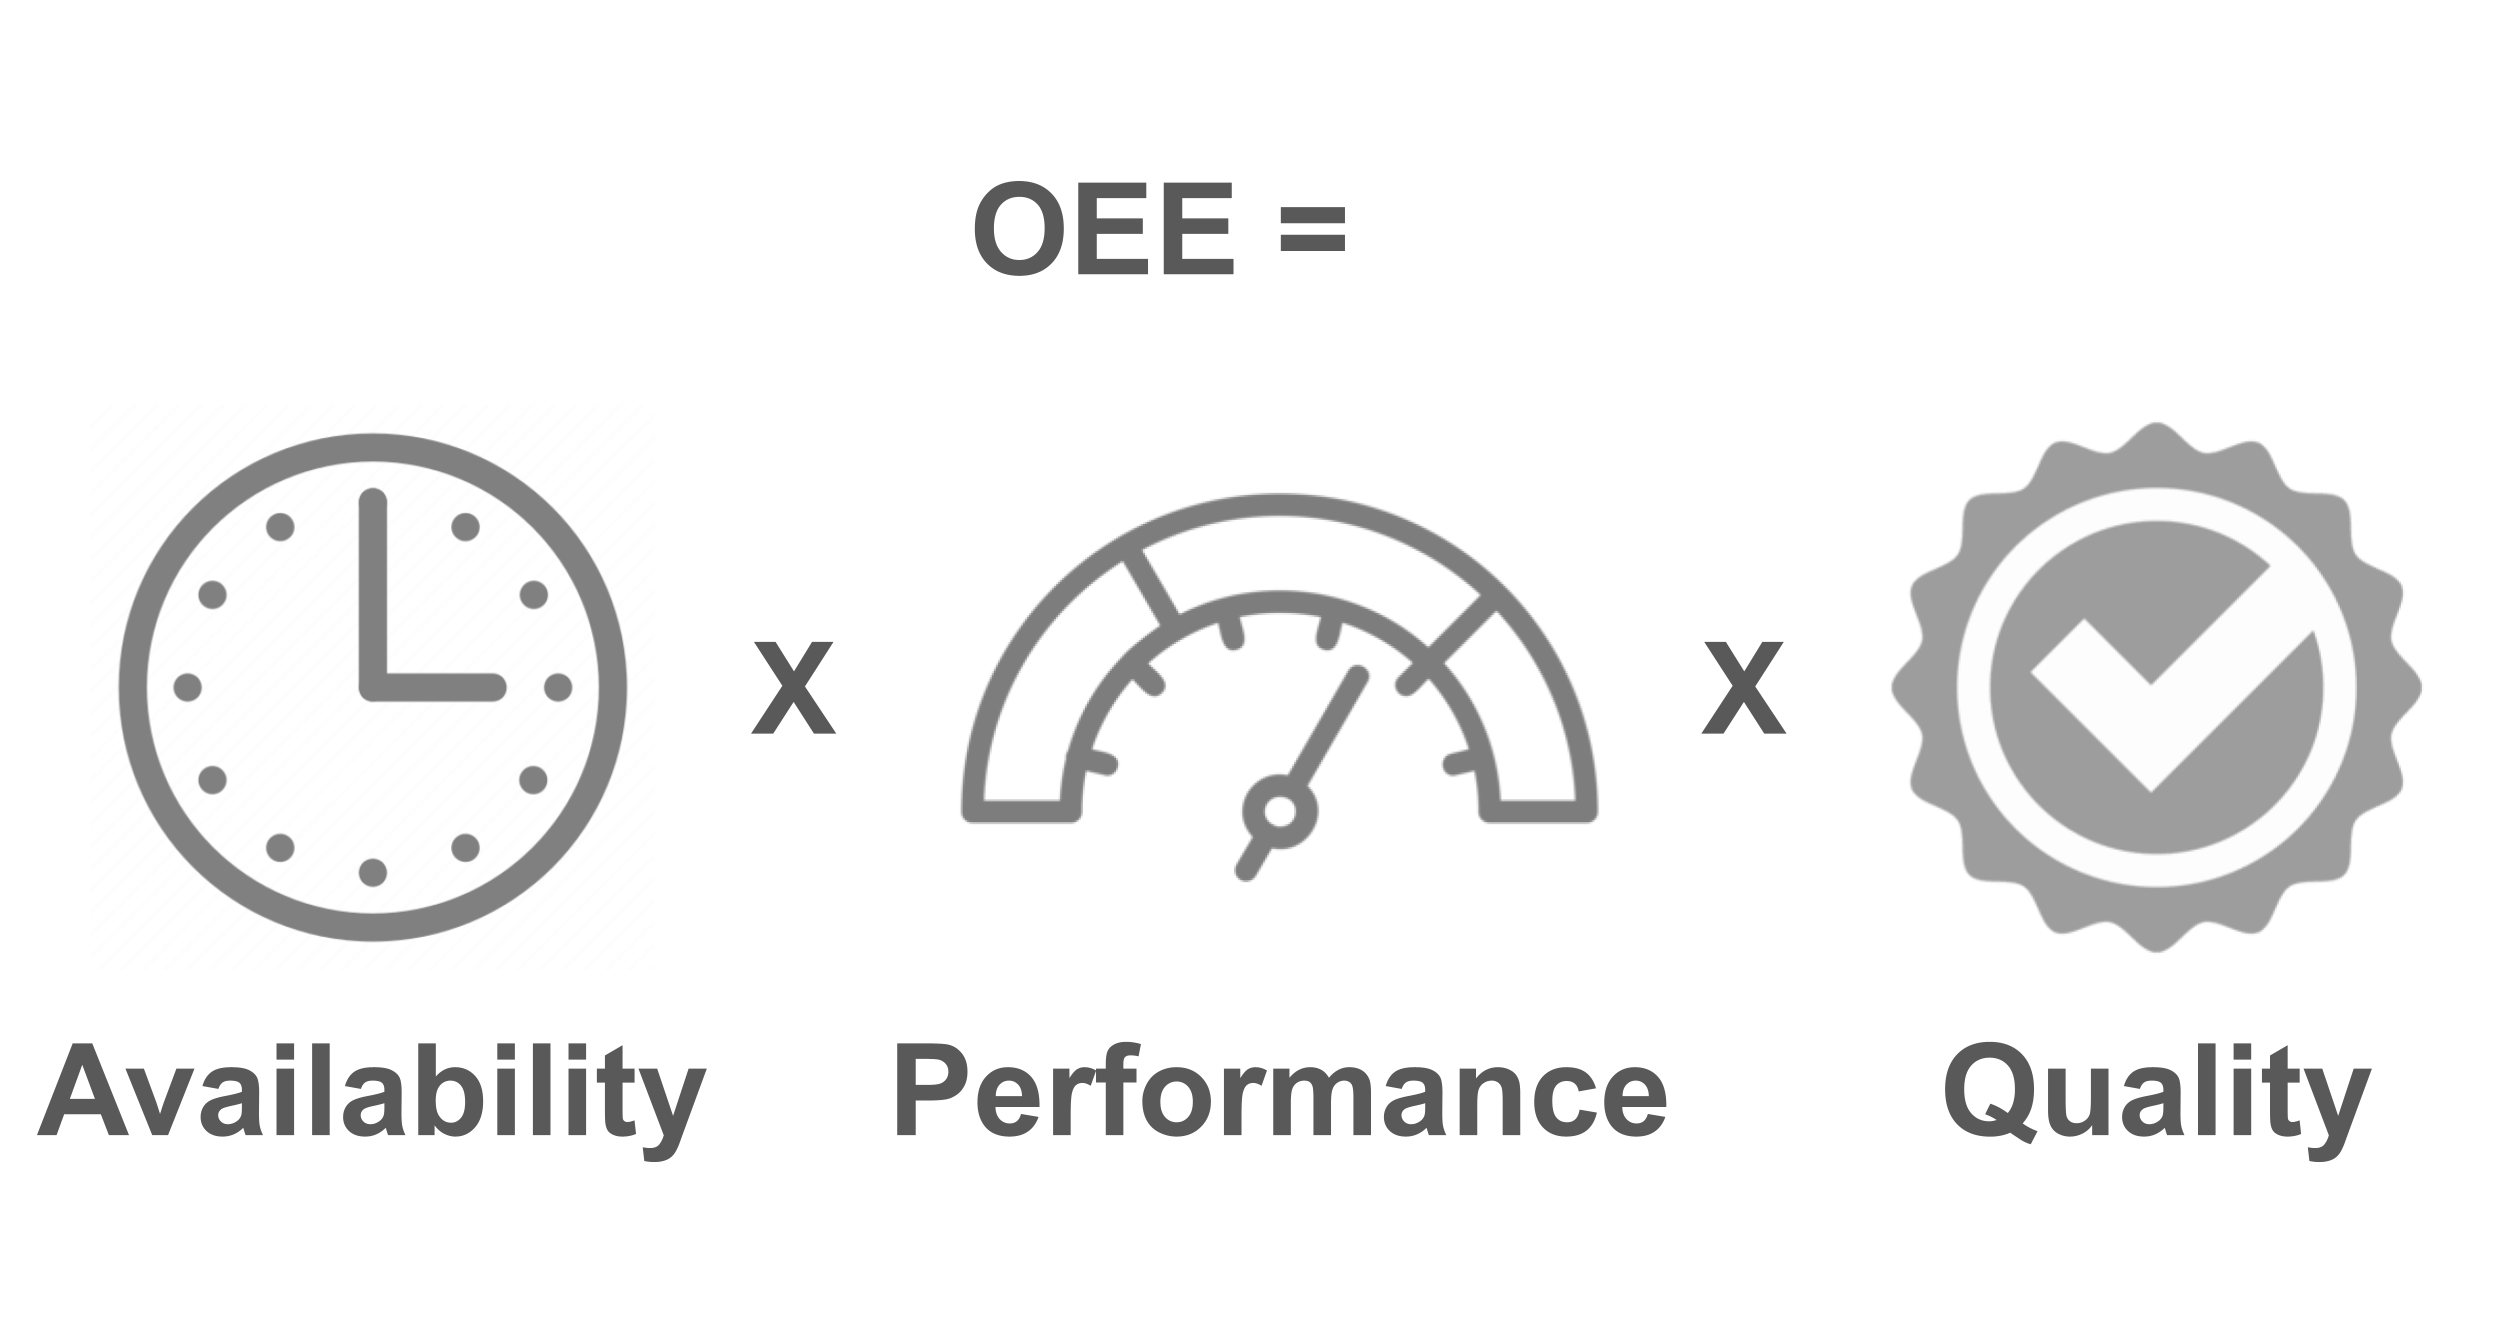
OEE works by multiplying three factors: Availability, Performance and Quality:
It is a metric that identifies the percentage of planned production time that is truly productive.
The Three Factors of OEE
Availability: This measures the time the equipment is actually running compared to the time it was scheduled to run, accounting for losses like unplanned downtime.
Performance: This compares the actual operating speed to the maximum possible speed, identifying issues like slow cycles or minor stops.
Quality: This measures the proportion of good parts produced versus the total parts produced, indicating the rate of defects and rework.
How to measure OEE factors
To calculate OEE, you must first capture the data for its three core components: Availability, Performance, and Quality. The challenge (and opportunity) lies in finding the right signals from your existing Industrial equipment.
Most machines, even older “non-smart” ones, produce a wealth of data through electrical, physical, or mechanical signals. The key is to know what to look for. Let’s break down what data you need to capture for each OEE factor.
1. Measuring Availability
The Goal: To know when your machine is running versus when it is stopped. The Key Metric: Uptime (or its inverse, Downtime). Formula: Availability = Run Time / Planned Production Time
To get “Run Time,” you must differentiate between any planned stops (like scheduled maintenance, breaks, or changeovers) and unplanned stops (like breakdowns or material shortages).
Real-World Signals to Measure Availability (Uptime)
1. Vibration & Motion: This is the most direct method. When a machine (like a motor, press, or CNC) is running, it vibrates. When it stops, the vibration ceases.
Signal Source: A 3-axis accelerometer can detect this operational vibration.
2. Electrical Current: Most machines draw significantly more power when they are running a cycle versus sitting idle.
Signal Source: A current sensor (CT clamp) around the machine’s main power line can detect this “live” operational state.
3. Machine State Relays (Contact Closures): Many machines have a PLC or control panel with outputs that indicate their status.
Signal Source: A “Run” or “Active” light, a PLC output, or a control relay. Tapping into this signal as a dry contact closure provides a simple “ON/OFF” status.
4. Magnetic Field: AC motors and large solenoids generate a distinct magnetic field when energized.
Signal Source: A magnetometer can detect this field, confirming the motor is powered on and active.
2. Measuring Performance
The Goal: To know how fast your machine is running compared to its theoretical maximum speed. The Key Metric: Total parts produced and the time it took to produce them (Cycle Time). Formula: Performance = (Ideal Cycle Time × Total Count) / Run Time
This factor is affected by slow cycles and minor stops. The most crucial data point is the part count.
Real-World Signals to Measure Performance (Part Count & Cycle Time)
1. Proximity or Photo-Eye Sensors: This is the most common way to count products. A sensor detects each time a part passes a specific point.
Signal Source: The output signal (e.g., NPN, PNP, or contact closure) from a photo-electric sensor, proximity sensor, or vision system.
2. PLC Cycle Signals: A machine’s PLC often emits a “cycle complete” signal at the end of its process (e.g., a stamp press completing a stroke, a welder finishing a seam).
Signal Source: An existing relay output or PLC logic point that can be read as a contact closure or voltage pulse.
3. Pulse-Based Counting: For processes involving flow or rotation, you can count pulses.
Signal Source: A flow meter (for liquids/gases) or an encoder (for rotation) that outputs a digital pulse for each unit of measure.
4. Manual Button Press: In semi-automated processes, an operator may press a button every time a cycle is complete.
Signal Source: A simple push-button wired as a contact closure.
By capturing the timestamp of each cycle, you move beyond simple counting and enable Cycle Time Analysis. This allows you to spot “slow cycles,” where the machine is running but not at its ideal speed—a hidden source of performance loss.
3. Measuring Quality
The Goal: To know how many good parts were produced versus defective parts. The Key Metric: Good Part Count (or its inverse, Scrap/Defect Count). Formula: Quality = Good Count / Total Count
This is often the most difficult factor to automate, as it can require human judgment or sophisticated inspection systems.
Real-World Signals to Measure Quality (Good vs. Bad Parts)
1. Automated Inspection Signals: Modern inspection equipment generates a pass/fail signal.
Signal Source: The “reject” signal from a vision inspection system, a check-weigher, or an in-line testing station. This is often a simple contact closure.
2. Physical Rejection/Diversion: When a bad part is detected, it is often physically diverted to a scrap bin or rework line.
Signal Source: A proximity sensor or photo-eye placed on the “scrap” or “rework” chute. A count here is a count of a bad part.
3. Manual Operator Input: The most common method is still manual. An operator inspects a part and logs it as scrap.
Signal Source: A “Scrap” or “Defect” button (contact closure) at the operator’s station that they press to log a bad part.
From Signals to Strategy
As you can see, the raw data needed to calculate OEE is likely already present on your factory floor. It exists as motion, electrical current, contact closures, and sensor pulses.
The challenge is no longer if you can measure it, but how you can easily, wirelessly, and cost-effectively capture these diverse signals and transform them into the three key metrics of OEE.
What is an IoT Sensor?An IoT sensor is a device that can be used to track and monitor the entire production process in detail. By placing an IoT sensor on the machine, you can get a complete, real-time view of its health and performance. This goes far beyond just knowing if it's operational or idle; it allows you to capture the precise machine status (e.g., running, idle, stopped, changeover) at all times.
Using an internal real time clock, the sensor time-stamps every change in status, allowing it to automatically calculate critical metrics like machine uptime and downtime. Furthermore, these sensors can monitor machine cycles and function as a digital production counter to track actual output.
This data-rich environment is key to maintaining production efficiency. When an issue occurs—such as the line stopping for more than five minutes or cycle times slowing down—the system can send instant push notifications to supervisors. By using an IoT sensor to track this complete set of data, you can ensure the production process is running smoothly, identify the root cause of any downtime, and use this information to dramatically improve production efficiency.
The Solution: How NCD Sensors Directly Capture OEE Data
Now that we’ve identified the common field variables and signals—motion, electrical current, contact closures, and sensor pulses—let’s see how you can capture them.
At NCD, we have designed a focused suite of industrial IoT sensors 100% dedicated to OEE applications. These sensors are built to connect directly to your machines and translate those raw signals into the exact metrics you need: machine status (on/off), cycle counts, and parts produced.
1. Solving for Availability (Uptime)
Your goal is to get a simple, reliable “ON” (running) or “OFF” (stopped) signal. Our sensors offer multiple non-invasive ways to achieve this, even on “dumb” machines with no PLC.
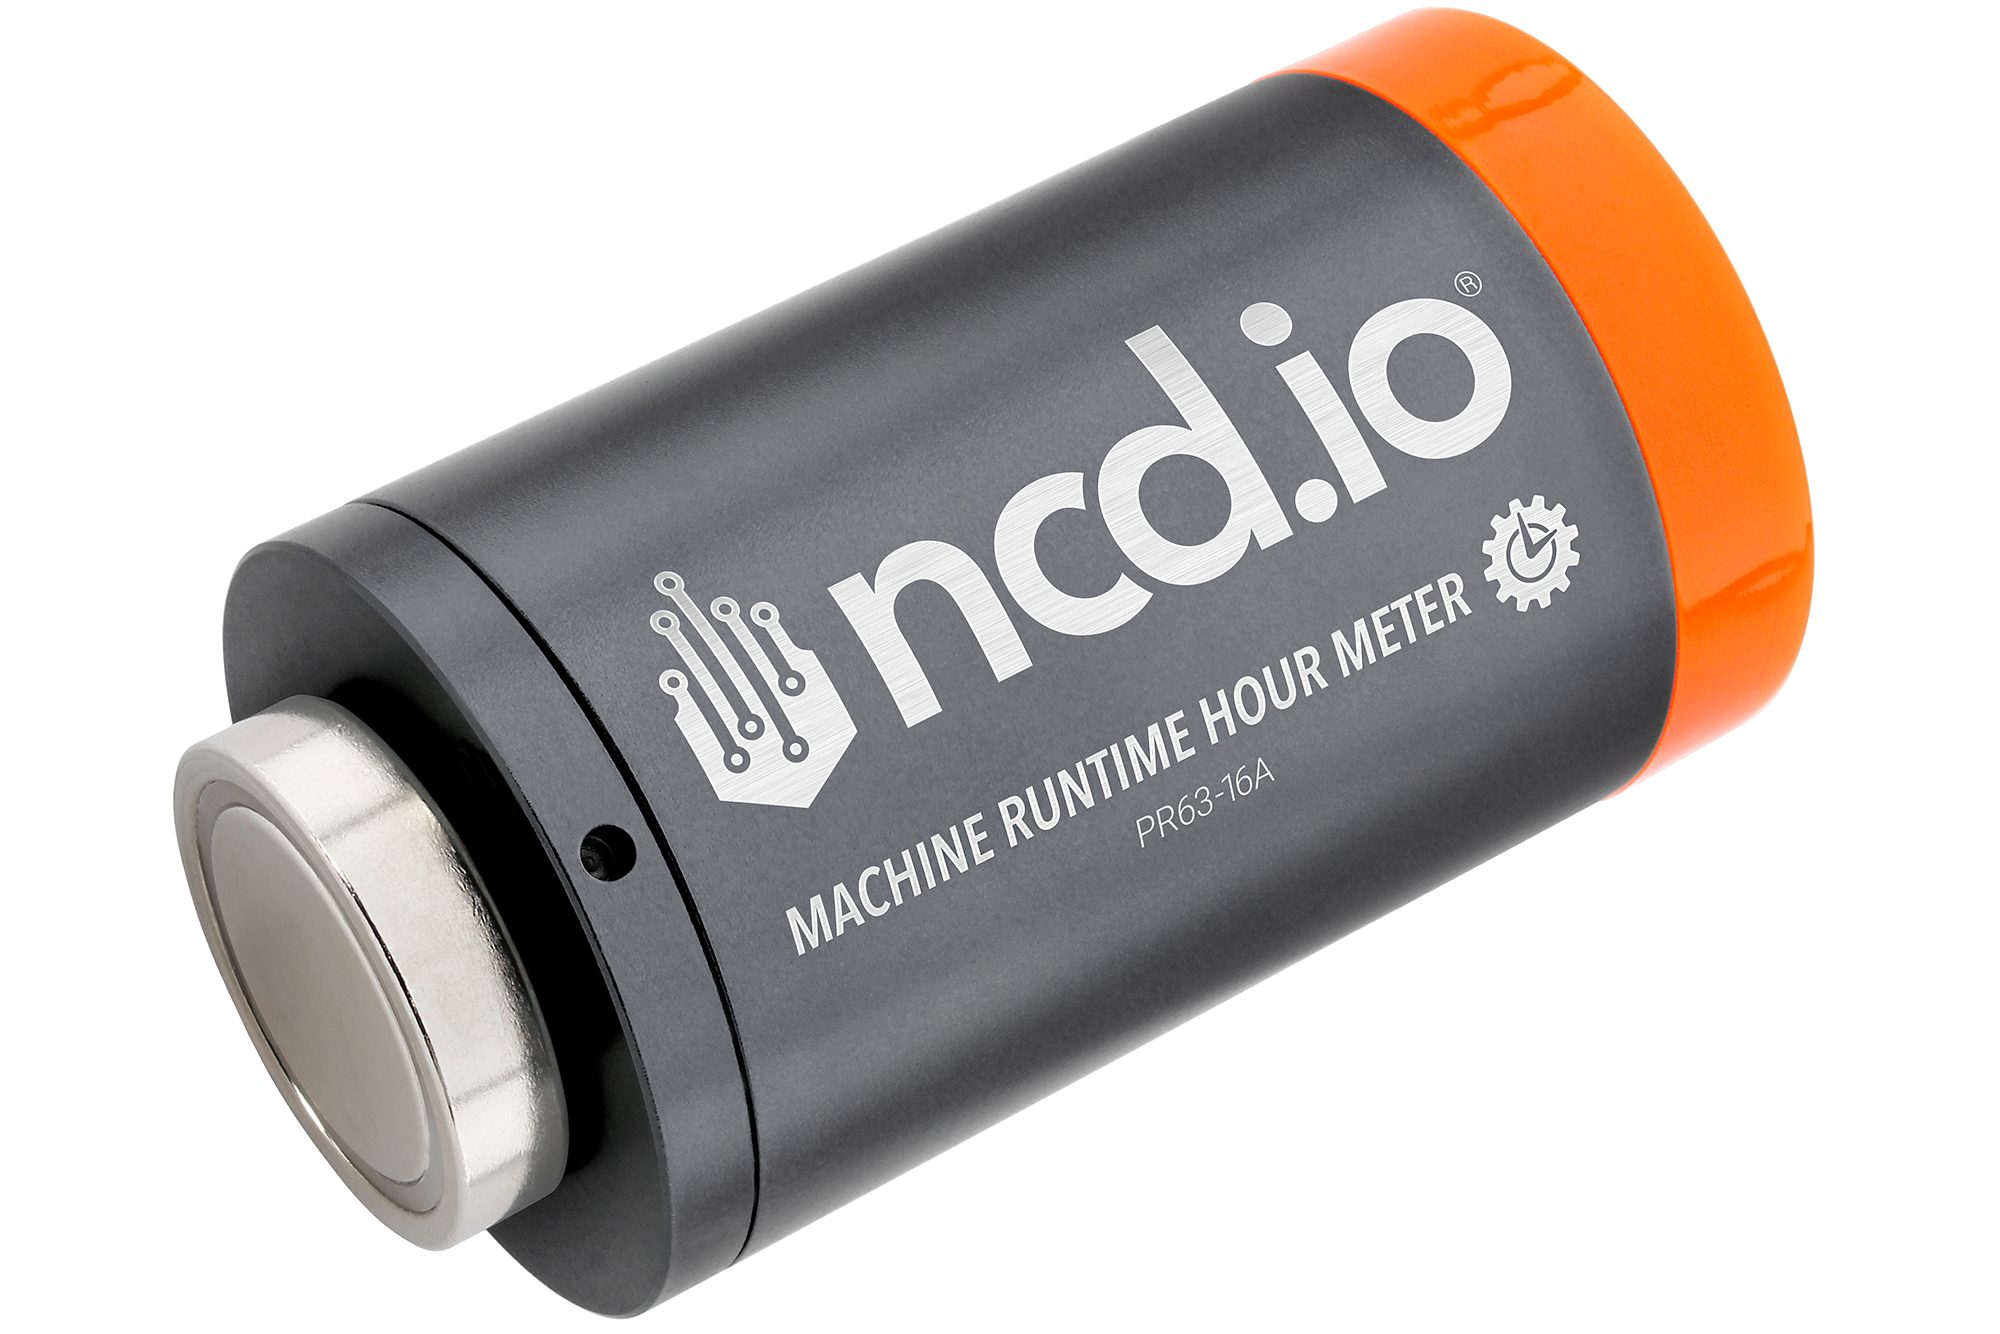
Machine Runtime Hour Meter
For Machines that Vibrate, Move, or have Motors: The Machine Runtime Hour Meter is the perfect “slap-on” solution. Using its internal 3-axis accelerometer and 1-axis magnetometer, it automatically detects the micro-vibrations or the magnetic field from a motor. It runs an internal uptime calculator and reports one simple metric: how long the machine has been running.
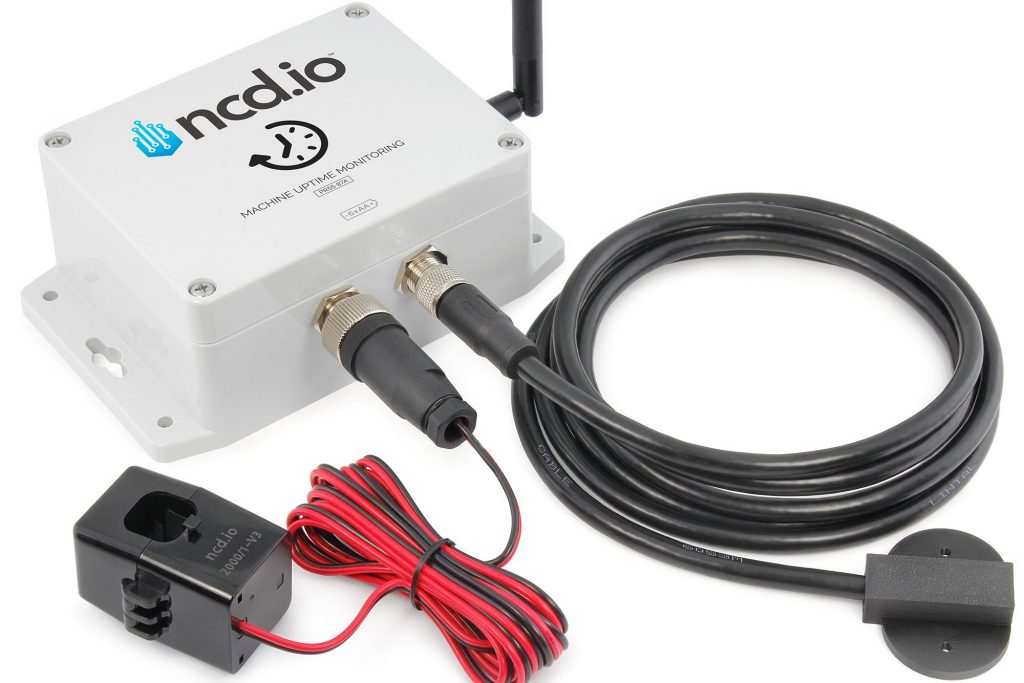
For Machines with a Clear Power Draw: The Machine Uptime Monitoring Sensor can connect to a split-core current transformer. Its Current-based Uptime Calculator knows the machine is “ON” when it draws its operational current and “OFF” when it’s idle.
For Machines with PLC or Control Signals: If your machine has any kind of “run” light, relay, or PLC output, our sensors can read it. The Machine Uptime Monitoring Sensor accepts Dry Contact and Wet Contact inputs, while the 3-Channel Counter uses an Opto-isolated Contact Closure input. This gives you a rock-solid, 100% accurate status direct from the machine’s “brain.”
2. Solving for Performance (Part & Cycle Counting)
To measure performance, you need to count every single part and, ideally, measure the time between them.
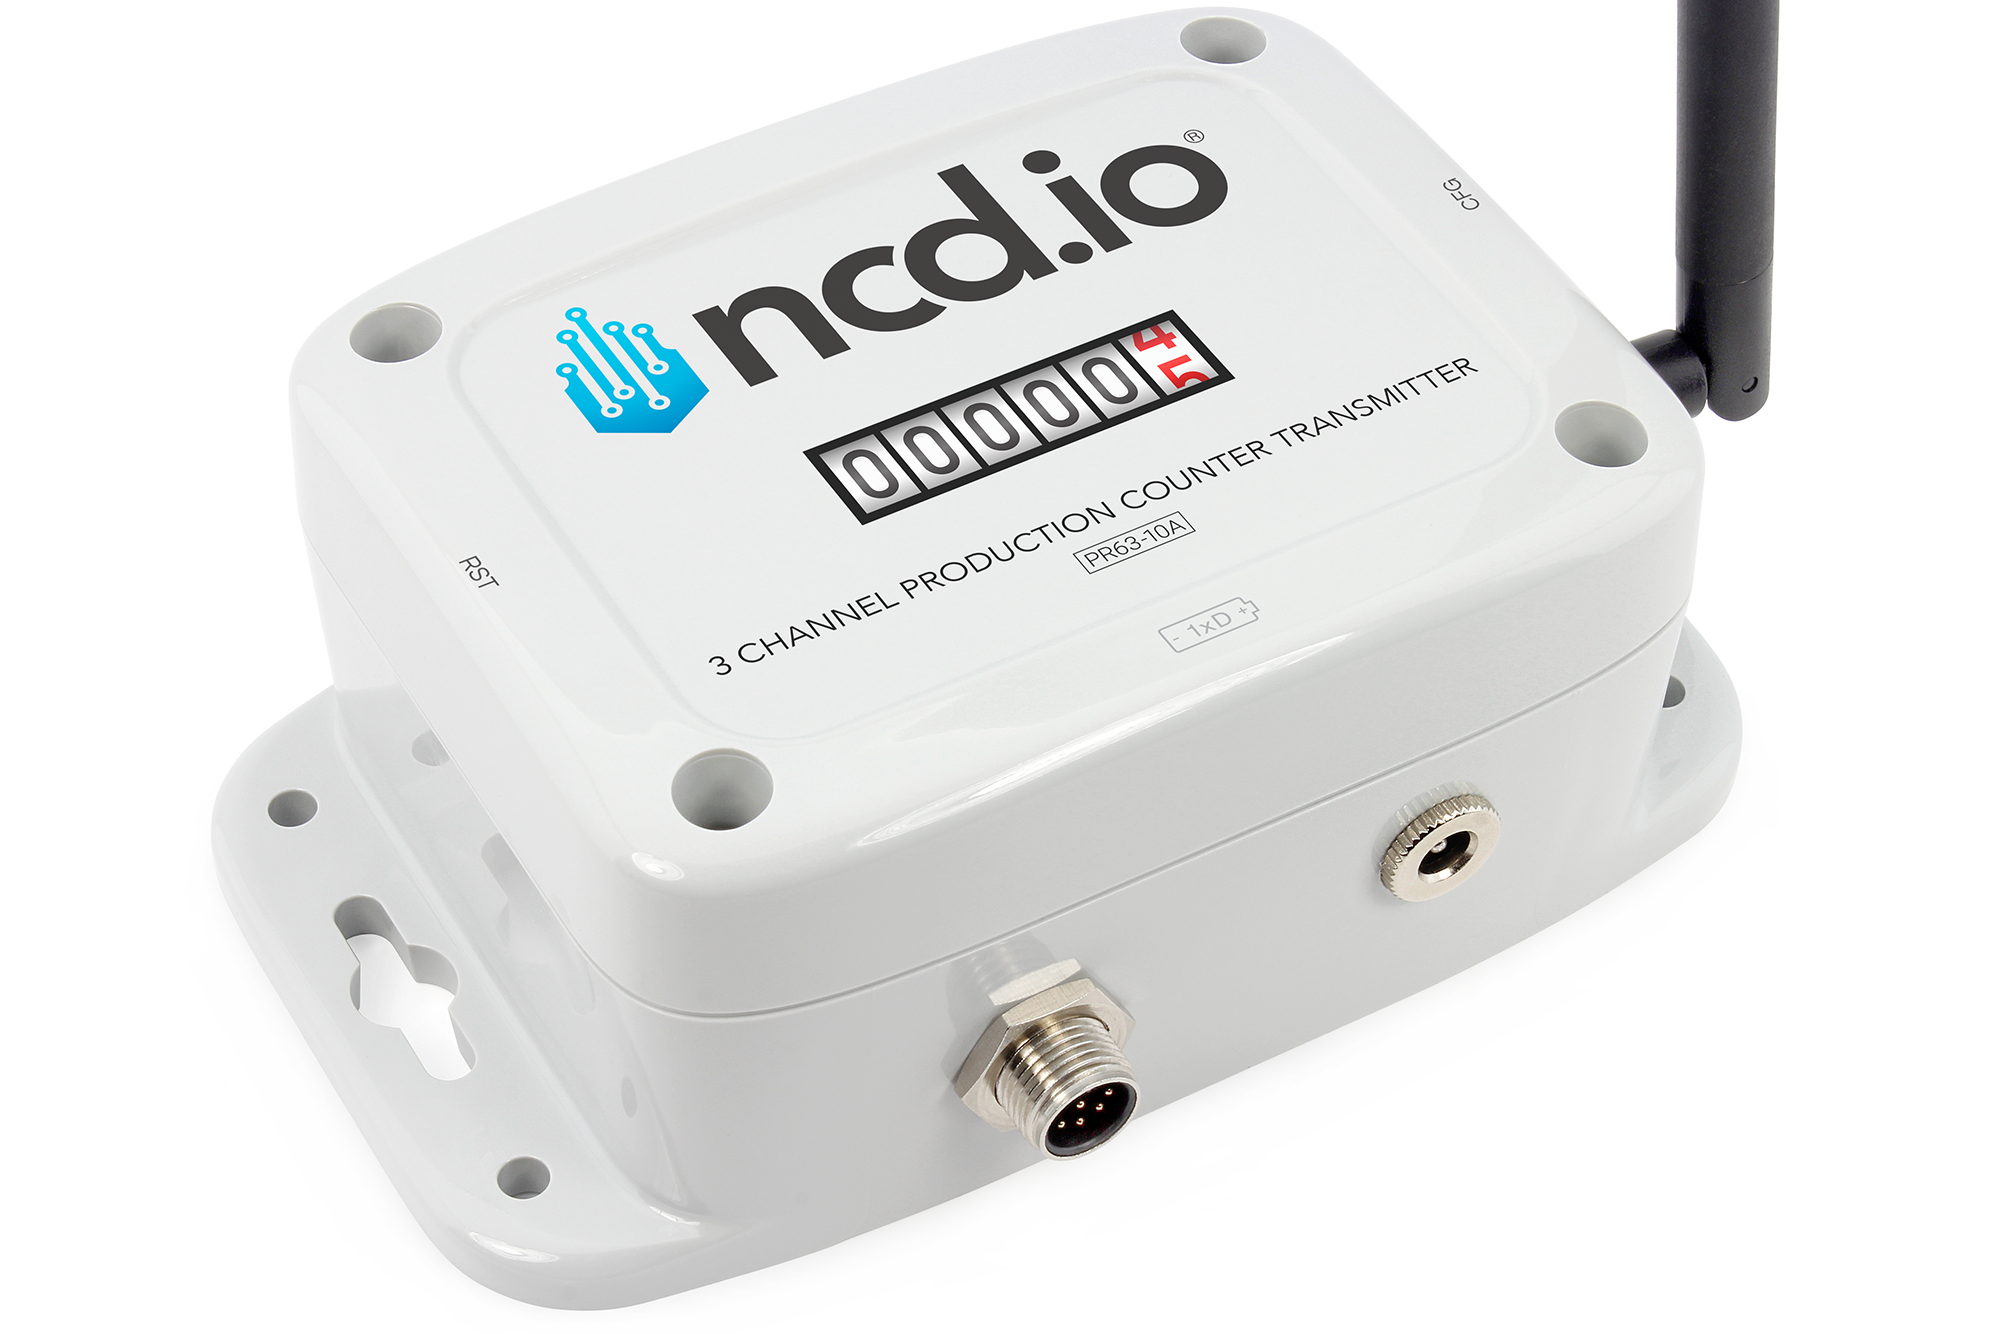
3 Channel Production Counter Transmitter
Connect to Any Existing Sensor: This is the core strength of the 3 Channel Production Counter. It’s designed to connect directly to the “signal” wire of any Photo Eye or Proximity Sensor you already have. It is engineered for industrial use, supporting both NPN and PNP sensor types, so you don’t have to worry about compatibility.
Precision Pulse Counting: This sensor can precisely count digital pulses from machine PLCs or even log pulses from flow meters or encoders.
Cycle Time Analysis: Because the sensor time-stamps every count, you can perform cycle time analysis. This allows you to see not just if the machine is running, but how fast. You can spot hidden performance loss by identifying when cycles take longer than their ideal time.
This is the clever part. You can use a single, multi-channel sensor to measure both Performance and Quality.
Multi-Channel Tracking: The 3 Channel Production Counter can monitor up to three separate inputs. This allows for a powerful setup:
Channel 1: Connect to your main production sensor to count Total Parts Produced.
Channel 2: Connect to a sensor on the “reject” or “scrap” chute, or even a manual button for an operator to press when a part is flagged as defective. This counts Bad Parts.
Connect
Seeking next-generation IIoT solutions for OEE and support? Here are some next steps: