

Filter Monitor User Guide
Air filter health from differential pressure: clogging, remaining life and replacement alerts for HVAC and industrial filters.
1Overview
What Filter Monitor does, who it is for, and the problem it solves.
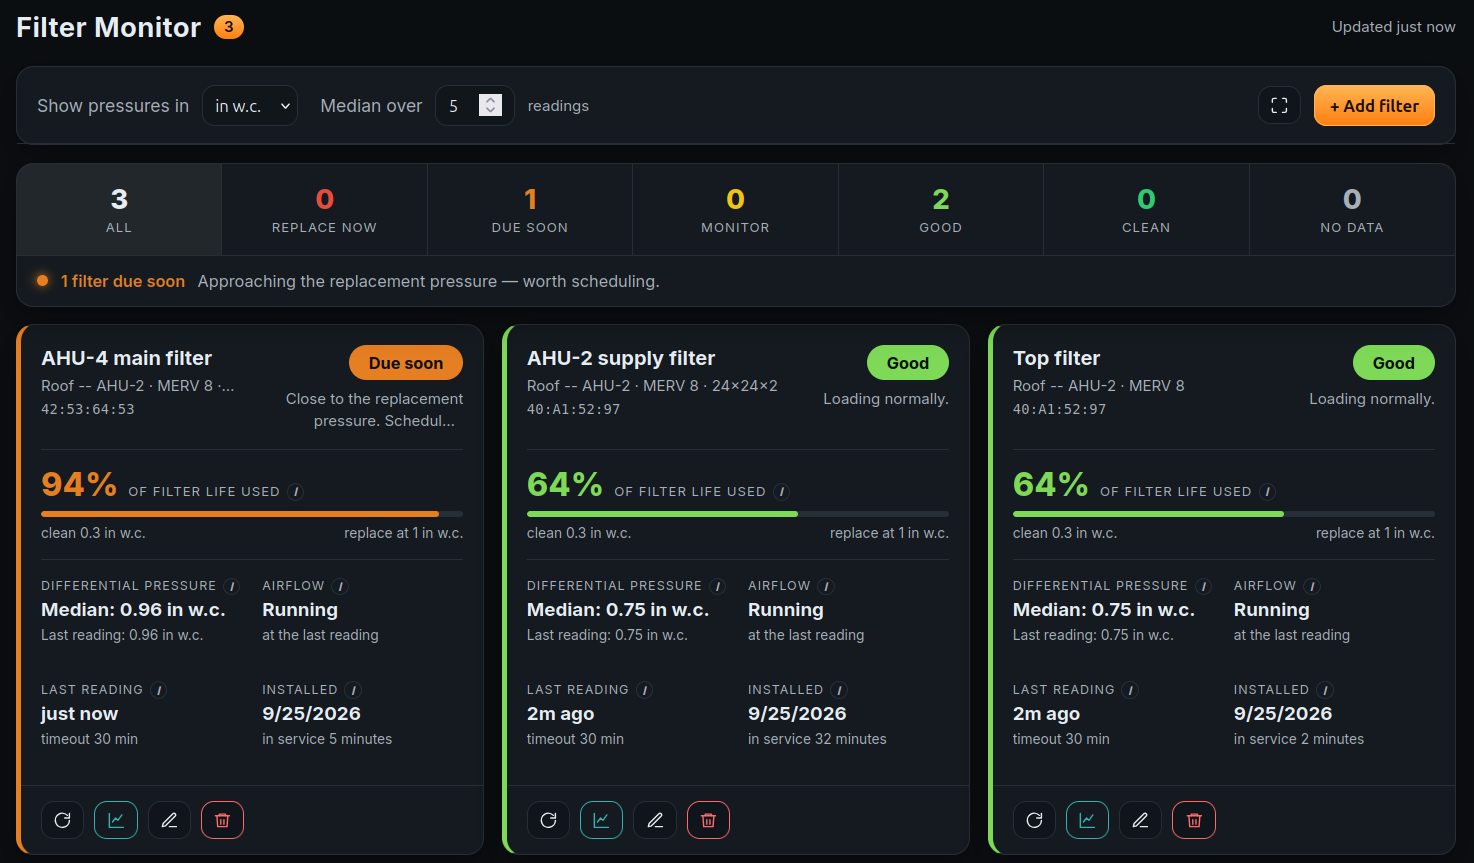
A dirty air filter announces itself as a rising pressure drop across the element. Filter Monitor reads that pressure drop from an NCD differential pressure sensor plumbed either side of the filter, and turns it into the one number a maintenance planner needs: how much of the element’s usable life has been consumed.
The alternative is changing filters on a calendar. That is either wasteful — a clean element goes in the skip because ninety days elapsed — or late, and a loaded filter costs fan energy, starves coils and eventually collapses into the air stream. Neither failure is visible from the corridor. A pressure drop is.
The complication that makes this harder than reading a gauge is airflow. Pressure drop across a filter rises with air velocity as well as with dust, so the same element reads near zero with the fan off and reads high when the unit ramps. A reading taken at the wrong moment looks like a brand-new filter or a blocked one. Filter Monitor handles this explicitly: each filter has an airflow threshold, readings below it are not scored at all, and when the system is idle the app holds the last severity it measured under airflow rather than reporting a falsely clean result.
Each filter is graded from its own clean pressure to its own replacement pressure, on a five-step scale from Clean through to Replace now. The thresholds are the ones you configure per element, not a generic rule.
Readings taken while the fan is off are excluded from the score. Each filter carries its own airflow threshold, and the card says whether air was moving at the moment of the last reading.
A new filter can learn its own clean pressure from its first hours of running airflow, which is more accurate than a datasheet figure that assumes a design airflow the unit may never run at.
One email per filter the first time it reaches its replacement pressure, plus an inter-app bus event and a “mark as replaced” action for the Automations page, and filter health exposed to an assistant over MCP.
2Requirements
What the app needs before it will do anything useful.
| Requirement | Detail |
|---|---|
| Atrium platform | 2.6.0 or newer. The app declares this as its minimum and will not install below it. |
| Gateway model | Any Atrium gateway running a supported platform version, including the EG5100 and EG5120. |
| Sensor | One NCD differential pressure sensor per filter, from the three supported types below, already paired with the gateway and reporting. |
| License | None. The app is free. |
| Browser | A tablet or laptop browser. The layout is a responsive grid and reflows to narrower screens. |
Supported sensors
All three report a differential pressure with its unit attached, which is what allows one app to read them identically. Each has its own firmware floor. A sensor below its floor is still listed when you pick a sensor, with the reason shown, rather than quietly going missing.
| Type | Sensor | Firmware | Pressure chip |
|---|---|---|---|
| 131 | Wireless Differential Pressure Sensor Gen4 | Any | Honeywell ADP |
| 21 | Differential Bidirectional Pressure Sensor | 15 or newer | Sensirion SDP |
| 20 | Precision Pressure & Temperature (pA) | 6 or newer | Pressure/altitude |
Plumbing the sensor
The sensor has two pressure ports. Run one tube to the upstream (dirty) side of the filter and the other to the downstream (clean) side. The sensor is bidirectional, so a reversed pair still produces valid data — it simply reads negative. The setup wizard detects this while you are connecting the tubes and offers to correct it, so there is no need to get it right first time.
3Installing
From the App Center, or from a package file.
-
1
Open the App Center
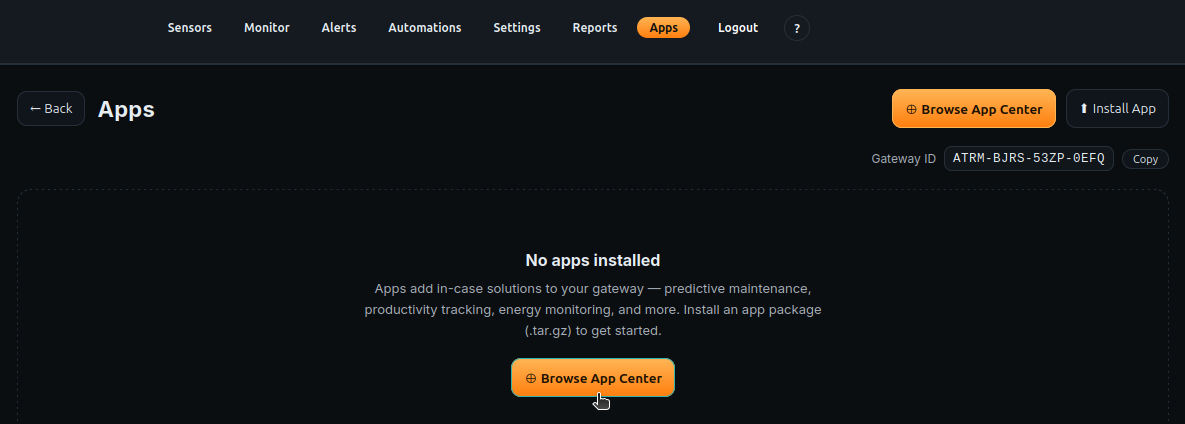
Log in to the gateway dashboard and select Apps in the top navigation. On the Apps page, click Browse App Center. The catalog opens over the page and lists every app published for Atrium gateways; the ones already on this gateway carry an INSTALLED badge with their version.
-
2
Install Filter Monitor
Find Filter Monitor in the App Center and install it. If you were sent a package file instead, use the upload control on the same page.
-
3
Wait for the gateway to reload
Installing an app restarts the gateway’s services. This takes a few seconds and interrupts nothing permanently; the page reconnects on its own.
-
4
Open the app
Filter Monitor now appears as a card on the Apps page. Select it to open.
4First-Time Setup
The shortest path from a fresh install to a graded filter.
-
1
Open the app
Go to the Apps tab and select Filter Monitor.
-
2
Choose the unit you want pressures shown in
The Show pressures in control at the top left offers in w.c., Pa, mbar, kPa and psi. This is a display choice and applies everywhere in the app; it changes nothing about how filters are scored. The default is in w.c.
-
3
Click + Add filter
The setup wizard opens over the page in five steps: Identify, Filter type, Thresholds, Sensor and Review. Each step is described under Adding a filter.
-
4
Complete the wizard and click Create filter
The filter appears in the list immediately, showing No data until enough readings have arrived.
-
5
Wait for the first readings
A filter needs at least three readings taken while air was moving before it can be scored. With a sensor reporting every ten minutes and the fan running, that is about half an hour. If you left Learn the clean pressure automatically ticked, the baseline is measured over the following 24 hours and the card shows Learning its clean baseline from running airflow until it completes.
5The Filter List
The app opens on the filter list. Everything above the cards stays on screen while the list scrolls, so the controls and the counts remain usable however many filters there are.
Controls
| Control | Options | Default | Effect |
|---|---|---|---|
| Show pressures in | Pa, in w.c., mbar, kPa, psi | in w.c. | Display only. Every pressure in the app, including the ones you type into the wizard, is shown and entered in this unit. Scoring is unaffected — pressures are held internally in Pascals. |
| Median over … readings | 1 to 100 | 5 | How many of the most recent readings taken under airflow the scored pressure is the median of. Lower responds faster to a real change; higher resists noise more strongly. Takes effect when the field loses focus or you press Enter, and re-scores every filter. |
| Full screen | Toggle | Off | Widens the dashboard to use the whole frame. Where the browser permits it the page also goes genuinely full screen; where it does not — which includes the gateway’s own sandboxed frame — the widened layout still applies. |
| + Add filter | — | — | Opens the five-step setup wizard. |
Severity counts
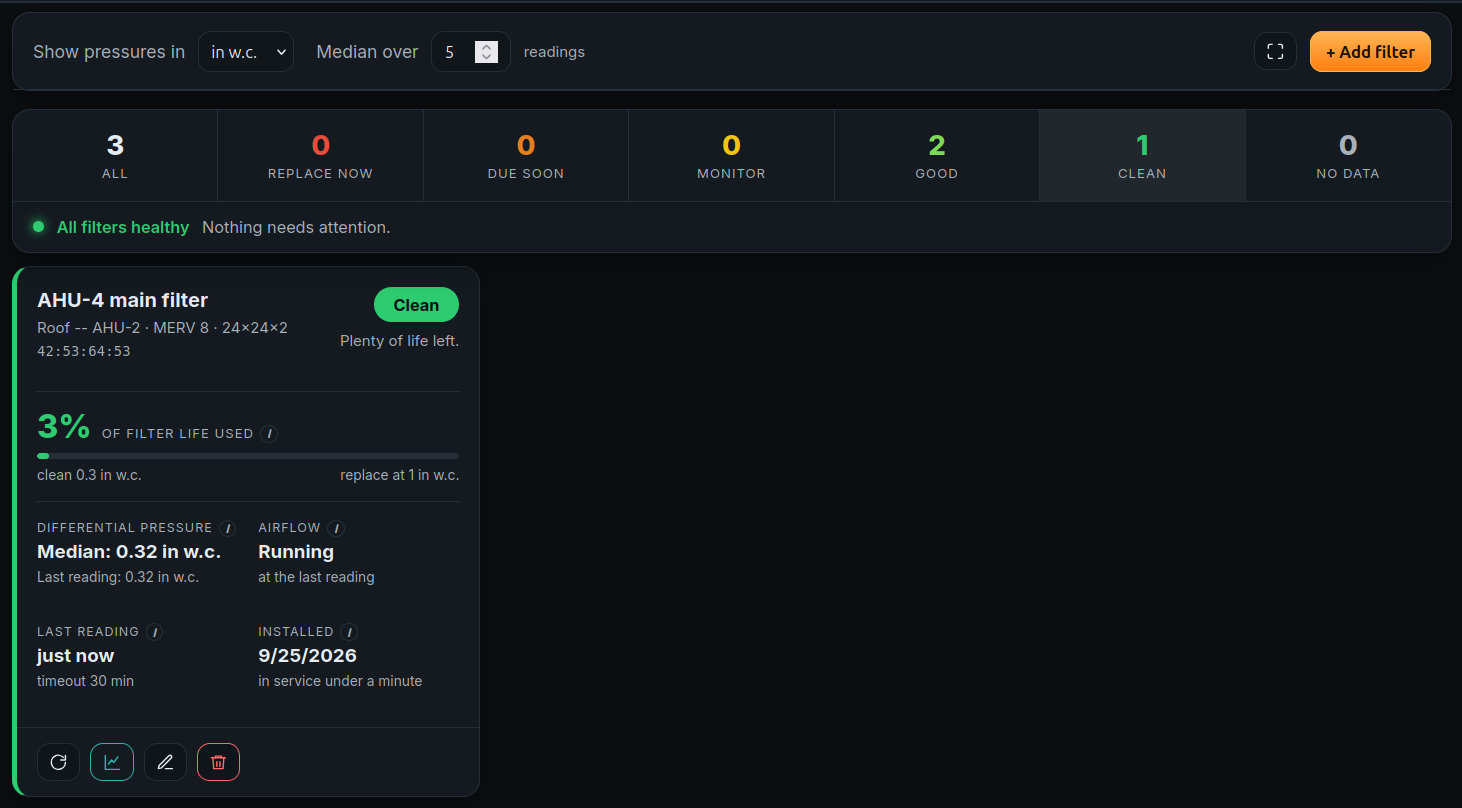
Below the controls is a row of counts, one per severity, with All at the front. Selecting a count filters the list to that severity; selecting All returns to the full list. Above them is a one-line verdict for the whole site — for example All filters healthy, 2 filters need replacing or A sensor has stopped reporting.
A sensor that has stopped reporting ranks below filters that actually need replacing but above everything else. The app will not claim “All filters healthy” while it has lost contact with a sensor, because that would be claiming knowledge it no longer has.
| Severity | Used life | Meaning |
|---|---|---|
| Clean | Below 50% | Plenty of life left. |
| Good | 50% to 75% | Loading normally. |
| Monitor | 75% to 90% | Past three quarters of its life — start planning a change. |
| Due soon | 90% to 100% | Close to the replacement pressure. Schedule a change. |
| Replace now | 100% or more | At or past the replacement pressure. Change it now. |
| No data | — | Not enough information to judge this filter yet. |
This five-step scale is Atrium’s own presentation convention, not a published filter standard. The thresholds that define 0% and 100% for each element are the ones you configure; the bands between them are the app’s.
Filters are listed worst first, then by used life, then by name.
The filter card
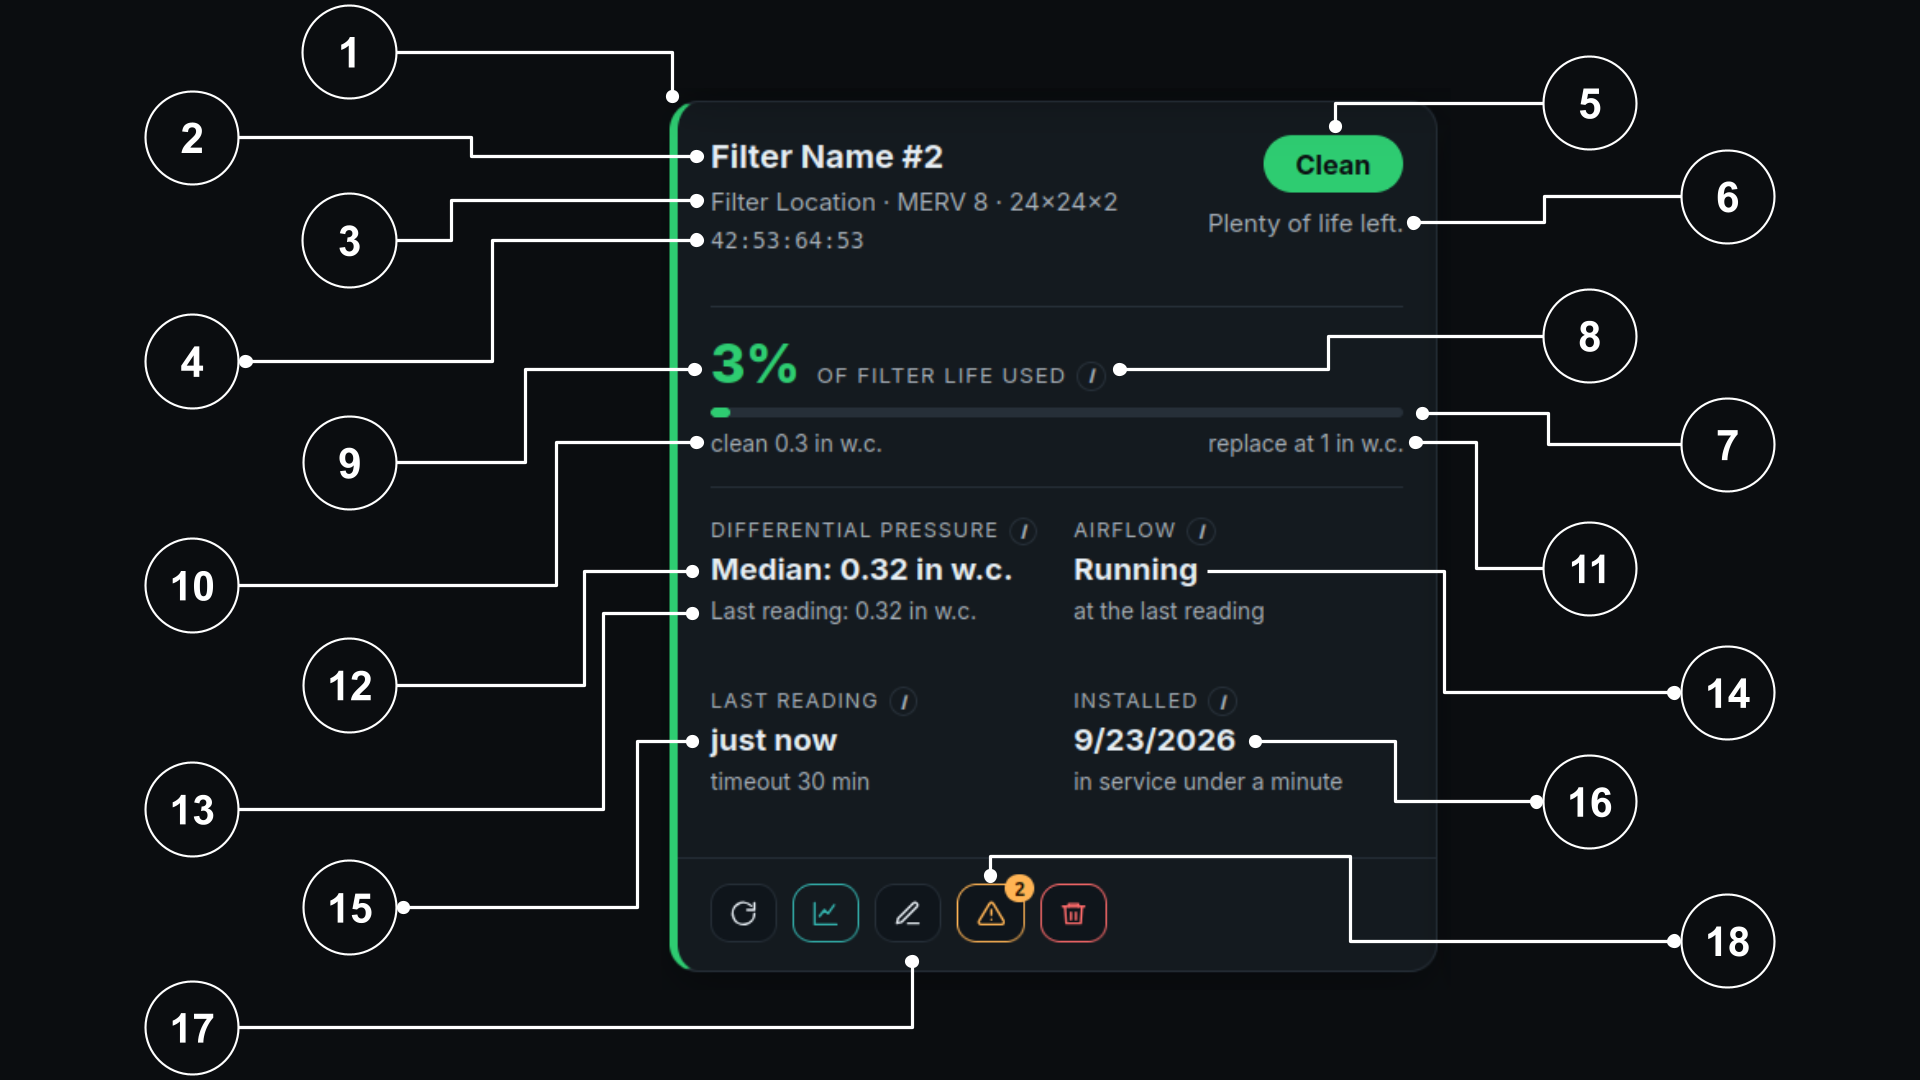
Every card carries the same elements in the same positions whether or not anything is wrong, so a wall of filters can be scanned without the eye having to re-find each figure.
| # | Element | What it tells you |
|---|---|---|
| 1 | Status edge | The severity colour down the left edge, so the card can be read at a glance from across a list. It turns grey when the sensor has gone quiet. |
| 2 | Filter name | The name you gave it in the wizard. |
| 3 | Location, class and size | Location or air handler, the filter class and the nominal size, separated by dots. Shows No location set if none were given. |
| 4 | Sensor address | The last four bytes of the linked sensor’s address, for example 40:A1:52:97. NCD radios share the leading bytes across a site, so only the tail identifies the unit. An em dash means no sensor is linked. |
| 5 | Severity pill | Clean, Good, Monitor, Due soon, Replace now or No data. A filter whose sensor has gone quiet reads, for example, Good · stale. |
| 6 | Status note | One line on why the card reads as it does — the severity blurb normally, or the reason it cannot be scored, or System idle — showing the last reading taken under airflow. |
| 7 | Used life percentage | How far the element has travelled from its clean pressure to its replacement pressure. It can exceed 100% when overdue. |
| 8 | Used life caption | of filter life used, with an information dot explaining what the figure measures and what it is calculated from. |
| 9 | Meter | The same percentage as a bar. The fill stops at the end of the track even when life exceeds 100%. |
| 10 | Clean pressure | The pressure that marks 0% for this element. |
| 11 | Replacement pressure | The pressure that marks 100% for this element. |
| 12 | Median pressure | The middle value of the last few readings taken under airflow. This is the figure the percentage is calculated from. |
| 13 | Last reading value | The sensor’s most recent reading, which moves with every report. Reads not enough readings to score yet before a filter can be graded. |
| 14 | Airflow | Running, Idle or Unknown, as of the most recent reading — not a live sample. |
| 15 | Last reading age | How long ago the sensor last sent data, with the Data Timeout Limit in force beneath it. Turns amber once the timeout is passed. |
| 16 | Installed | When the current element went into service, and how long it has been in. Reset whenever you mark the filter as replaced. |
| 17 | Actions | Mark replaced: Click this after physically changing the element, then confirm. It resets the installed date to now, clears the current verdict and re-arms the alert email so a future replacement can notify again. Readings recorded before that moment are never scored again, which is what stops the old element’s high pressures out-voting the new one’s. The card reads “Waiting for the first reading since this element went into service” until the sensor next reports. View trend: Opens a window over the dashboard carrying the filter’s name and sensor address, the differential pressure charted against the clean and replacement thresholds, markers where the element was replaced, and the filter’s service history. Close it with the close button, a click outside or the Escape key. Edit: Opens the filter’s settings: name, location, asset tag, size, the three pressure thresholds, the linked sensor, polarity, the alert address and the Data Timeout Limit. Changing a threshold re-scores the filter immediately. This window also exposes the installed date with a “Start fresh now” button, which is how to discard test or commissioning data. Remove: Removes the filter, its thresholds and its service history from the app, after a confirmation. It does not affect the sensor, which stays paired with the gateway and available to link to another filter, and it does not delete any readings — those belong to the gateway and are kept under its own retention settings. |
| 18 | Notice button | An amber warning icon, present only when this filter has something to report. Opens a window with the full text. A number appears on it when there is more than one. |
How used life is calculated
Used life is the fraction of the way from the clean pressure to the replacement pressure:
used life % = (median pressure − clean pressure) ÷ (replacement pressure − clean pressure) × 100The median pressure is taken from readings within the evaluation window (6 hours by default) that were taken while air was moving and that were recorded after the current element went into service. Readings from before the element was installed are never scored, which is what stops the old filter’s high pressures out-voting the new one’s after a change. The figure is recalculated whenever the sensor reports.
Airflow states
| State | Meaning |
|---|---|
| Running | The most recent reading was above this filter’s airflow threshold. |
| Idle | The most recent reading was below the threshold. Nothing is scored; the card holds the last severity measured under airflow. |
| Unknown | No sensor is linked, or no readings have arrived at all. |
Why a filter may show No data
The status note gives the specific reason: no sensor linked, learning its clean baseline, no airflow detected, no readings from the sensor yet, waiting for the first reading since this element went into service, or not enough running readings yet.
6Adding a Filter
+ Add filter opens a five-step wizard over the page. You can move back with ← Back at any point, and abandon the whole thing with Cancel, the close button, a click outside the window or the Escape key. Nothing is written until you click Create filter on the last step.
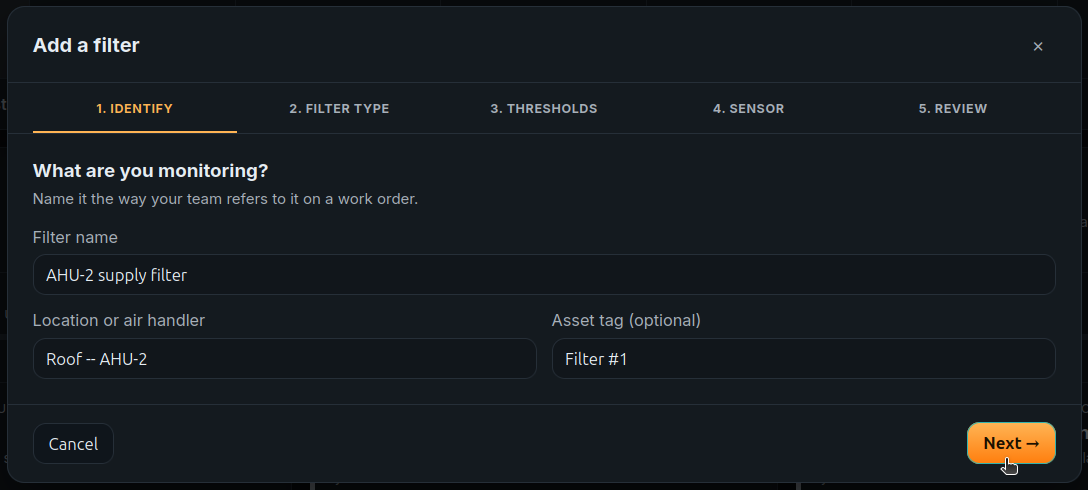
Step 1 — Identify
| Field | Required | Effect |
|---|---|---|
| Filter name | Yes | The heading on the card and the name used in alert emails, bus events
and automations. Example: AHU-2 supply filter. |
| Location or air handler | No | Shown under the name, so a technician knows where to go. Example:
Roof — AHU-2. |
| Asset tag | No | Your own asset or CMMS reference. Useful where several filters share a name and a location. |
Step 2 — Filter type
This step picks sensible starting pressures, which you can change on the next step. The exact figures are on the element’s datasheet.
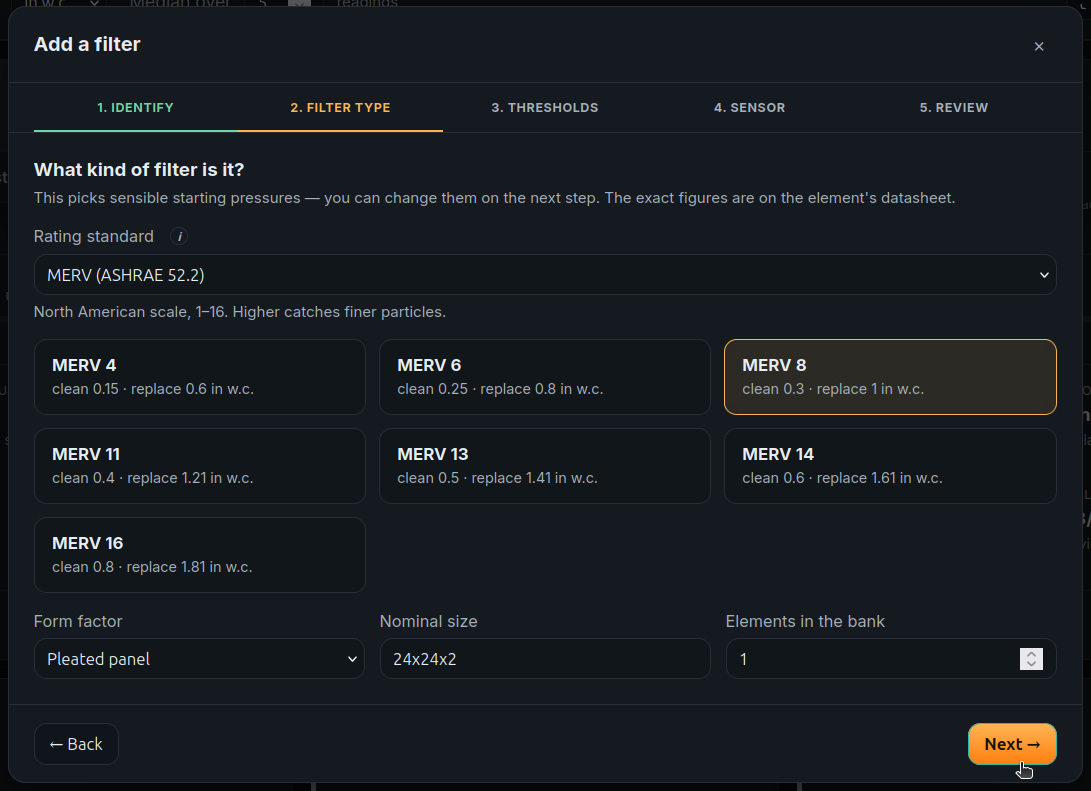
Rating standard
Each option carries an information dot describing what the standard is, how it works and what it is used for.
| Option | Description |
|---|---|
| MERV (ASHRAE 52.2) | The North American standard. Minimum Efficiency Reporting Value, a 1 to 16 scale measuring how well a filter captures particles from 0.3 to 10 micrometres. |
| ISO 16890 | The current global standard for general ventilation filters, which replaced EN 779 in 2018. Groups filters by capture of a given particulate fraction: ePM1, ePM2.5, ePM10 and ISO Coarse. |
| EN 779 | An older European standard, withdrawn and replaced by ISO 16890 in 2018. G1 to G4 for coarse filters, M5 to F9 for medium and fine. You may still see it in older building manuals. |
| HEPA / ULPA (EN 1822) | High-efficiency tiers that neither MERV nor ISO 16890 covers. Tested at the Most Penetrating Particle Size, grouped into EPA (E10–E12), HEPA (H13–H14) and ULPA (U15–U17). |
| Other / unclassified | No preset pressures are offered; you enter the clean and replacement pressures directly on the next step. Use this for bespoke or unlabelled elements. |
Choosing a standard offers a list of classes within it. Selecting a class fills in typical clean and replacement pressures for that class, which the next step lets you override.
Form factor
Recorded for reference; it does not affect scoring. Options are Not specified, Pleated panel, Flat panel, Bag / pocket, Rigid box / mini-pleat, V-bank, Cartridge and HEPA cell. The default is Not specified.
Nominal size and Elements in the bank
Both are recorded for reference and do not affect scoring. Nominal size is
free text, for example 24x24x2. Elements in the bank defaults to
1 and is there so a multi-element bank monitored by one sensor records how many
elements a change order covers.
Step 3 — Thresholds
These are the numbers the percentage is measured between: 0% at the clean pressure, 100% at the replacement pressure. All values are entered in whichever unit is selected in Show pressures in.
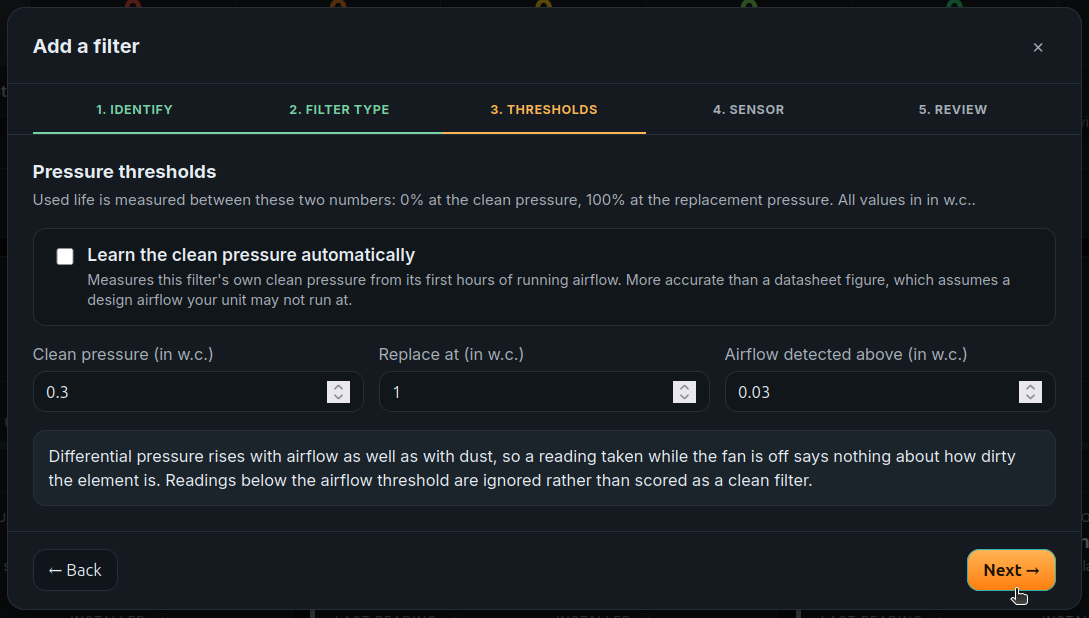
| Field | Default | Effect |
|---|---|---|
| Learn the clean pressure automatically | Ticked | Measures this filter’s own clean pressure from its first hours of running airflow (24 hours by default). More accurate than a datasheet figure, which assumes a design airflow your unit may not run at. While learning, the filter reads No data and its status note says so. Untick this to enter a figure yourself. |
| Clean pressure | From the preset, or learned | The pressure drop across the element when new. This is the zero point for used life. Disabled while the learn option is ticked. |
| Replace at | From the preset | The pressure drop at which the element should be changed. This is the 100% point. The manufacturer usually calls this the final or recommended final resistance. |
| Airflow detected above | From the preset | Readings below this are treated as the system not moving air and are left out of the score. Set it above what the sensor reads with the fan off and below what it reads with the fan running at its lowest normal speed. |
Step 4 — Sensor
Pick the sensor measuring this filter. Sensors are listed by their name on the gateway with their address, so you do not need to work from a MAC address — but the link is stored against the address, so renaming a sensor later does not break it.
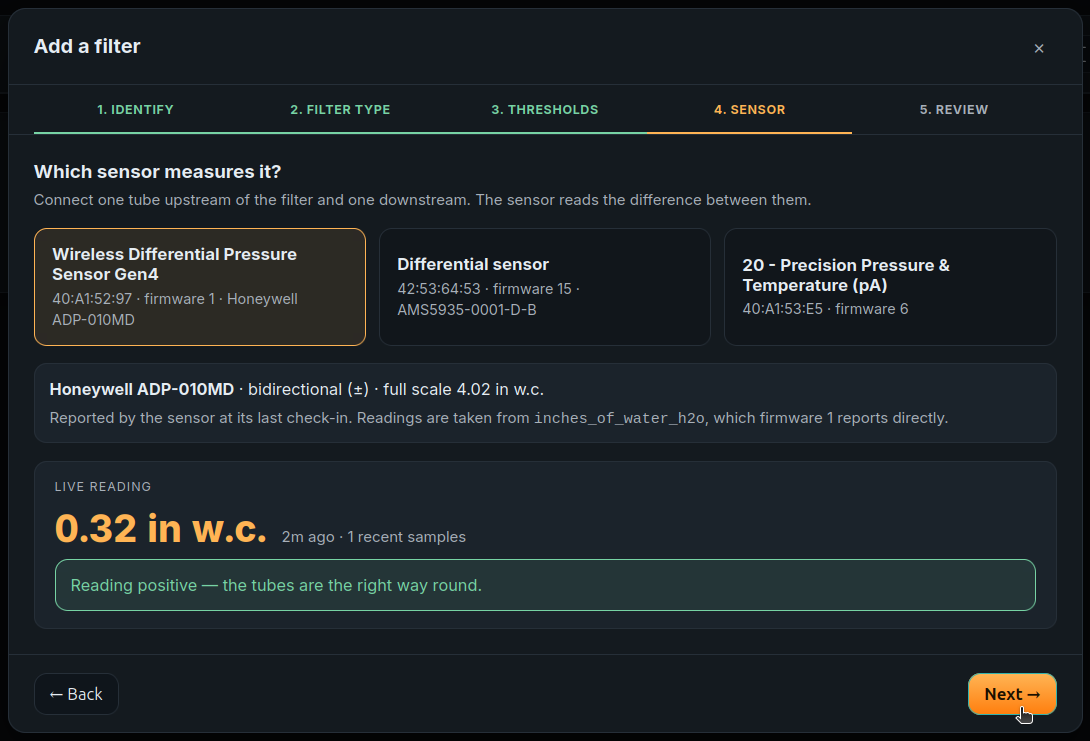
Selecting a sensor shows its pressure chip and measuring range, as the sensor reported at its last check-in, and then begins polling for a Live reading.
The live plumbing check
This is the reason to connect the tubes before finishing the wizard rather than after. The sensor is bidirectional, so tubes on the wrong ports produce a consistently negative reading rather than an obviously broken one.
- Reading positive — the tubes are the right way round. Nothing to do.
- The reading is consistently negative, which means the tubes are on the wrong ports. Either swap them at the sensor, or click Reverse polarity to have the app invert the sign for this filter.
The measuring range warning
The Gen4 (type 131) is the exception: it reports its range on every data frame rather than at a configuration check-in, so the app knows which Honeywell ADP part is fitted as soon as the sensor reports, with no pairing step.
Step 5 — Review
A summary of everything entered, plus two optional fields.
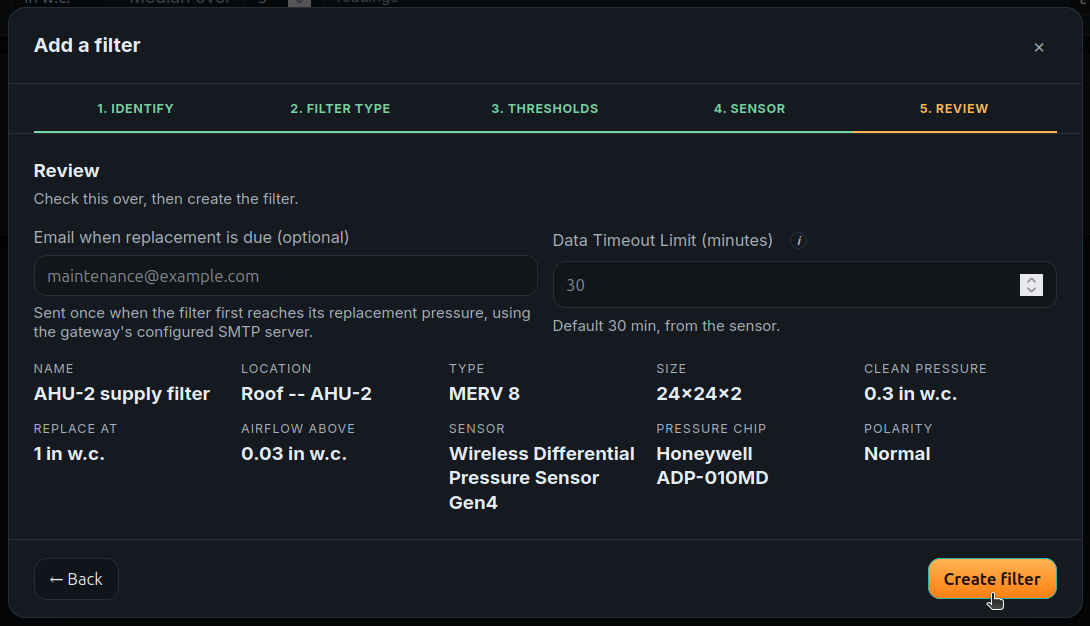
| Field | Default | Effect |
|---|---|---|
| Email when replacement is due | Empty | One message to this address the first time this filter reaches its replacement pressure, sent through the gateway’s configured SMTP server. One message per filter, not one per evaluation. Leave empty for no email. |
| Data Timeout Limit | Empty | In minutes. If no data arrives in this window, the filter is flagged as having stopped reporting. Left empty it follows the sensor’s own reporting interval — three missed reports, with a floor of 15 minutes — so a sensor reporting every 10 minutes is flagged after 30. The placeholder shows the value that would be derived. |
Set the timeout yourself when the reporting interval recorded against the sensor is out of date, or when a longer grace period suits the site.
Create filter saves it. The filter appears in the list immediately; its pressure trend does not open by itself.
7Pressure Trend
The View trend button on a card opens that filter’s pressure history in a window over the dashboard. Close it with the close button, a click outside or the Escape key.
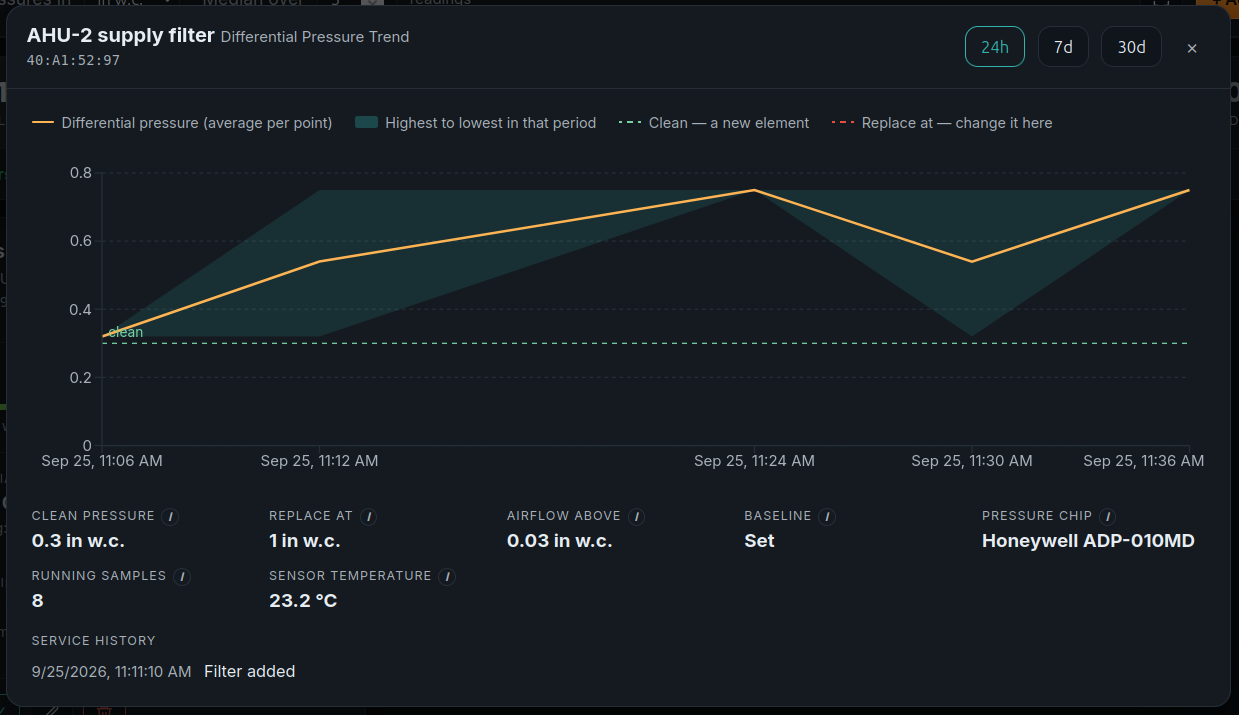
The window is headed by the filter’s name with the sensor’s address beneath it. It opens on the last 24 hours.
The chart
| Element | Meaning |
|---|---|
| Orange line | The differential pressure over time. |
| Shaded band | The spread of readings within each time bucket, between the lowest and highest. A wide band means the pressure was moving about within that period, usually because the fan was cycling. |
| Lower dashed line | The clean pressure — the 0% point. |
| Upper dashed line | The replacement pressure — the 100% point. |
| Vertical markers | Every point in view at which the element was marked replaced, so a step down in the line explains itself. |
Figures below the chart
Each carries an information dot. These are the facts the chart needs explaining, rather than a repeat of the card behind it.
| Figure | Meaning |
|---|---|
| Clean pressure | The pressure drop when the element is new; the zero point for used life. |
| Replace at | The pressure drop at which the element should be changed; the 100% point. |
| Airflow above | Readings below this are treated as the system not moving air and are left out of the score. |
| Baseline | Set if the clean pressure was entered by hand, Learning if it is still being measured from the filter’s first hours of running airflow. |
| Pressure chip | The pressure chip fitted inside the sensor and its measuring range, as the sensor reported at its last check-in. |
| Running samples | How many readings in the evaluation window were taken while air was moving. Only these are scored, and a verdict needs at least the configured minimum. |
| Sensor temperature | The temperature the pressure sensor itself reports, shown as context only — it plays no part in the filter calculation. Useful for spotting a sensor mounted somewhere it should not be, or an air stream far from what the filter was specified for. |
Service history
A dated log of what has happened to this filter — when it was created, when the element was replaced, when a baseline was learned. It scrolls after three entries rather than growing the panel.
8Editing, Replacing and Removing
Mark replaced
Click the Mark replaced button on the card after physically changing the element, and confirm. This resets the installed date to now, clears the verdict and restarts the alert so a future replacement can email again.
Readings recorded before that moment are never scored again. This is what stops the old element’s high pressures out-voting the new one’s, and it means the card reads Waiting for the first reading since this element went into service until the sensor next reports, rather than carrying the old verdict.
Facts that belong to the sensor rather than the element — when it last reported, the highest pressure it has ever observed, its measuring range — survive a replacement, because replacing a filter says nothing about the sensor.
Edit
The pencil button opens the filter’s settings without removing and re-adding it. Name, location, asset tag, size, the three pressure thresholds, the linked sensor, polarity, the alert address and the Data Timeout Limit can all be changed. Changing a threshold re-scores the filter immediately.
In service since
The edit window also exposes the installed date, with a Start fresh now button beside it. Nothing recorded before this moment is ever scored.
Remove
The red trash button removes the filter and its history from the app, after a confirmation. It does not affect the sensor, and it does not delete any readings — those belong to the gateway.
Notices
An amber warning icon appears among the actions when a filter has something to report, with a count when there is more than one. Clicking it opens a window carrying the filter’s name, its sensor address and the full text. Warnings live here rather than on the card so that cards keep a uniform height.
| Notice | Meaning |
|---|---|
| Sensor has stopped reporting | No readings have arrived within the Data Timeout Limit. The status shown is whatever it was when the sensor last reported. Check the sensor’s power, battery and radio range. |
| Failed pressure read | The sensor reported that its last pressure read failed, so the value shown may not be trustworthy. |
| Threshold beyond the sensor range | The replacement pressure sits beyond what the sensor says it can measure. See the measuring range warning. |
10Settings
Two settings are on the toolbar: Show pressures in and Median over … readings. Both are described under Controls. The remaining settings below are applied per gateway and shared by every filter.
| Setting | Default | Effect |
|---|---|---|
| Display unit | in w.c. | The unit every pressure is shown and entered in. Display only. |
| Evaluation window | 6 hours | How far back the app looks for readings to score. Readings older than this are ignored even if nothing newer has arrived. |
| Baseline learning period | 24 hours | How long a filter with Learn the clean pressure automatically ticked spends measuring its own clean pressure before it can be scored. |
| Minimum running samples | 3 | How many readings taken under airflow a filter needs before it is graded at all. Below this it reads No data with Not enough running readings yet. |
| Smoothing samples | 5 | The Median over control on the toolbar. |
Changing any of these re-scores every filter immediately.
Credentials and email
The app holds no credentials. Alert email is sent through the gateway’s own configured SMTP server, so the address, server and authentication are managed on the gateway rather than in this app. The only thing stored per filter is the destination address.
Limits
There is no licensed limit on the number of filters. Each filter needs its own sensor; one sensor cannot serve two filters, because the app scores one pressure drop per element.
11Troubleshooting
| Symptom | Cause | Fix |
|---|---|---|
| The filter reads No data and says Not enough running readings yet. | Fewer than the minimum number of readings have arrived that were taken while air was moving. | Wait for more reports. If the unit is definitely running, check the airflow threshold on the Edit window — if it is above what the sensor reads under normal airflow, no reading will ever count. |
| Airflow always reads Idle while the unit is running. | Airflow detected above is set higher than the pressure the sensor actually reads under airflow. | Open the pressure trend, read the pressure while the fan is running, and set the threshold below it on the Edit window. |
| The card says Sensor has stopped reporting. | No reading has arrived within the Data Timeout Limit. | Check the sensor’s power, battery and radio range. If the sensor is reporting on a longer interval than the gateway has recorded against it, set a Data Timeout Limit explicitly on the Edit window. |
| The reading is negative, and the wizard says the tubes are on the wrong ports. | The upstream and downstream tubes are on opposite ports. | Swap the tubes at the sensor, or click Reverse polarity to have the app invert the sign for this filter. |
| Threshold beyond the sensor range appears, but the sensor is reading well beyond the range it claims. | The range is read from configuration the sensor reported at a past check-in, and it can be out of date. | This is a warning, not a block. Once the sensor has actually reported beyond its claimed range, the claim is treated as disproved and the warning stops. |
| The percentage has not moved although the pressure clearly rose. | The score is a median, so it does not shift until more than half the readings in the window have shifted. | Expected behaviour. To respond faster, lower Median over … readings on the toolbar; the trade-off is that a single odd reading carries more weight. |
| A sensor is missing from the list in step 4 of the wizard. | It is not a supported type, or its firmware is below the floor for its type. | Unsupported sensors are listed with the reason rather than hidden. If the firmware is too old, update it; see the requirements table for the floor per type. |
| The filter still reads Replace now after the element was changed. | The change was not recorded in the app, so readings from the old element are still being scored. | Click Mark replaced on the card. If the element was changed some time ago, set the installed date on the Edit window instead, or use Start fresh now. |
| A new filter is graded from commissioning or test data. | Readings taken while the system was being commissioned are within the evaluation window. | Open Edit and use Start fresh now. Nothing recorded before that moment is scored again. |
| No alert email arrived when a filter reached its replacement pressure. | No address is set on the filter, the gateway has no SMTP server configured, or the filter has already sent its one message. | Check the address on the Edit window and the gateway’s SMTP configuration. One message is sent per filter the first time it reaches the threshold; marking the filter replaced re-arms it. |
12Reference
Units
Pressures are held internally in Pascals and converted for display. Changing the display unit never changes a stored value or a verdict.
| Unit | Shown as | Pascals per unit | Decimals shown |
|---|---|---|---|
| Pascal | Pa | 1 | 0 |
| Inches of water column | in w.c. | 248.84 | 2 |
| Millibar | mbar | 100 | 2 |
| Kilopascal | kPa | 1000 | 3 |
| Pounds per square inch | psi | 6894.757 | 3 |
Severity bands
Applied to used life. These bands are Atrium’s presentation convention, not a filter standard.
| Used life | Label | Internal name |
|---|---|---|
| Below 50% | Clean | optimal |
| 50% to below 75% | Good | good |
| 75% to below 90% | Monitor | monitor |
| 90% to below 100% | Due soon | warning |
| 100% or more | Replace now | critical |
| Not scorable | No data | unknown |
Standards referenced
| Standard | Scope | Status |
|---|---|---|
| ASHRAE 52.2 (MERV) | General ventilation filters, North America. MERV 1 to 16. | Current |
| ISO 16890 | General ventilation filters, international. ePM1, ePM2.5, ePM10, ISO Coarse. | Current; replaced EN 779 in 2018 |
| EN 779 | General ventilation filters, Europe. G1–G4, M5–F9. | Withdrawn 2018 |
| EN 1822 | High-efficiency filters. EPA E10–E12, HEPA H13–H14, ULPA U15–U17. | Current |
The preset clean and replacement pressures offered per class are typical figures for that class, provided as a starting point. They are not taken from any one manufacturer, and the element’s own datasheet always takes precedence.
Timings
| Behaviour | Interval |
|---|---|
| Re-evaluation | Whenever the sensor reports, and at least every 5 minutes |
| Dashboard refresh | Every 5 seconds |
| Live reading poll in the wizard | Every 5 seconds |
| Evaluation window | 6 hours |
| Baseline learning | 24 hours |
| Default data timeout | 3 missed reports, with a floor of 15 minutes |
| Pressure trend default range | 24 hours |
Data stored by the app
Filter definitions, thresholds, the linked sensor address, polarity, alert address, timeout override, the current verdict per filter and a service history of element changes and learned baselines. No telemetry. Readings are read from the gateway and are kept under the gateway’s own retention settings.