Dashboard Environmental Temperature Humidity Pressure Air Quality Sensor

Table of Contents

This project is a Subflow developed by ncd.io based on Node-RED and the Dashboard 2.0 module, which allows you to visualize the data provided by the Industrial IoT Long Range Wireless Environmental Temperature Humidity Pressure Air Quality Sensor in an intuitive way.

Subflow Characteristics

It allows an automatic local storage (from one or more connected devices of the same type) of the variables provided by the sensor in real time:

  • Temperature.
  • Pressure.
  • Humidity.
  • Gas resistance.
  • Indoor Air Quality.
  • Battery percentage.
 

Select the unit of measurement for the temperature variable:

  • Celsius.
  • Fahrenheit.
 
Download from web browser of CSV files of each selected device filtered by date.


It automatically detects when a new Industrial IoT Long Range Wireless Environmental Temperature Humidity Pressure Air Quality Sensor is connected, obtains its MAC address and adds it in a dropdown so you can select the device you want to display the value of its variables, this is very useful for cases where you have more than one sensor of this type.

IMPORTANT:

This Subflow currently only works with type sensors (“sensor_type”: 27) which corresponds to Industrial IoT Long Range Wireless Environmental Temperature Humidity Pressure Air Quality Sensor.​

It is possible to view the relevant sensor data (Inspect Button).

Requirements/Dependencies

To import this subflow it is necessary to have previously installed:

  • Node-RED
  • @ncd-io/node-red-enterprise-sensors
  • @flowfuse/node-red-dashboard
IoT Sensor Data dashboard

Install 'ncd-io/node-red-enterprise-sensors'

Step 1

Within your Node-RED instance go to the main menu (top right) and select the “Manage palette” option:

Node Red Manage Palette

Step 2

In the window, select the “Install” tab:

Step 3

In the search field enter “@ncd” you will see the following:

Noder Red install NCD

Step 4

Click the “Install” button to start the installation process, a window will appear at the top of the screen, asking you to confirm the installation:

Node Red confirm installation

Step 5

Once the process is completed you will see the following window:

Node RED installation complete

Installing Dashboard 2.0

FlowFuse’s Node-RED Dashboard 2.0 is available in the Node-RED Palette Manager. To install it:

  1. Open the menu in the top-right of Node-RED
  2. Click “Manage Palette”
  3. Switch to the “Install” tab
  4. Search node-red-dashboard
  5. Install the @flowfuse/node-red-dashboard package (not node-red/node-red-dashboard)

Procedure to import the Sub-flow

IMPORTANT:

1.- If you already have an ncd-dashboard (subflow) installed and configured in your current project, I recommend you review the “Working with two or more ncd-dashboards in the same Node-RED project.” section later in this post.

2.- If you already have a dashboard 2.0 project created in your current workspace, I recommend you review the “Import subflow to an existent dashboard 2.0 project” section later in this post.

Step 1 - Copy raw JSON file from Github repository

Copy the raw JSON file from GitHub repository:

				
					@ncdcommunity/NodeRED-Dashboard-Environmental-Temperature-Humidity-Pressure-Air-Quality-Sensor


copy json file from github

Step 2 - Import nodes

Go to Node-RED, you can add a new flow in the node editor of node-red (optional):

Then, go to the main menu, select the “Import” option:

A field will be opened. Right click and paste the JSON code you just copied from GitHub:

Node RED pasting json code

You will see the JSON code, now you can press the red “Import” button at the bottom right (by default the “current flow” option is selected):

Node RED node import

In the upper part of the node editor, you will see information of the subflow you just imported, and automatically you will have the subflow available inside the node editor, now you can position it inside the editor by left clicking.

You may also notice that the subflow has been added to the ncd.io node group.

Node RED NCD nodes

Step 3 - Configure NCD.io nodes

The next step is to configure your ncd.io nodes (you may have already configured your nodes), but it is important to remember that this procedure only works for the “environmental” type:

Node RED NCD node types

Once you have the environmental sensor configured, the next step is to connect the sensor output (node) to the subflow input:

If you double left click on the subflow you can open the settings:

Node RED editing subflow instance properties

Name: you can assign an identifier to the subflow, and this will only serve to identify your specific flow within the node editor (to differentiate it from other nodes).

Custom Path: this property by default is static, that is, the subflow takes the data coming from your environmental sensor and will store it in a local location inside Node-RED:

Automatically the subflow stores the generated csv files of the sensor(s) inside the Node-RED folder.

Linux: $HOME/.node-red/log
Windows: $HOMEPATH/.node-red/log

So by default it is not necessary to assign a value to this property, but, if for some reason you need the data generated by the sensor to be stored in another local location, then you can assign this property to that new location and the stream will now take that path to store the data:

Linux
Windows
Node RED windows path

Click on the Deploy button , in order to apply the changes to our flow, it is located at the top right of the Node-RED flow editor:

IMPORTANT:

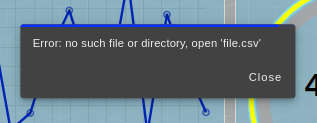
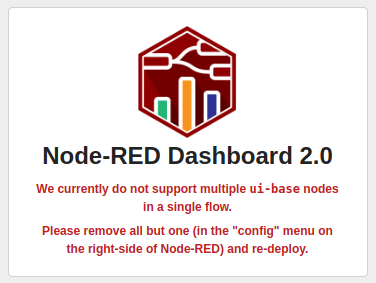
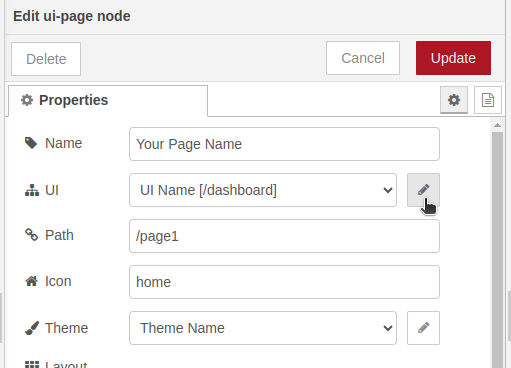
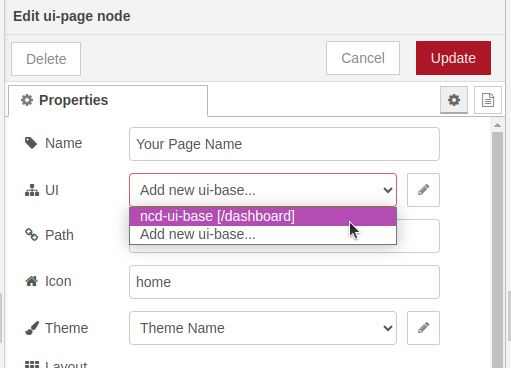
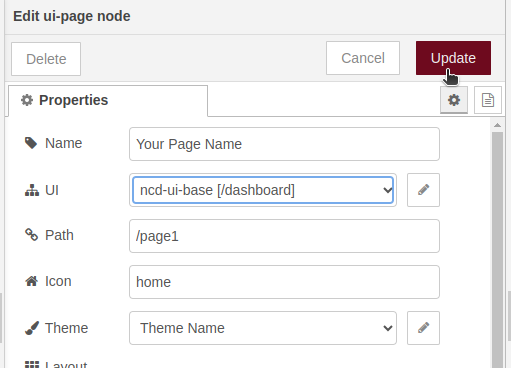
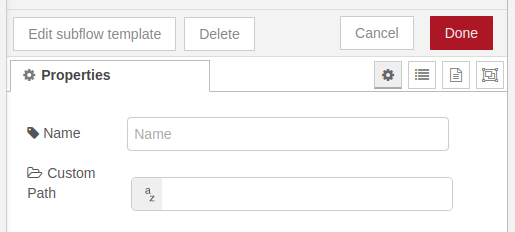
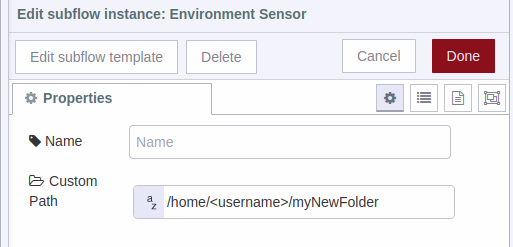
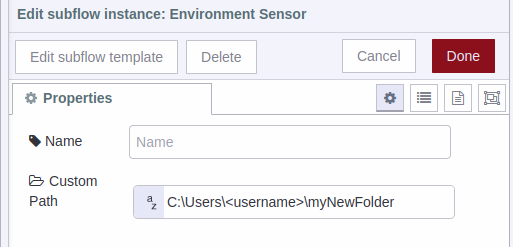
You must be careful to assign a valid route because if the subflow detects that it is not a valid route it will display an error message:

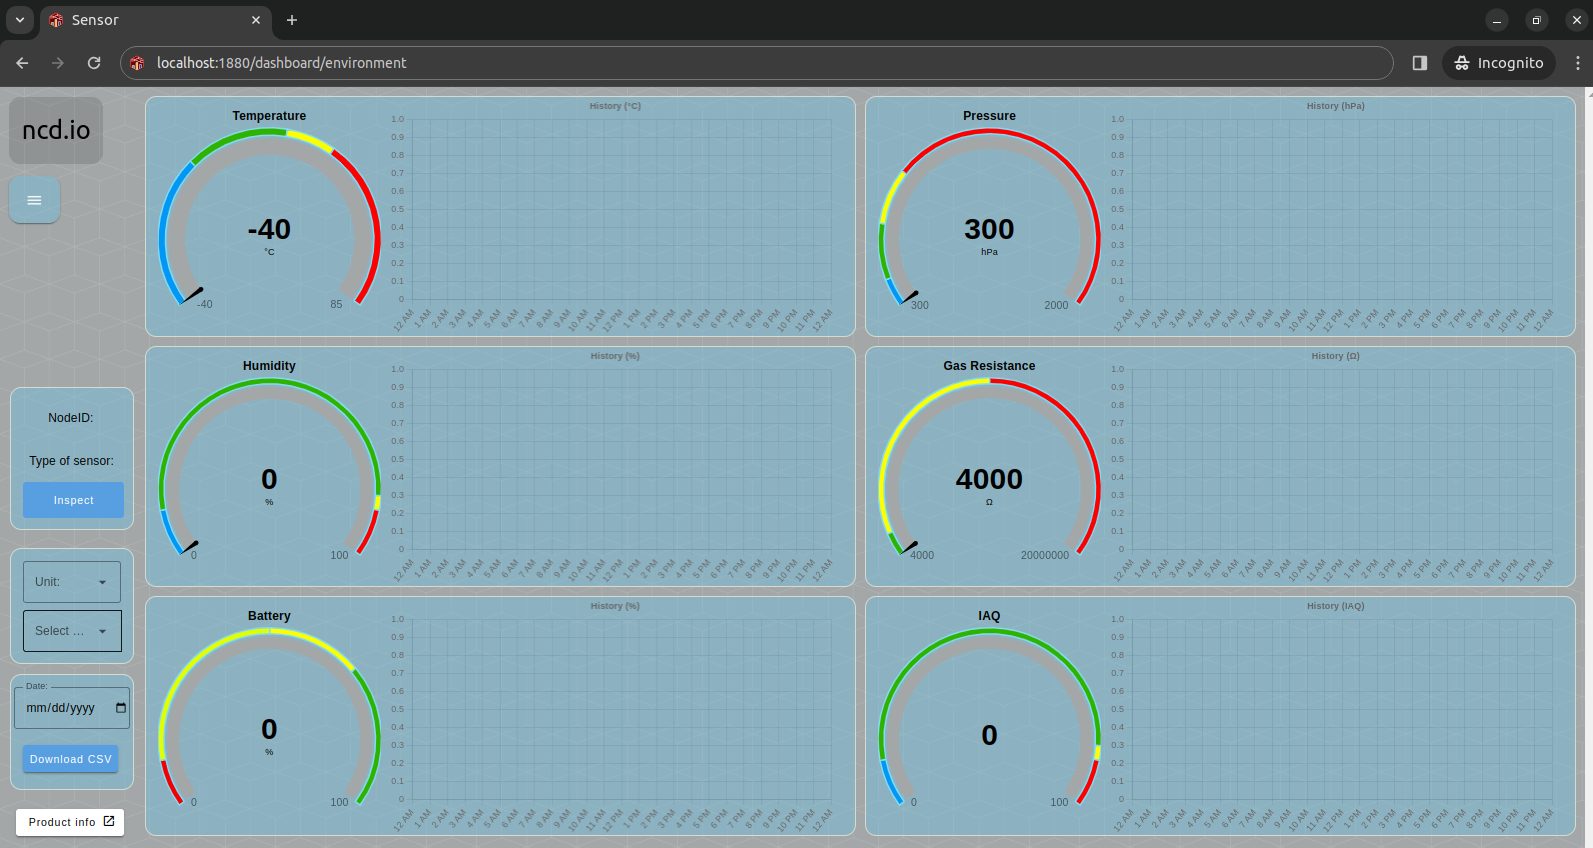
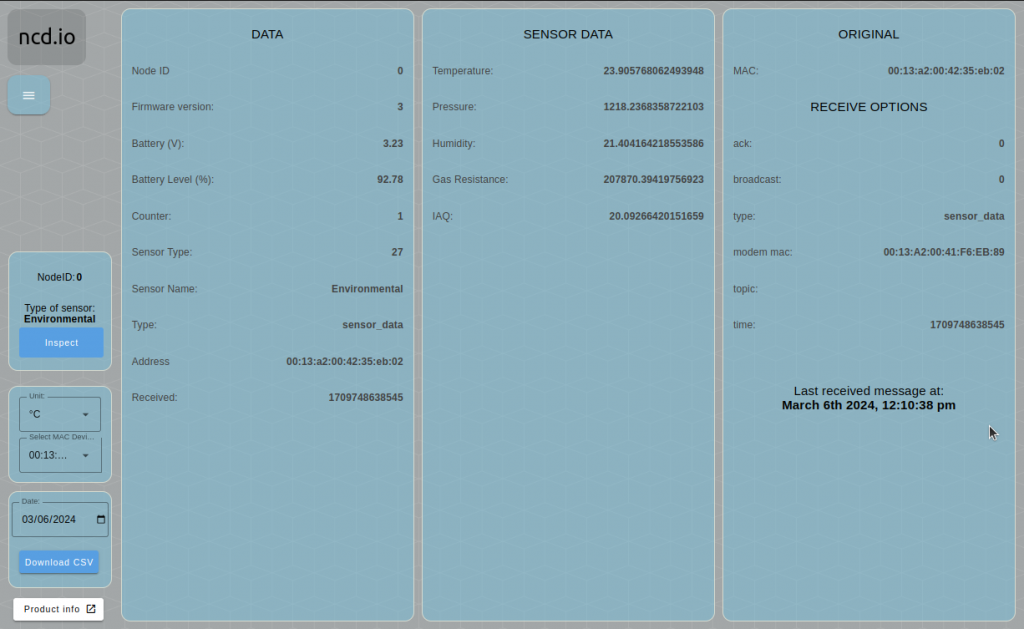
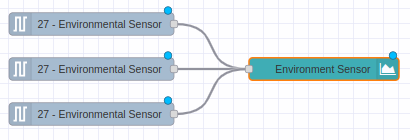
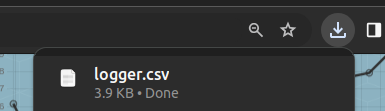
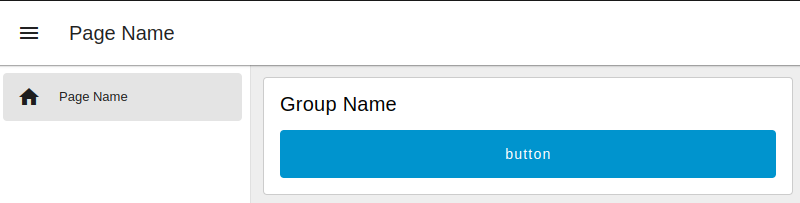
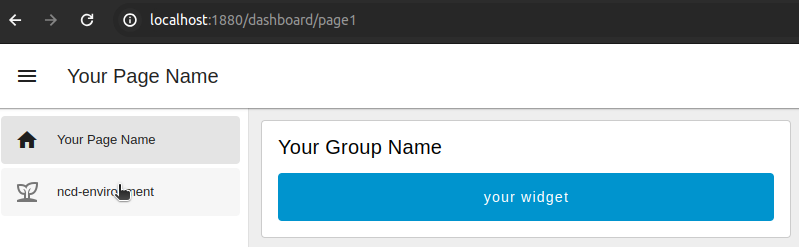
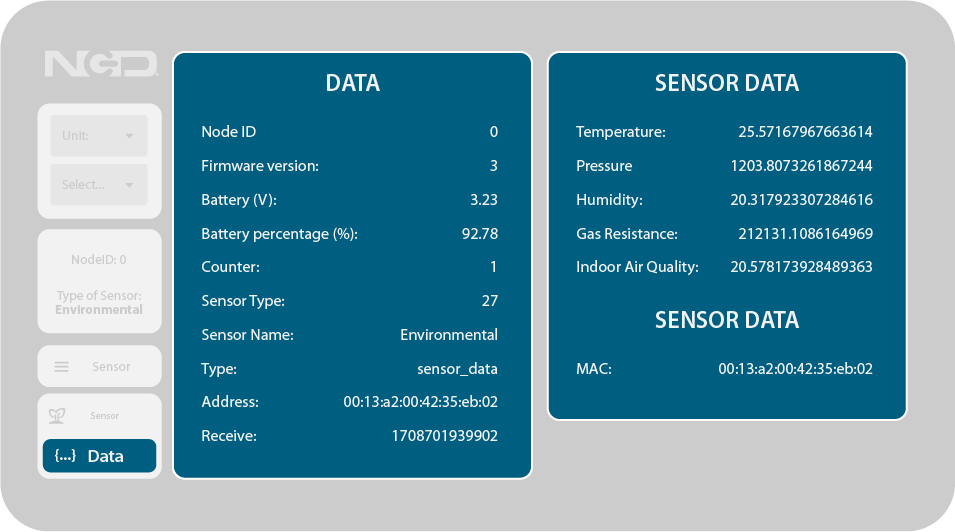
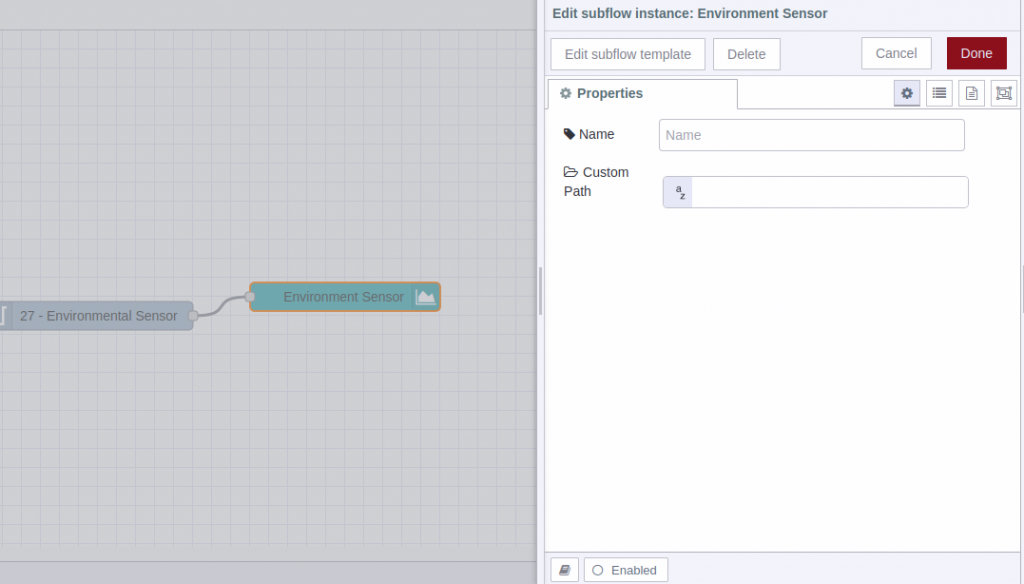
If the path you enter is correct or you leave the default path (leaving the property text field blank), then when new data arrives through the sensor at the subflow input you should be able to see that the data is being stored correctly:


Step 4 - Check your Dashboard

The next step is to go to your Dashboard to see the real time data coming from the sensor by clicking on the Dashboard 2.0 option in the sidebar:

Node RED Dashboard 2.0

Note: In case you have deployed and cannot see the “Dashboard 2.0” content, you should reload the current page of the web browser with the “F5” key or “Reload page”.

Then click on the “Open Dashboard” option:

Your Dashboard will automatically open in a new window, where you can see the following:

ncd.io Dashboard Features

Temperature Settings

The dropdown for temperature unit of measure:

Celsius Selected

Fahrenheit Selected

MAC Device Selection

The dropdown where you can select the MAC device you want to display its information on the dashboard (in case you have two or more sensors connected to the subflow input).

You will be able to see (in the dropdown) the list of the MAC address(es) of the devices connected to the subflow until you receive a new message after deploying, be patient.

The Main Menu

With the main menu you can navigate between the ui-pages (this menu allows you to navigate between two or more ncd-dashboards, in case you have configured two or more):

For example if you have configured an ncd-environment-dashboard and you import an ncd-uptime-dashboard, you will be able to navigate between the subflows from the main menu.

Note: A step-by-step configuration for importing two or more ncd-dashboard subflows and accessing them from the main menu is presented later in this post.

Node ID

Corresponds to an identifier that you can configure from your IoT device, and displays its value on the Dashboard.

Type of Sensor

Shows the type of sensor that is showing its value (for now only allows environmental).

Inspect Button

By pressing this button it is possible to access the information received from the sensor (NodeID, Firmware version, battery voltage, sensor type, MAC address, etc.), if pressed again it returns to the graphs and indicators view.

Gauges and Graphs

This is where historical and real time information is displayed.

Note: It is possible to connect two or more “Environment” type sensors to the input of this subflow, in order to visualize the data from a single ncd-dashboard.

When you select any of the devices in the list (in case you have two or more sensors connected to the input of this subflow) the data from the local csv files will be automatically loaded, and the last 20 values stored in the graphs will be displayed.

Note: The data storage is per day, in order to have a better data management.

Download CSV files

It is possible to download the locally stored CSV files directly from the ncd-dashboard, which contain the historical data provided by the Environmental Temperature-Humidity Pressure Air Quality Sensor(s).

You can see the box at the bottom left, where we have two fields:

  • Date: Corresponds to a date entry.
  • Download CSV button: Activates the download of the corresponding CSV file from the web browser.


Format must be used:

  • mm: for month.
  • dd: for day.
  • yyyy: for year.
 

To download a CSV file from the dashboard, the first thing to do is to select or enter a date of interest using the date picker, i.e. (with the current device selected using the MAC drop-down) the date of the stored data you are interested in downloading.

IMPORTANT:

Verify that the date of interest entered corresponds to a valid date, i.e. that the subflow has been storing data (that there is a csv file corresponding to that date).


For example, assuming you have verified that the subflow has been storing data on the date “February 28, 2024”, and you need to download the CSV file generated on that date, then you would enter:

To display the date picker, click on the icon to the right of the date:

Then click on the “Download CSV” button. If the subflow finds the file on that date, you should be able to see the download start (in the download icon of the web browser):

In case you enter a date of interest, which there is no CSV file generated, and press the “Download CSV” button, you will see the following message:

IMPORTANT:

CSV file download is currently only available for the default data storage option (local in the path “./node-red”).

Working with two or more ncd-dashboard in same Node-RED Project

This instructions refers to the scenario where you have previously installed and configured an ncd-dashboard (subflow) and you want to import another ncd-dashboard (subflow) to the same project.


The procedure is the same as mentioned above, with the simple difference that as soon as you press the import button in the “Import nodes” window you will see the following message at the top of our Node-RED flow editor:

This indicates that you are importing a subflow that contains one or more nodes that already exist in your current project (workspace). Specifically it refers to the configuration node “ncd-ui-base” which represents the base configuration of all our ncd-dashboards, simply click on the “Import copy” option. This shows you the detail of the elements that were imported in our project.

If everything is correct, the next step is to deploy, to apply and execute the changes in our project, using the “Deploy” button:

Now, if you go to the “Dashboard 2.0” tab and click on “Open Dashboard” or simply refresh the dashboard browser tab, you will see in the main dashboard menu the new imported ncd dashboard:

View from ncd-environment-dashboard

View from ncd-uptime-dashboard

Import subflow to an existing Dashboard 2.0 project

This procedure refers to the scenario where you already have a dashboard 2.0 configured and you want to import an ncd-dashboard (subflow) within the same Node-RED project.


For example, if you already have a dashboad 2.0 configured with some elements, in the dashboard you would have something like the following:

To import an ncd-dashboard to your existing project you use the same steps mentioned above; copy the JSON file from the GitHub repository, use the import window (or Key shortcut Ctrl-i), paste the JSON and click on import, the imported elements will be shown at the top, but if you deploy inside the dashboard 2.0 you will have the following message:

To solve this you must return to the Node-RED flow editor, go to the “dashboard 2.0” tab and inside “Layout” you will be able to see something like the following:

Note: you can identify the ui-pages of the ncd-dashboard by the fact that they are preceded by “ncd“.

Next to the “Your Page Name” identifier, if you hover the cursor you will see the “Edit” button, click on it:

This opens the page configuration window, in the UI property you will click on the “Edit” (pencil icon).

Now the configuration window of the “ui-base” configuration node opens, you should click on the “Delete” button (located in the upper left part of the window):

Automatically it returns to the ui-page window, and it shows us the box of the property “UI” with the outline in red color:

Click on the arrow and then select the property “ncd-ui-base[/dashboard]”:

Finally click on the “Update” button at the top right of the window:

Note: this same procedure must be done if you have two or more pages previously configured in dashboard 2.0.

Now click on deploy button to apply the changes made to the project:

Go to the “Dashboard 2.0” tab and click on the “Open Dashboard” button:

You will notice that the identifier of the added ncd-dashboard has been added to the main menu of the dashboard 2.0:

Possible drawbacks during subflow import

1.- Import subflow without dependencies installed

If you import the flow without having previously installed Dashboard 2, you will get a message like the following:

So you must delete the subflow and install the module “@flowfuse/node-red-dashboard” as mentioned at the beginning, and repeat the process. To delete the subflow you must double-click on the subflow in the Node-RED node editor to open its properties:

Then click on the “Delete” button at the top of the window:

node-red delete error

You must also delete the subflow node from the node palette in the “NCD” or “Sublows” group, double click on the node.

This opens the subflow window, at the top click on the “delete subflow” button:

2.- Import the same subflow twice / delete subflow.

In case by mistake or by some procedure you have imported the same subflow twice, or you simply want to remove an ncd-dashboard subflow from the nodes palette, you must follow this quite simple procedure.

(1) Double click on the subflow node you wish to delete, the ncd-dashboard subflows are located in the node palette within the NCD group.

(2) Once the “Edit subflow template” tab opens at the top, click on the “delete subflow” button.

This completely removes the subflow, as well as the associated configuration nodes, you will notice that it no longer appears in the nodes palette.

Node RED NCD nodes

Do not forget to deploy in order to save and apply the changes made to your project.

Conclusion

In June 2023, it was announced that construction would begin on the next generation of Node-RED Dashboard, the most popular user interface framework for Node-RED. With the release of the first major version (1.0.0) of Node-RED Dashboard 2.0. It is now possible to build our custom dashboards for use with our ncd.io sensors, like the one shown in this post and have at hand a wide range of components to use, thus starting to migrate our Dashboard 1 projects to Dashboard 2 gradually, the solution is still young but promises great things.

Thank you, Eduardo M.