

Atrium Gateway REST API
Pull live sensor readings, alerts, and gateway state out of your Atrium Gateway and into any external system — a CMMS, ERP, historian, SCADA platform, or your own application.
1. Overview
Every Atrium Gateway exposes the same HTTP API that its own web interface uses. There is no separate integration product to license, no cloud account to create, and no data leaves your network unless you choose to send it.
Atrium is a self-contained platform. NCD wireless sensors report over a sub-GHz DigiMesh radio to a modem on the gateway; the gateway decodes, stores, alerts on, and visualizes that telemetry locally. The API is simply the same interface the built-in web app consumes, available to you on equal terms.
What you can do with it
- Read sensor telemetry — current values and full history, per sensor and per metric.
- Read the sensor inventory — device IDs, types, names, locations, assets, battery, signal, and online/offline health.
- Read and manage alerts — active alert state, complete alert history, threshold rules, and multi-condition automations.
- Write sensor metadata — push your own asset names, locations, and install dates from your system of record into Atrium.
- Administer the gateway — configuration, network settings, scheduled reports, and firmware updates.
Two services behind one door
Internally the gateway runs two Node services. You do not need to care about this — nginx listens on port 80 and routes each path to the correct service, so every endpoint in this guide is reachable at the same base URL. It is documented only because the service labels appear throughout this guide and in error messages.
| Service | Internal port | Owns |
|---|---|---|
atrium-api | 3001 | Authentication, all telemetry and inventory reads, most CRUD, gateway configuration |
atrium-ingest | 3002 | The radio itself — sensor configuration push, mesh mapping, FFT requests, MQTT, and report delivery |
2. Base URL and Access
All endpoints are relative to a single base URL: your gateway’s address. How you reach it depends on where your client runs.
From the same network (recommended)
If your integration runs on the same LAN as the gateway, use its IP address or hostname over plain HTTP on port 80:
http://192.168.1.50           # by IP address (most reliable)
http://ncd-b00e.local         # by mDNS hostname, if your network resolves it
The gateway’s hostname follows the pattern ncd-xxxx, where xxxx is the last four characters of its LAN MAC address — the same code printed on the physical label. You can confirm the address on the gateway’s own Settings page.
From outside the network (Remote Access)
Cloud-hosted platforms such as ServiceNow cannot reach a private LAN address. For those, enable Remote Access under Settings → Network → Services. This opens a secure outbound Cloudflare tunnel and publishes the gateway at a stable HTTPS hostname:
https://b00e.iolight.com # <label-code>.iolight.com, HTTPS onlyThe exact hostname for your unit is shown on the Settings page once Remote Access is enabled. It requires no inbound firewall rule and no port forwarding, because the tunnel is established outbound from the gateway.
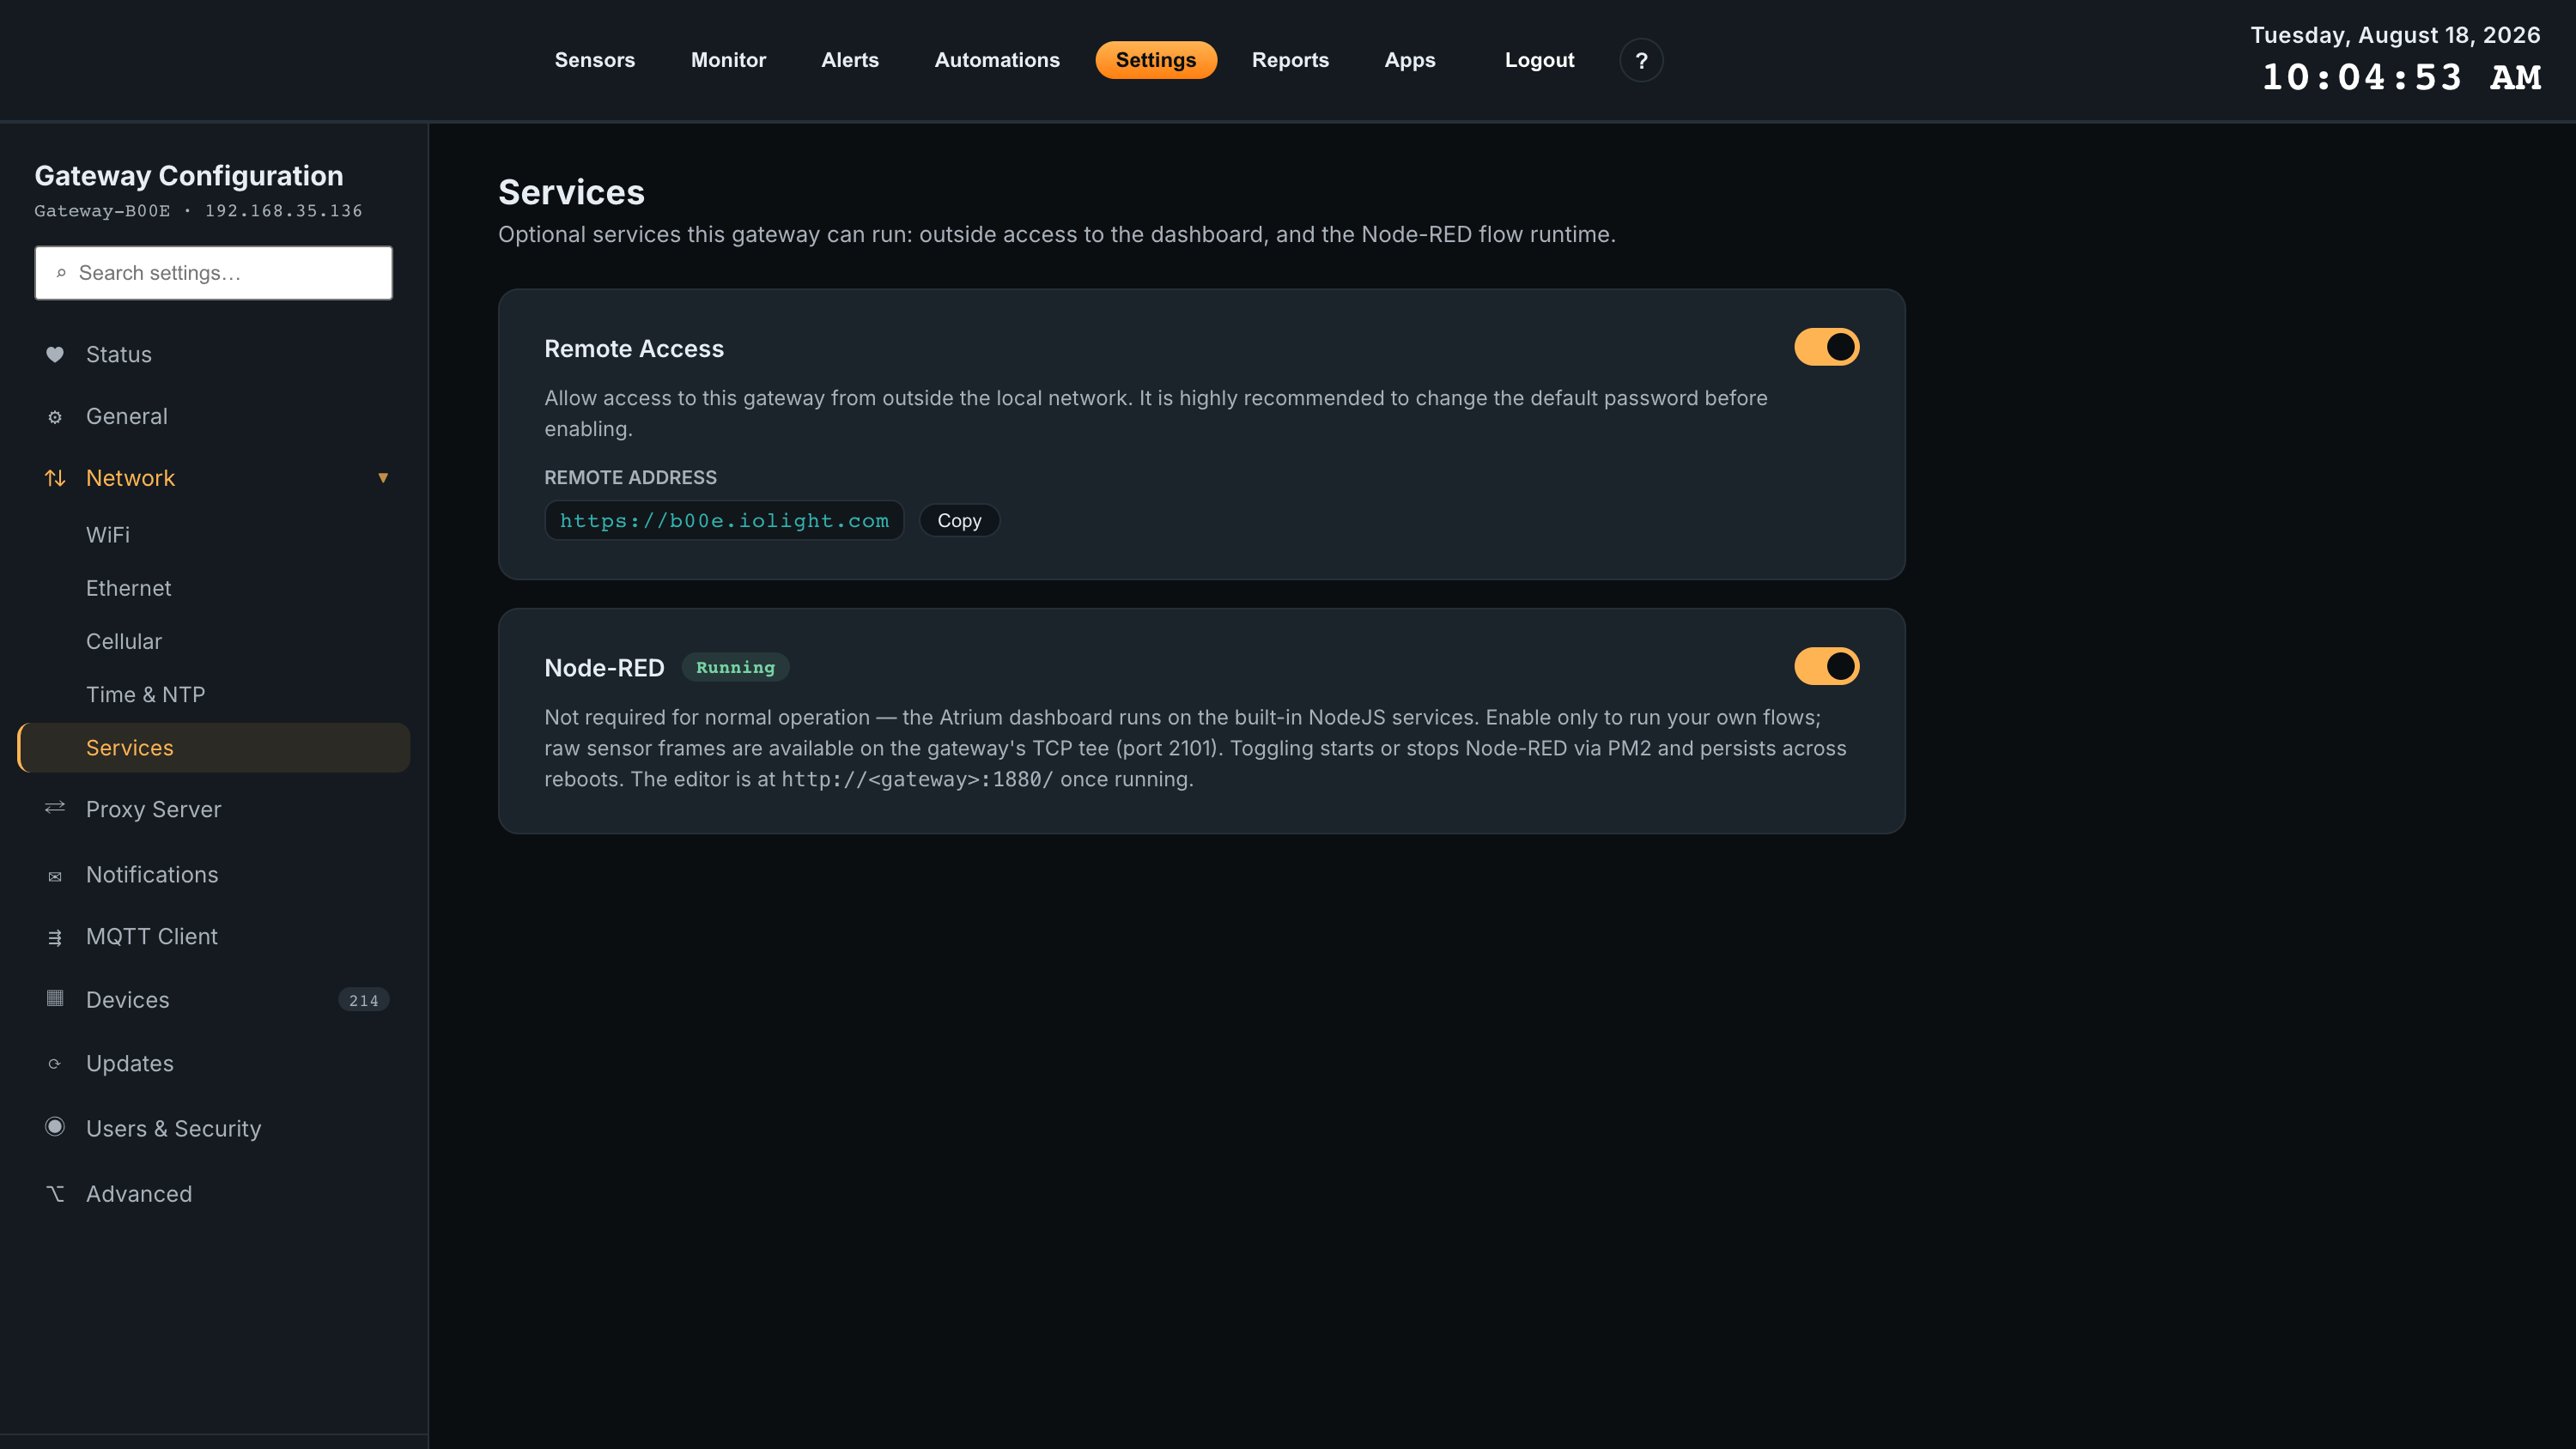
https://, is your API base URL. The same panel carries the optional Node-RED toggle (Section 13).Health check
One endpoint needs no authentication at all, which makes it useful as a liveness probe from a monitoring system:
Returns immediately if the API service is up.
curl http://192.168.1.50/api/_health{ "ok": true, "service": "atrium-api" }3. Authentication
Atrium uses session tokens. You exchange a username and password for a bearer token, then send that token on every subsequent request. There is no OAuth flow and no separate API-key store.
Step 1 — Log in
Exchanges credentials for a session token. This is the same login the web interface uses, so any Atrium user account works.
Request body
| Field | Type | Required | Description |
|---|---|---|---|
username | string | Yes | Atrium account username |
password | string | Yes | Account password |
curl -X POST http://192.168.1.50/api/auth/login \
  -H 'Content-Type: application/json' \
-d '{"username":"ncdio","password":"your-password"}'{
"token": "e407a4ba1f73b881c6d7bc819e0e2f6e640b75a1ccabb35eb4c3c1de2dade81b",
"username": "ncdio",
"role": "admin",
"allowed_pages": null,
"enabled": true
}Response fields
| Field | Description |
|---|---|
token | 64-character hex session token. Send this as your bearer credential. |
role | admin or viewer. |
allowed_pages | null for an admin. For a viewer, the array of interfaces an admin has granted. |
enabled | Whether the account is active. |
Error responses
| Status | Body | Cause |
|---|---|---|
| 400 | {"error":"Username and password required"} | Either field missing or blank |
| 401 | {"error":"Invalid credentials"} | Wrong username or password |
| 403 | {"error":"This account is disabled…"} | Viewer account currently disabled by an admin |
Step 2 — Send the token
Every other endpoint requires the token in an Authorization header using the Bearer scheme:
curl http://192.168.1.50/api/sensors \
  -H 'Authorization: Bearer e407a4ba1f73b881c6d7bc819e0e2f6e640b75a1ccabb35eb4c3c1de2dade81b'
Token lifetime and renewal
The correct pattern is to treat 401 as “log in again and retry”, rather than tracking expiry dates:
-
1
Cache the tokenLog in once, keep the token in memory or a credential store, and reuse it across requests. Do not log in on every call — each login inserts a new session row on the gateway.
-
2
Watch for 401On any
401response, discard the cached token, call/api/auth/loginagain, and retry the original request once. -
3
Optionally refresh earlyIf you prefer not to fail even once, re-authenticate on a fixed schedule — daily is comfortable and well inside the 7-day window.
Checking a token
Confirms a token is still valid and reports the account it belongs to. Useful as a cheap pre-flight after a long idle period.
{ "valid": true, "username": "ncdio", "role": "admin",
"allowed_pages": null, "enabled": true }Changes the authenticated account’s username and/or password. Requires the current password.
{
  "current_password": "old-password",
  "new_password": "new-password",
  "new_username": "integrations"   // optional; omit to keep the username
}Recommended: a dedicated account
Rather than embedding the admin credentials in an external system, create a second account for the integration. Atrium supports one admin and one viewer account, and the viewer can be restricted to a granted set of interfaces — see Section 13.
4. Conventions
These rules hold across every endpoint. Read this section once and the rest of the guide becomes predictable.
Requests and responses
| Aspect | Behavior |
|---|---|
| Content type | application/json for both requests and responses. Send Content-Type: application/json on any request with a body. |
| Empty POST bodies | Allowed. An empty body on a JSON POST is parsed as {}, so action endpoints can be called with no payload. |
| Parameters | Path parameters are shown as :name. Query parameters are documented per endpoint. Bodies are JSON objects. |
| CORS | Every response carries Access-Control-Allow-Origin: *, and OPTIONS /api/* returns 204. Browser-based clients work without a proxy. |
| Unknown fields | Ignored on write. Sending extra keys is harmless. |
| Partial updates | PUT and PATCH endpoints update only the fields you send. Omitted fields are left unchanged. |
Timestamps
Two conveniences to be aware of:
- Some objects also carry a pre-formatted ISO 8601 companion field — the sensor object, for example, has both
last_seen_epochandlast_seen_utc. - The gateway’s display timezone (a Settings preference) affects the web interface and report rendering only. The API always speaks UTC. Convert on your side.
Returns the gateway’s current clock. Use it to detect clock skew between your system and the gateway before building time-window queries — if the two disagree, a “last 15 minutes” query can silently return nothing.
{ "epoch_ms": 1788874900454, "iso": "2026-09-08T13:41:40.454Z" }Status codes
| Code | Meaning |
|---|---|
200 | Success. |
201 | Created. Returned by most resource-creating POST endpoints. |
204 | No content. Returned for OPTIONS preflight. |
400 | Bad request — missing or invalid parameters. The body explains what. |
401 | Missing, invalid, or expired token. Re-authenticate. |
402 | An installed app requires a license. |
403 | Forbidden — admin-only endpoint, unsupported hardware, or a scoped token out of bounds. |
404 | Resource not found, or the endpoint does not exist on this platform version. |
409 | Conflict — the resource already exists, or an operation is already running. |
500 | Server error. |
502 | An underlying system helper failed — seen on network-configuration endpoints. |
503 | A required subsystem is unavailable — e.g. MQTT not configured, or a helper script missing. |
Error body shape
Errors return a JSON object with an error key. Authentication failures add a message; some validation failures add an errors array or a machine-readable code.
// 401 — no token supplied
{ "error": "Authentication required", "message": "No authorization token provided" }

// 401 — token expired or unknown
{ "error": "Authentication failed", "message": "Invalid or expired session token" }

// 400 — validation
{ "error": "whitelist parameter must be 0 or 1" }

// 400 — multi-field validation
{ "error": "Validation failed", "errors": ["Label 1: metric is required"] }

// 503 — subsystem unavailable, with a code to branch on
{ "error": "wifi helper not installed", "code": "helper_missing" }
There is no realtime channel
Polling guidance
- Match your poll interval to the sensor report interval, not to your dashboard’s refresh rate. Most NCD sensors report every 10 minutes by default; polling every 30 seconds for a sensor that reports hourly just burns cycles on an embedded gateway.
- Poll incrementally. Track the newest
timestampyou have already ingested and pass it asstart_timeon the next request, rather than re-fetching a fixed window. - Prefer one call per sensor+metric over broad queries. The readings table grows without bound, and the database index is built for
device_id+metric+tslookups. - Be gentle. The EG5100 is a single-core device with no swap. A tight polling loop across dozens of sensors is felt by the whole system.
5. Quick Start
A complete round trip — log in, list sensors, and pull readings — in three calls. Every response below was captured from a live gateway.
-
1
Get a tokenbashLog in and capture the token
GATEWAY="http://192.168.1.50" TOKEN=$(curl -s -X POST "$GATEWAY/api/auth/login" \ -H 'Content-Type: application/json' \ -d '{"username":"ncdio","password":"your-password"}' \ | python3 -c 'import sys,json; print(json.load(sys.stdin)["token"])') echo "$TOKEN" -
2
Find your sensorsbashList the sensor inventory
curl -s "$GATEWAY/api/sensors" \
  -H "Authorization: Bearer $TOKEN"
Note the
device_idof a sensor you care about — it is the 64-bit radio MAC, and it is the key for every other call. -
3
Discover its metrics, then read thembashMetrics, then the 10 newest temperature readings
DEVICE="00:13:a2:00:42:41:65:28"

# Which metrics does this sensor actually report?
curl -s "$GATEWAY/api/sensors/$DEVICE/metrics" \
  -H "Authorization: Bearer $TOKEN"
# → {"device_id":"00:13:a2:00:42:41:65:28",
#    "metrics":["battery_pct","battery_v","counter","humidity","rssi","temperature"]}

# Pull the 10 most recent temperature readings
curl -s "$GATEWAY/api/sensors/$DEVICE/telemetry?metric=temperature&limit=10" \
  -H "Authorization: Bearer $TOKEN"
6. Sensors and Inventory
The sensor object is the backbone of the API. It carries identity, your own asset metadata, the latest health readings, and a computed status — enough to build an asset list in an external system without any further calls.
Lists all whitelisted sensors, newest-reporting first. Returns a bare JSON array, not a wrapper object.
Query parameters
| Parameter | Type | Default | Description |
|---|---|---|---|
q | string | — | Case-insensitive substring search across device ID, sensor name, location, asset, and custom name. Also matches a device ID typed without separators. |
limit | integer | 1000 | Maximum rows. Clamped to the range 1–5000. |
curl -s "$GATEWAY/api/sensors?q=office&limit=50" \
-H "Authorization: Bearer $TOKEN"[
{
"device_id": "00:13:a2:00:42:41:65:28",
"sensor_type": 1,
"sensor_name": "1 - Temperature/Humidity",
"firmware": 10,
"last_seen_epoch": 1788874772898,
"last_seen_utc": "2026-09-08T13:39:32.000Z",
"last_rssi": 40,
"last_battery_v": 3.29,
"last_battery_pct": 99.64,
"location": "Travis' Office",
"asset": "Jesse's Desk",
"name": "Travis Office Temperature/Humidity",
"install_date": "2026-06-02",
"report_interval": 600,
"last_error": null,
"last_error_ts": null,
"first_seen_ts": 1788536218806,
"is_online": true,
"has_active_alert": false,
"status": "healthy"
}
]The sensor object
| Field | Type | Description |
|---|---|---|
device_id | string | The sensor’s 64-bit DigiMesh MAC. Immutable, and the key for every per-sensor endpoint. |
sensor_type | integer | NCD numeric sensor type (e.g. 1 = Temperature/Humidity). See /api/sensor-types. |
sensor_name | string|null | Factory-reported type name. |
firmware | integer|null | Sensor firmware revision. |
last_seen_epoch | integer|null | Last packet received, epoch ms. |
last_seen_utc | string|null | The same instant as an ISO 8601 string, for convenience. |
last_rssi | number|null | Signal strength from the last packet. Lower is better — this is a positive dBm magnitude, so 40 is a strong link and 90 is marginal. |
last_battery_v | number|null | Battery volts. |
last_battery_pct | number|null | Battery percentage, 0–100. |
location | string|null | Operator-assigned location. Writable — see Section 8. |
asset | string|null | Operator-assigned asset. Use this to carry your CMMS asset ID. |
name | string|null | Operator-assigned friendly name, overriding sensor_name in the UI. |
install_date | string|null | YYYY-MM-DD. |
report_interval | integer | Expected seconds between reports. Defaults to 600. Drives the offline calculation. |
last_error | string|null | Most recent sensor-reported error, if any. |
last_error_ts | integer|null | When that error arrived, epoch ms. |
first_seen_ts | integer|null | First time the gateway ever saw this device. Present on the list endpoint only. |
is_online | boolean | true when the last packet is newer than twice report_interval. |
has_active_alert | boolean | true if any enabled trigger or alert template is currently firing for this device. Present on the list endpoint only. |
status | string | Computed health. See the table below. |
How status is computed
Evaluated in this order, first match wins:
| Status | Condition |
|---|---|
offline | is_online is false — no packet within twice the report interval. |
error | A last_error is present, or battery ≤ 30%, or RSSI ≥ 75 (weak signal). |
healthy | Everything else. |
A single sensor, keyed by device_id. Returns the same object as the list endpoint, minus first_seen_ts and has_active_alert.
curl -s "$GATEWAY/api/sensors/00:13:a2:00:42:41:65:28" \
  -H "Authorization: Bearer $TOKEN"
Returns 404 with {"error":"Sensor not found"} for an unknown device ID.
Every sensor type present on this gateway with a count of devices, most common first. A cheap way to learn what hardware is deployed before iterating the full inventory.
[
  { "type": 111, "count": 449 },
  { "type": 115, "count": 209 },
  { "type": 1,   "count": 60  }
]Health transitions for one sensor, newest first — the audit trail behind the current status. Useful for reliability reporting and for confirming an intermittent sensor really is intermittent.
Query parameters
| Parameter | Type | Default | Description |
|---|---|---|---|
limit | integer | 50 | Maximum transitions returned. |
[
  {
    "id": 4127,
    "device_id": "00:13:a2:00:42:41:65:28",
    "old_status": "healthy",
    "new_status": "offline",
    "reason": "no report within 2x interval",
    "ts": 1788861600000
  }
]
7. Telemetry Readings
This is the endpoint most integrations spend all their time in. Readings are stored as one row per (timestamp, device_id, metric), so a single sensor reporting temperature and humidity produces two rows per report.
Lists the metric names this sensor has actually reported. Always call this before hard-coding metric names — the available metrics depend on sensor type, firmware, and configuration, not on a fixed catalog.
{
  "device_id": "00:13:a2:00:42:41:65:28",
  "metrics": ["battery_pct","battery_v","counter","humidity","rssi","temperature"]
}
Note that battery_pct, battery_v, rssi, and counter appear alongside the real measurements — the gateway stores sensor health as ordinary metrics, so you can trend battery life exactly like temperature.
Returns readings for one sensor, optionally filtered to a single metric and time window.
Query parameters
| Parameter | Type | Default | Description |
|---|---|---|---|
metric | string | all metrics | Restrict to one metric name. Strongly recommended — without it you get every metric interleaved in one list. |
start_time | integer | — | Inclusive lower bound on timestamp, epoch ms. |
end_time | integer | — | Inclusive upper bound on timestamp, epoch ms. |
limit | integer | 1000 | Maximum rows, capped at 10000. Applies to raw queries only. |
bucket_ms | integer | — | Requests time-bucketed aggregation. See the warning below before using this. |
# 1. Current value of one metric
curl -s "$GATEWAY/api/sensors/$DEVICE/telemetry?metric=temperature&limit=1" \
  -H "Authorization: Bearer $TOKEN"

# 2. Everything new since the last time you polled (incremental — do this)
curl -s "$GATEWAY/api/sensors/$DEVICE/telemetry?metric=temperature&start_time=1788874000000&limit=5000" \
  -H "Authorization: Bearer $TOKEN"

# 3. A fixed historical window
curl -s "$GATEWAY/api/sensors/$DEVICE/telemetry?metric=temperature&start_time=1788790000000&end_time=1788876400000" \
-H "Authorization: Bearer $TOKEN"{
"device_id": "00:13:a2:00:42:41:65:28",
"metric": "temperature",
"bucket_ms": null,
"count": 3,
"readings": [
{
"timestamp": 1788874772898,
"device_id": "00:13:a2:00:42:41:65:28",
"metric": "temperature",
"value": 25.2,
"counter": 14,
"sensor_type": 1,
"firmware": 10,
"rssi": 40,
"tags": "{\"nodeId\":0}"
},
{
"timestamp": 1788874742279,
"device_id": "00:13:a2:00:42:41:65:28",
"metric": "temperature",
"value": 25.26,
"counter": 13,
"sensor_type": 1,
"firmware": 10,
"rssi": 40,
"tags": "{\"nodeId\":0}"
}
]
}The reading object
| Field | Type | Description |
|---|---|---|
timestamp | integer | When the gateway recorded the reading, epoch ms UTC. |
device_id | string | Source sensor. |
metric | string | Metric name. |
value | number | The measurement, in the sensor’s native unit. |
counter | integer|null | Sensor’s own transmission counter. Gaps indicate packets that never arrived — useful for link-quality auditing. |
sensor_type | integer|null | Type as reported in that packet. |
firmware | integer|null | Firmware as reported in that packet. |
rssi | integer|null | Signal strength for that packet. |
tags | string|null | A JSON-encoded string, not an object — e.g. "{\"nodeId\":0}". Parse it a second time if you need the contents. |
Bucketed aggregation
Passing bucket_ms switches the endpoint into an aggregating mode that groups readings into fixed time buckets and returns an average per bucket, plus min_v, max_v, and a sample count n. Accepted values are clamped to between 1 second and 24 hours, and the aggregated result is capped at 5000 buckets.
{
  "device_id": "00:13:a2:00:42:41:65:28",
  "metric": "temperature",
  "bucket_ms": 3600000,
  "count": 250,
  "readings": [
    {
      "timestamp": 1788867578278,   // bucket start (currently NOT aligned — see warning)
      "device_id": "00:13:a2:00:42:41:65:28",
      "metric": "temperature",
      "value": 24.71,               // mean of the bucket
      "min_v": 24.71,
      "max_v": 24.71,
      "n": 1,                       // samples in the bucket
      "counter": 35,
      "sensor_type": 1,
      "firmware": 10,
      "rssi": 40
    }
  ]
}
Note that bucketed results are ordered ascending by bucket, the opposite of raw results.
Lists stored raw vibration captures for a vibration sensor, newest first. Returns capture metadata — sample rate, sample count, full-scale range, temperature, RPM, and a confidence figure — not the waveform itself.
| Parameter | Type | Default | Description |
|---|---|---|---|
start_time | integer | — | Lower bound, epoch ms. |
end_time | integer | — | Upper bound, epoch ms. |
limit | integer | 50 | Maximum captures, capped at 200. |
{
  "device_id": "00:13:a2:00:5a:00:00:07",
  "count": 1,
  "fft_readings": [
    { "id": 91, "timestamp": 1788870000000, "device_id": "00:13:a2:00:5a:00:00:07",
      "sensor_type": 110, "odr": 3200, "total_samples": 4096, "fsr": 16,
      "temperature": 31.4, "rpm": 1780, "fft_confidence": 0.93,
      "created_at": 1788870001200 }
  ]
}Retrieves one stored capture by its id. To compute a spectrum from it, see Section 15.
8. Metadata, Labels and Units
Atrium stores operator-supplied context alongside each sensor. These endpoints are writable, which makes the gateway a downstream consumer of your system of record rather than a second place to maintain asset names by hand.
The raw metadata row for one sensor. Returns {} if no metadata has ever been saved.
{
  "device_id": "00:13:a2:00:42:41:65:28",
  "location": "Travis' Office",
  "asset": "Jesse's Desk",
  "name": "Travis Office Temperature/Humidity",
  "install_date": "2026-06-02",
  "report_interval": 600,
  "offline_alert_enabled": 1,
  "offline_alert_emails": "travis@ncd.io"
}Creates or replaces the metadata row and returns the merged result.
Request body
| Field | Type | Notes |
|---|---|---|
location | string | Free text. Blank or omitted becomes null. |
asset | string | Free text. The natural home for an external asset ID. |
name | string | Friendly name. sensor_name is accepted as an alias. |
install_date | string | YYYY-MM-DD. A longer date string is truncated to that form. |
report_interval | integer | Seconds. Defaults to 600 if omitted or unparseable. Drives offline detection. |
offline_alert_enabled | boolean | Email when this sensor stops reporting. |
offline_alert_emails | string | Recipient list for the offline alert. |
curl -s -X POST "$GATEWAY/api/sensors/$DEVICE/meta" \
  -H "Authorization: Bearer $TOKEN" \
  -H 'Content-Type: application/json' \
  -d '{
        "location": "Plant 2 / Line 4",
        "asset": "PUMP-00417",
        "name": "Line 4 Feed Pump — Bearing",
        "install_date": "2026-06-02",
        "report_interval": 600,
        "offline_alert_enabled": true,
        "offline_alert_emails": "maintenance@example.com"
      }'
The response is the stored row, so you can confirm exactly what was persisted.
Custom display labels for this sensor’s metrics.
{ "labels": [ { "metric": "temperature", "label": "Bearing Temp" } ] }Sets labels in bulk. Send {"labels":[{"metric":"...","label":"..."}]}. An empty-string label deletes that label.
The core metrics battery_pct, rssi, and counter cannot be relabeled; attempting it returns 400 with a per-item errors array.
Unit-conversion formulas configured for this sensor’s metrics. Important for integrators: these are applied by the web interface for display. Stored telemetry — and therefore what the API returns — is always unconverted. If a customer has configured a conversion, read it here and apply the same arithmetic so your figures match what they see on screen.
{
  "conversions": [
    { "metric": "temperature", "formula": "value * 9 / 5 + 32",
      "unit": "°F", "label": "Bearing Temp", "visible": true }
  ]
}
The formula is a JavaScript expression in a single variable, value.
Sets conversions in bulk via {"conversions":[…]}. Each formula is validated by evaluation against sample inputs before it is stored, so a malformed expression is rejected with 400 rather than silently breaking the customer’s dashboard. Core metrics cannot be converted.
The operator’s preferred chart ordering for this sensor’s metrics, as an array of metric names. Purely a display preference.
Sets it. Body is {"order":["temperature","humidity"]}; maximum 100 entries.
Synthetic variables
Synthetic variables are computed metrics — a formula over readings from one or more real sensors, stored back into the readings table under the device ID synthetic. Use them to expose a derived value (a differential, an efficiency figure, a total) to your integration without recomputing it downstream.
Lists all synthetic variables as {synthetic_variables:[…], count}. Each carries id, name, formula, unit, label, and its inputs array.
One synthetic variable. 404 if unknown.
Creates one. Requires name, formula, and a non-empty inputs array in which every entry has var, device_id, and metric. The formula is validated before saving. Returns 201 with the generated id.
{
  "name": "supply_return_delta",
  "formula": "supply - return_",
  "unit": "°C",
  "label": "Supply/Return Δ",
  "inputs": [
    { "var": "supply",  "device_id": "00:13:a2:00:42:41:65:28", "metric": "temperature" },
    { "var": "return_", "device_id": "00:13:a2:00:42:41:65:99", "metric": "temperature" }
  ]
}
Read the resulting values back from the readings table using device ID synthetic and the variable’s name as the metric.
Dry-runs a formula against literal values without saving anything. Body is {"formula":"a+b","inputs":[{"var":"a","value":1},{"var":"b","value":2}]}; returns {"ok":true,"result":3,…}, or 400 with the evaluation error.
Deletes the variable and purges its computed readings. Not reversible.
9. Device Management
Atrium separates devices it has heard from devices it is watching. A gateway in a busy RF environment often sees hundreds of neighboring NCD sensors; only whitelisted ones appear in the sensor list and generate alerts.
Lists devices on one side of the whitelist.
Query parameters
| Parameter | Type | Required | Description |
|---|---|---|---|
whitelist | 0 or 1 | Yes | 1 for whitelisted devices, 0 for those seen but not whitelisted. |
[
  { "device_id": "00:13:a2:00:42:38:62:c6", "sensor_type": 115,
    "sensor_name": null, "is_whitelisted": false, "last_seen_ts": 1780690645050 }
]Whitelists or un-whitelists a single device. Body is {"is_whitelisted": true}. Anything other than boolean true is treated as false.
Whitelists or un-whitelists many devices at once — the efficient way to commission a batch of sensors.
{
  "device_ids": ["00:13:a2:00:42:41:65:28", "00:13:a2:00:42:41:65:99"],
  "is_whitelisted": true
}
Returns {"ok":true,"updated_count":2,"is_whitelisted":true}. An empty or missing array returns 400.
Removes devices and all associated data — every reading, raw ingest row, metadata row, and alert condition — in a single transaction.
Body is {"device_ids":[…]}; returns {"ok":true,"deleted_count":n}.
Deletes all telemetry, devices, metadata, and alert rules, then compacts the database. Configuration, users, and sessions survive.
10. Alerts and Alert History
For a CMMS integration, alert history is often more valuable than raw telemetry: it is already a list of discrete events with a device, a metric, a value, and a trigger/clear state — the natural shape of a work order.
The alert event log, newest first. This is the endpoint to poll for CMMS work-order creation.
Query parameters
| Parameter | Type | Default | Description |
|---|---|---|---|
q | string | — | Substring match against device ID, sensor name, or metric. |
limit | integer | 100 | Page size. |
offset | integer | 0 | Rows to skip, for paging. |
curl -s "$GATEWAY/api/alerts/history?limit=50" \
-H "Authorization: Bearer $TOKEN"{
"history": [
{
"id": 338,
"device_id": "00:13:a2:00:42:41:65:28",
"sensor_name": "Temperature/Humidity",
"metric": "automation",
"alert_type": "automation",
"event_type": "triggered",
"value": null,
"threshold_value": null,
"condition": "High Temperature Alarm Email",
"timestamp": 1788190592479,
"recipient_email": "travis@ncd.io",
"created_at": 1788190592000,
"sensor_type": 1
}
],
"count": 1,
"limit": 50,
"offset": 0,
"search": null
}The alert-history object
| Field | Type | Description |
|---|---|---|
id | integer | Monotonically increasing event ID. Use this as your high-water mark when polling incrementally. |
device_id | string | Sensor that caused the event. |
sensor_name | string|null | Display name at the time of the event. |
metric | string | The metric that breached — or the literal "offline" or "automation" for those event kinds. |
alert_type | string | threshold, offline, template, or automation. |
event_type | string | triggered or cleared. Both are logged — match them up to compute a duration. |
value | number|null | Reading that caused it. null for offline and automation events. |
threshold_value | number|null | The limit that was crossed. |
condition | string|null | above or below for thresholds. For an automation event this carries the automation’s name instead — a quirk worth handling. |
timestamp | integer | When the event occurred, epoch ms. |
recipient_email | string|null | Who was emailed, if anyone. |
created_at | integer | When the row was written, epoch ms. |
sensor_type | integer|null | Joined from the device record. |
Current alert-rule state — one row per rule condition, with active rules first. This is a state view (“what is wrong right now”), where alert history is an event view (“what happened”).
{
  "alerts": [
    { "id": 12, "device_id": "00:13:a2:00:42:41:65:28",
      "sensor_name": "Travis Office Temperature/Humidity",
      "metric": "temperature", "threshold_value": 30, "condition": "above",
      "swing_value": 1.0, "recipient_email": null,
      "alert_active": true, "enabled": true, "created_at": 1780499419019 }
  ],
  "count": 1
}
An empty fleet returns {"alerts":[],"count":0}.
Threshold rules scoped to one sensor, including live alert_active state and the email recipients attached to each rule.
{
  "device_id": "00:13:a2:00:42:41:65:28",
  "thresholds": [
    { "id": 12, "device_id": "00:13:a2:00:42:41:65:28", "metric": "temperature",
      "threshold_value": 30, "condition": "above", "enabled": true,
      "swing_value": 1.0, "alert_active": false,
      "last_alert_time": null, "created_at": 1780499419019,
      "recipient_email": "maintenance@example.com" }
  ]
}Creates or replaces a simple threshold on one metric.
Request body
| Field | Type | Required | Description |
|---|---|---|---|
metric | string | Yes | Metric to watch. |
threshold_value | number | Yes | The limit. |
condition | string | Yes | above or below. Any other value returns 400. |
swing_value | number | No | Hysteresis band, default 1.0. Must be ≥ 0. Prevents an alert flapping on a value hovering at the limit. |
enabled | boolean | No | Defaults to true. |
recipient_email | string | No | Notification recipient. |
Deletes an alert rule by ID. Despite the legacy path name, :threshold_id is an alert-rule ID — the id from GET /api/alerts. Returns {"ok":true,"deleted_id":n}.
Alert templates
A template applies one threshold rule to every sensor matching a pattern — all sensors of a type, or everything in a location or asset group — instead of configuring each device individually. Newly discovered matching sensors inherit it automatically.
All templates, each annotated with matched_device_count so you can see the blast radius before changing one.
{
  "templates": [
    { "id": 3, "name": "Cold room over-temp",
      "match_type": "location", "match_value": "Cold Room A",
      "metric": "temperature", "threshold_value": 8, "condition": "above",
      "swing_value": 0.5, "recipient_email": "ops@example.com",
      "enabled": true, "matched_device_count": 12,
      "created_at": 1780499419019, "updated_at": 1788190592479 }
  ],
  "count": 1
}Previews which devices a match rule would cover, without creating anything. Call this before POSTing a template.
| Parameter | Type | Default | Description |
|---|---|---|---|
match_type | string | all | all, sensor_type, location, or asset. |
match_value | string | — | The value to match. Ignored when match_type is all. |
curl -s "$GATEWAY/api/alert-templates/match-preview?match_type=location&match_value=Cold%20Room%20A" \
  -H "Authorization: Bearer $TOKEN"
Returns {"devices":[{device_id, sensor_name, sensor_type, display_name, location, asset}], "count":n}.
Creates a template. Requires name, match_type, metric, and threshold_value; match_value is required unless match_type is all. condition defaults to above, swing_value to 1.0. Returns 201.
Partial update — send only the fields you want changed.
Deletes a template. Returns {"ok":true,"deleted_id":n}.
11. Triggers and Automations
Triggers and automations are the modern, fully manageable alerting path. A trigger is a named condition on one sensor metric. An automation combines one or more triggers with one or more actions. This is the pair to use when your integration needs to create alerting that the customer can also see and edit in the web interface.
All triggers, each enriched with the sensor’s display name and its current live value for that metric — so one call tells you both the rule and how close it is to firing.
| Parameter | Type | Description |
|---|---|---|
device_id | string | Restrict to one sensor. |
{
  "triggers": [
    { "id": 14, "name": "High Temperature Alarm",
      "device_id": "00:13:a2:00:42:41:65:28", "metric": "temperature",
      "threshold_value": 23.888424038887024, "condition": "above",
      "swing_value": 1, "condition_met": true, "enabled": true,
      "sensor_display_name": "Travis Office Temperature/Humidity",
      "current_value": 25.2,
      "created_at": 1780499419019, "updated_at": 1788190592479 }
  ],
  "count": 1
}
condition_met is the live evaluated state, including hysteresis — not a recomputation of current_value against threshold_value. Trust condition_met.
Creates a trigger. Requires name, device_id, metric, and threshold_value. condition defaults to above (any value other than below becomes above), swing_value to 1.0. Returns 201.
{
  "name": "Bearing over-temp",
  "device_id": "00:13:a2:00:42:41:65:28",
  "metric": "temperature",
  "threshold_value": 85,
  "condition": "above",
  "swing_value": 2
}Partial update of name, threshold_value, condition, swing_value, or enabled. Note that device_id and metric cannot be changed — delete and recreate to re-point a trigger.
Deletes a trigger.
All automations with their triggers and actions nested inline — a complete picture of the customer’s alerting logic in one call.
{
  "automations": [
    {
      "id": 13,
      "name": "High Temperature Alarm Email",
      "logic": "AND",
      "enabled": true,
      "active": true,
      "last_triggered_time": 1788190592479,
      "created_at": 1780499419019,
      "updated_at": 1788190592479,
      "triggers": [
        { "id": 14, "name": "High Temperature Alarm",
          "device_id": "00:13:a2:00:42:41:65:28", "metric": "temperature",
          "threshold_value": 23.888424038887024, "condition": "above",
          "swing_value": 1, "condition_met": true,
          "sensor_display_name": "Travis Office Temperature/Humidity" }
      ],
      "actions": [
        { "id": 13, "action_type": "email",
          "config": { "recipients": "travis@ncd.io", "subject": "", "body": "" },
          "enabled": true, "fires_on": "trigger" }
      ]
    }
  ]
}| Field | Description |
|---|---|
logic | How multiple triggers combine. Currently always AND — every trigger must be met. |
active | Whether the automation is currently in its triggered state. |
enabled | Whether it is being evaluated at all. |
actions[].action_type | email or relay_command. There is no HTTP or webhook action type. |
actions[].fires_on | trigger, clear, or both — which edge runs the action. |
Creates an automation from existing triggers. Requires name, a non-empty trigger_ids array, and a non-empty actions array. Returns 201 with the new id.
{
  "name": "Bearing over-temp → maintenance",
  "trigger_ids": [14],
  "actions": [
    { "action_type": "email",
      "config": { "recipients": "maintenance@example.com",
                  "subject": "Bearing over-temperature",
                  "body": "" },
      "fires_on": "trigger" }
  ]
}Updates an automation. Supplying trigger_ids or actions replaces the existing sets rather than adding to them.
Deletes an automation. Its triggers survive and can be reused.
12. Event Bus
The inter-app event bus lets installed Atrium apps publish events and expose actions, which an operator wires together on the Automations page. Most external integrations will not need it — but two of its read endpoints are genuinely useful as a diagnostic feed.
How it works, briefly
The bus is level-triggered. Producers publish the current state of an entity rather than an edge event, the broker retains the last value per topic and entity, and a binding fires only when its match result changes. The practical consequence for you: a value you read from /api/bus/state is the current truth, not a transient you might have missed.
The retained current value for every (topic, entity) pair — “what does the bus believe right now”. Filter with topic, source, or a free-text q.
{
  "state": [
    { "topic": "atrium/alert", "entity_key": "00:13:a2:00:42:41:65:28:temperature",
      "source": "atrium", "seq": 8814, "ts": 1788190592479,
      "payload": { "kind": "threshold", "state": "triggered", "active": true,
                   "device_id": "00:13:a2:00:42:41:65:28",
                   "metric": "temperature", "value": 25.2, "threshold": 23.88,
                   "condition": "above" } }
  ],
  "count": 1
}The recent event log, newest first. Roughly a week of traffic is retained.
| Parameter | Type | Default | Description |
|---|---|---|---|
topic | string | — | Exact topic match, e.g. atrium/alert. |
source | string | — | Publishing source — atrium or an app ID. |
entity_key | string | — | Exact entity match. |
since | integer | — | Epoch-ms floor on ts. Use the gateway’s clock, from /api/system/time. |
q | string | — | Free-text contains across topic, entity, and payload. |
limit | integer | 100 | Capped at 500. |
Each event carries seq, topic, entity_key, source, a parsed payload object, ts, origin, and delivered.
Everything wireable on this gateway: sources, publishable events with their payload schemas, and invocable actions. This is how you discover what the installed apps expose without reading their manifests.
Configured event→action bindings. Filter by source_topic or target_app.
One binding, plus its per-entity match state and its 50 most recent dispatch runs — the first place to look when a customer says an automation “didn’t fire”.
Creates a binding. Requires name, a source_topic of the form <source>/<name>, and target_kind of app or email; app additionally requires target_app and target_action. fires_on is enter, exit, or both (default). match, params, and clear_params are JSON. Returns 201 with the created binding.
Partial update. Re-enabling or re-pointing a binding also clears its failure counter and circuit breaker.
Deletes a binding; its state and run history cascade away with it.
Dispatch history across all bindings. Filter by binding_id, ok (true/false), edge (enter/exit/manual), since, and free-text q; limit defaults to 100, capped at 500.
Publishes a diagnostic event into the atrium namespace. Body is {"topic":"my-event","key":"entity-1","payload":{…}}; topic must be an unqualified name and is published as atrium/<topic>.
This lets an external system inject an event that the customer can then wire to an Atrium action — the one place the API can push into gateway logic. Delivery is asynchronous, handled by the daemon within about a second.
Broker counters plus which declared actions are actually bound. The answer to “why is my binding reporting action not available“.
Dispatches a binding immediately against its current retained state, bypassing the circuit breaker — an end-to-end wiring test. Body may set {"edge":"exit"}; the default is enter.
13. Gateway Configuration and System
Read the gateway’s identity and settings, manage user accounts, and drive firmware updates.
The full configuration as a flat key/value object. Call this first in any integration — it tells you the platform version and hardware model, which determine which endpoints exist.
{
  "gateway_name": "Gateway-D8FC",
  "platform_version": "2.5.3",
  "gateway_model": "EG5120",
  "display_timezone": "America/Chicago",
  "data_retention_days": "30",
  "temperature_unit": "C",
  "dashboard_refresh_interval": "30",
  "new_sensor_handling": "whitelist",
  "default_home_page": "/sensors",
  "remote_access_enabled": true,
  "remote_access_provisioned": true,
  "remote_access_hostname": "d8fc.iolight.com",
  "nodered_enabled": false,
  "proxy_enabled": false,
  "proxy_scheme": "http",
  "proxy_auth_type": "none"
}
Keys worth knowing
| Key | Type | Description |
|---|---|---|
gateway_name | string | Display name. Also substituted into MQTT topic paths as {gateway_id}. |
platform_version | string | Atrium version, e.g. 2.5.3. Gate your feature use on this. |
gateway_model | string | EG5120 or EG5100. The EG5100 has no cellular modem and hides Remote Access. |
data_retention_days | string | How long telemetry is kept before nightly deletion. Your integration must poll often enough to stay inside this window, or you will lose data permanently. |
temperature_unit | string | C or F. A display preference only — the API always returns native units. |
display_timezone | string | IANA zone for the UI and reports. The API always returns UTC. |
remote_access_enabled | boolean | Whether the tunnel is intended to be up. |
remote_access_provisioned | boolean | Whether this unit actually has a tunnel provisioned. If enabled is true but this is false, remote access will never come up. |
remote_access_hostname | string|null | The public hostname, with no scheme. Prefix with https://. |
Writes the settings keys. gateway_name is required on every call; omitting it returns 400.
Toggling remote_access_enabled starts or stops the tunnel immediately. If the unit was never provisioned, the response includes a warning and the setting is stored but has no effect.
Admin username plus viewer-account state. Admin only — a viewer token gets 403 {"error":"Admin access required"}.
{
  "admin_username": "ncdio",
  "viewer": { "exists": true, "username": "integrations",
              "enabled": true, "allowed_pages": ["/sensors","/monitor"] }
}Creates or updates the single viewer account — the recommended way to provision a dedicated login for an integration. Admin only.
{
  "username": "integrations",
  "password": "a-strong-unique-password",
  "enabled": true,
  "allowed_pages": ["/sensors", "/monitor"]
}- A blank
passwordpreserves the existing one, so you can change grants without knowing it. - A password is required when creating the account for the first time.
- The viewer username must differ from the admin’s.
- Setting
enabled: falseimmediately invalidates that account’s active tokens.
Removes the viewer account and its sessions. Admin only.
Firmware updates
Atrium updates itself over the air from NCD’s public release repository. These endpoints drive that process; all four are on atrium-api.
Queries the release repository and caches the result. Returns {"ok":true,"update_available":bool,"available_version":string|null}. A transient network failure still returns 200 with ok:false and an error string, so branch on ok rather than on the status code.
Applies the update found by the last check. Returns immediately with {"ok":true,"status":"running"}; the work happens in the background. 400 if no update is pending.
Installs a specific version regardless of what the check found. Body is {"version":"2.5.3"}; required. Returns 404 if no such release or package exists.
Poll this during an update. Returns {step, message, percent, status, timestamp}, with status of idle, running, or error. When nothing is running you get {"step":"none","status":"idle","percent":0}.
Sensor library
The decoder library that turns radio packets into named metrics is versioned separately from the platform and can be updated without a full firmware update.
Returns {package, installed_version, latest_version, update_available, last_checked, updating, progress}.
Queries the npm registry for the newest published version and caches it. Like the firmware check, registry failures return 200 with ok:false.
Installs a version — {"version":"2.0.4"}, or the cached latest if omitted — then restarts the ingest daemon. Returns 409 if an update is already running, 400 for a malformed version or when nothing is cached.
Because this restarts the daemon, the radio stops briefly and radio-coupled endpoints will fail for a few seconds.
Progress of an in-flight library update, in the same shape as the firmware progress endpoint.
Email and outbound proxy
Sends a single test email using credentials supplied in the body, without saving them. Returns 200 on success; 400 for a validation failure and 500 for a send failure, with a stage field indicating where it went wrong.
Outbound HTTP proxy settings, for gateways behind a corporate proxy. Secrets are never returned — instead you get has_password, has_client_cert, has_client_key, and has_ca_cert booleans.
Saves proxy settings. When proxy_enabled is true, proxy_host is required and proxy_port must be 1–65535. Any supplied PEM material is validated before it is persisted. Supports none, basic, and digest authentication, plus client certificates.
Tests a proxy configuration before committing it, optionally against your own test_url. Returns the observed HTTP status and a stage on failure.
Node-RED
Node-RED ships installed but dormant. A customer can enable it to run their own flows against the gateway’s raw-frame TCP feed on port 2101. It is never in the /api path and never owns the radio.
Returns {enabled, running, registered, status}, separating the user’s intent (enabled) from live process state.
Body {"enabled": true|false}. Starts or removes the process and persists the choice across reboots. Once running, the Node-RED editor is on port 1880.
14. Network Configuration
Atrium manages the gateway’s own WAN, LAN, WiFi, cellular, and NTP settings. These endpoints exist so the customer never has to visit the underlying router dashboard.
The commit-confirm pattern
-
1
Apply the changePOST to
/api/network/ipv4,/api/network/lan, or/api/network/wifi. The gateway applies it and arms a rollback timer. -
2
Re-establish contactReach the gateway again at its new address. If you cannot, do nothing — the watchdog reverts the change on its own.
-
3
ConfirmPOST
/api/network/confirmto make the change permanent. Miss the window and the gateway returns to its previous configuration.
Complete network state — interfaces, addresses, cellular, NTP, and the available timezone list. Read-only and always safe.
On a gateway that cannot report (helper not installed) it returns 200 with {"ok":true,"available":false,"code":"helper_missing"} rather than an error, so treat available as the gate. On an EG5100, cellular is null and cellular_supported is false — that is the hardware fact, not a missing configuration.
Confirms a pending network change, cancelling the rollback. Returns {"ok":true,"confirmed":true}. Takes no body.
Sets the IPv4 configuration of one interface. Requires target (wifi or ethernet) and connection_type (dhcp or manual); a manual configuration also takes address, gateway, dns1, and dns2. Arms the watchdog.
Sets the LAN address and DHCP server pool: address, dhcp_enable, pool_start, pool_end, dns1, dns2, lease_time. Subnet and pool arithmetic is validated before anything is applied. Always requires the watchdog.
Current WiFi mode, SSID, link state, IP, and the reason for any previous rollback. Also reports watchdog — if false, a client-mode switch will be refused.
Scans for visible networks and returns {"ok":true,"networks":[…]}. Takes up to 30 seconds — set your client timeout accordingly.
Switches WiFi mode. Requires mode of ap or client; client mode also takes ssid, password, security, hidden, and bssid. A client switch requires the watchdog, so a wrong password reverts to the access point instead of stranding the unit.
Configures the cellular modem: primary_sim (sim1/sim2), apn, username, password, auth_type (none/chap/pap), and optional extra_at_cmd. A username is required when authentication is CHAP or PAP.
EG5120 only. On an EG5100 this returns 403 with {"code":"unsupported_hardware"} — enforced server-side, not merely hidden in the UI.
Sets time synchronization: primary_server, optional secondary_server, and timezone. Servers must be a hostname or IPv4 address.
15. Radio, Mesh and Sensor Configuration
These endpoints reach the DigiMesh radio itself. They live on the ingest daemon because only that process owns the serial port — and unlike a database read, they have physical consequences.
The configuration schema for a sensor type — every option, its valid range, and its meaning. Call this before attempting to write a sensor configuration, so you send only fields the hardware accepts.
| Parameter | Type | Default | Description |
|---|---|---|---|
:type | integer | — | Path parameter: the numeric sensor type. |
firmware | integer | 1 | Firmware revision, since options vary by revision. |
Returns 400 with an error string for a type the sensor library does not recognize.
One sensor’s configuration: reported_configs (what the sensor last told us), desired_configs (what is queued for it), plus report_interval_info explaining the expected cadence and diagnostics for read-only counters. A device that has never checked in returns {"reported_configs":{},"desired_configs":{}}.
Diagnostic values arrive on the sensor’s check-in packet rather than with telemetry, so they refresh on the sync interval (default one hour). Present them as “as of last check-in”, not as live values.
Queues a configuration change. The body is an array, not an object: [{"addr":"<device_id>","configs":{…},"type":<sensor_type>}].
The whole mesh as {nodes, edges, routes} — a graph you can render directly. Nodes carry a role of gateway, repeater, or sensor plus their hop depth; edges carry link-test results including retry counts and min/max/average RSSI. A pure database read, safe to poll.
The stored route for one sensor: status, route array, hop_count, and timing. Returns {"exists":false,"device_id":"…"} if no mapping has ever been requested.
Queues a route-discovery request. Returns {"success":true,"device_id":"…","status":"pending"}. Poll the GET above for the result.
Flags a one-shot raw vibration capture, transmitted on the sensor’s next check-in. Body may set {"probe":"1"}. Returns {"success":true,"device_id":"…","probe":"1","status":"pending"}.
Runs spectral analysis on a stored capture and returns the computed spectrum. No radio involved — it processes data already on the gateway — but it is CPU-intensive Python. On an EG5100 (single core, no swap) expect it to be slow and avoid running several at once. Returns 503 if the analysis subsystem is unavailable.
DigiMesh peer registry
Non-sensor radio hardware — relay controllers and similar — that the operator has authorized apps to command. Deliberately separate from the sensor inventory. Requires platform 2.5.0 or newer.
Registered peers as an array of {address, name, notes, enabled, created_at, updated_at}.
Registers a peer. address is required — a 64-bit DigiMesh MAC. Upper case and unseparated hex are accepted and normalized to lower-case colon form. Returns 201, or 409 if already registered, or 400 for a malformed address.
Updates name, notes, or enabled. 404 if unknown.
Removes a peer, revoking app authority to command it.
16. Monitor Views and Widgets
The Monitor page is a per-user dashboard of tabs (views) containing widgets. These endpoints exist mainly so you can provision dashboards programmatically — handy when commissioning many gateways to a house standard.
The caller’s views, ordered by position. A user with none gets a default “Dashboard” view created automatically, so this never returns an empty array.
Creates a view. name is required; position defaults to the end of the tab strip.
Renames or reorders a view via name and position.
Deletes a view and all its widgets. A user must always keep at least one view, so deleting the last returns 400.
The caller’s widgets, with config parsed into an object. Pass view_id to scope to one tab.
Creates a widget. widget_type is required and must be one of:
line_graph   metric_card   bar_chart   gauge   area_chart
sparkline    stat_card     table       tank_level
width is clamped to 1–4 (default 2) and height to 1–6 (default 2). config must be an object. If view_id is omitted the widget lands in the caller’s default view; a view_id the caller does not own returns 403.
Partial update. Setting view_id moves the widget to another of the caller’s views.
Deletes a widget.
17. Scheduled Reports and Saved Queries
Atrium can generate PDF reports on a schedule and email them. If your requirement is “a summary in someone’s inbox every Monday”, this is cheaper to set up than building it in your own system.
All configured reports, with config parsed and last_sent populated.
Creates a report. name, report_type, schedule, and recipient_email are required.
| Field | Accepted values |
|---|---|
report_type | fleet_summary, sensor_group, alert_digest, oee_summary, custom_query, productivity_summary |
schedule | daily, weekly, monthly |
schedule_day | Integer day-of-week or day-of-month, for weekly and monthly schedules |
schedule_hour | Hour of day, default 8 |
config | Free-form object, stored as JSON — the report type determines what it needs |
An invalid report_type or schedule returns 400 listing the accepted values. Returns 201 on success.
Partial update. Sending no updatable fields returns 400.
Deletes a report.
Generates and emails a report immediately, ignoring its schedule — useful for verifying a report before trusting it to a schedule. Returns {"success":true,"id":n}, or 404 if the report is unknown or disabled.
This runs PDF generation synchronously, so it can take a while on constrained hardware. Set a generous client timeout.
Saved queries
Named SQL snippets stored on the gateway, used by the SQL Query tool and by custom_query reports.
Returns {queries:[{id, name, sql_text, created_at}], count}.
Creates one. name and sql_text are both required. Returns 201 with the new id.
Deletes one.
18. Apps and App Center
Atrium features such as AssetPulse machine health, OEE, and productivity monitoring ship as installable apps. Each app can add its own API endpoints, which is where you look if the data you want is not in the platform surface.
Installed apps with version, enabled state, declared capabilities, model support, and license status. Also returns gateway_model and gateway_id at the top level.
{
  "apps": [
    { "id": "machine-health", "name": "AssetPulse", "version": "1.4.2",
      "description": "Vibration-based machine health monitoring",
      "enabled": true, "model_supported": true, "available": true,
      "path": "/apps/machine-health", "ui": {},
      "capabilities": ["readings:read","events:publish"],
      "license": { "required": true, "state": "licensed", "reason": null,
                   "reason_text": null, "customer": "Example Mfg",
                   "expires_at": 1820000000000 } }
  ],
  "count": 1,
  "gateway_model": "EG5120",
  "gateway_id": "0013a200424165 28"
}
available is the field to check before calling an app’s endpoints: it is true only when the app is enabled, supported on this hardware, and licensed. A license.state of unlicensed means the app’s routes return 402.
License status for one app, including the gateway ID a license must be bound to. 404 if the app is not installed.
Activates a license. Body is {"license":"<token>"} (token is accepted as an alias). The license is verified against this gateway before being saved, so a license issued for another unit is rejected with 400 and a machine-readable reason. On success both services restart.
409 means the gateway ID is not yet known because the radio has not reported in — retry shortly.
Removes a stored license and restarts services. Intended for support and testing.
Installs a signed app package uploaded as raw bytes — Content-Type: application/gzip or application/octet-stream, up to 200 MB. Optional query parameters expect_id pins the target app and allow_downgrade=1 permits installing an older version.
Uninstalls an app and restarts services. Returns {"ok":true,"id":"…","purged_data":bool,"restarting":true}. Purging also deletes the app’s database.
Enables an app. Revokes its existing scoped tokens and restarts services. 404 if not installed.
Disables an app without uninstalling it. Same token revocation and restart.
Mints a scoped token for an app’s sandboxed UI. Returns {token, expires_at, capabilities}.
The App Center catalog, annotated with what is installed and what this gateway can run. Pass refresh=1 to bypass the cache. If the catalog is unreachable you still get 200, with unavailable:true and an error string.
One catalog app in detail: all versions with their platform and model requirements, release dates, sizes, changelogs, an install_blocked_reason per version, and the README as sanitized HTML or raw markdown.
Downloads and installs an app by ID. Body is {"id":"machine-health","allow_downgrade":false}. Returns 502 if the App Center is unreachable.
Static frontend assets for an installed app’s UI. Unauthenticated, exactly as nginx would serve any static bundle — the app’s data still requires a token. Not useful to an integration; documented for completeness.
19. Direct SQL Access
Atrium exposes its SQLite database through an HTTP endpoint. It is an administrative tool that powers the built-in SQL Query page — occasionally the right escape hatch, and easy to misuse.
Lists table names: {"tables":["readings","devices",…]}.
Column definitions for one table. table is a required query parameter and must be a valid identifier; anything else returns 400. Each column reports cid, name, type, notnull, dflt_value, and pk.
Executes a statement. Body is {"query":"SELECT …"}. A SELECT returns rows; a non-returning statement executes and yields an empty rows array. A SQL error returns 400 with the engine’s message.
curl -s -X POST "$GATEWAY/api/sqlite/query" \
  -H "Authorization: Bearer $TOKEN" \
  -H 'Content-Type: application/json' \
-d '{"query":"SELECT (ts/86400000)*86400000 AS day, AVG(value) AS avg_c, MIN(value) AS min_c, MAX(value) AS max_c, COUNT(*) AS n FROM readings WHERE device_id = '\''00:13:a2:00:42:41:65:28'\'' AND metric = '\''temperature'\'' GROUP BY day ORDER BY day DESC LIMIT 30"}'{
"success": true,
"rows": [
{ "day": 1788872400000, "avg_c": 24.93, "min_c": 24.1, "max_c": 25.8, "n": 86 }
],
"count": 1,
"query": "SELECT (ts/86400000)*86400000 AS day, …"
}Tables you are most likely to want
| Table | Contents |
|---|---|
readings | All telemetry: ts, device_id, metric, value, counter, sensor_type, firmware, rssi, tags. Always filter by device_id, metric, and ts — the index is built for exactly that, and the table grows without bound. |
devices | Device registry including whitelist state and last-seen values. |
sensor_meta | Operator metadata — location, asset, name, install date. |
alert_history | Alert events, the same rows served by /api/alerts/history. |
status_history | Device health transitions. |
gateway_config | Configuration key/value pairs. |
20. MQTT Push — the Streaming Alternative
The REST API is poll-only. If you want the gateway to push data to you as it arrives, configure MQTT instead. For continuous ingestion this is almost always the better architecture.
When to choose which
| Requirement | Use |
|---|---|
| Continuously stream every reading into a historian, data lake, or message bus | MQTT |
| React to alerts promptly — open a ticket when something trips | MQTT (alerts topic) |
| Backfill history, or query a past time window | REST (telemetry endpoint) |
| Read or write configuration, metadata, and alert rules | REST |
| Your platform cannot subscribe to MQTT (many SaaS ITSM tools cannot) | REST polling |
| On-demand lookup — “what is this sensor reading right now?” | REST |
The two are not exclusive, and the most robust integrations use both: MQTT for the live stream, REST to backfill anything missed during an outage and to read metadata.
Configuring it in the interface
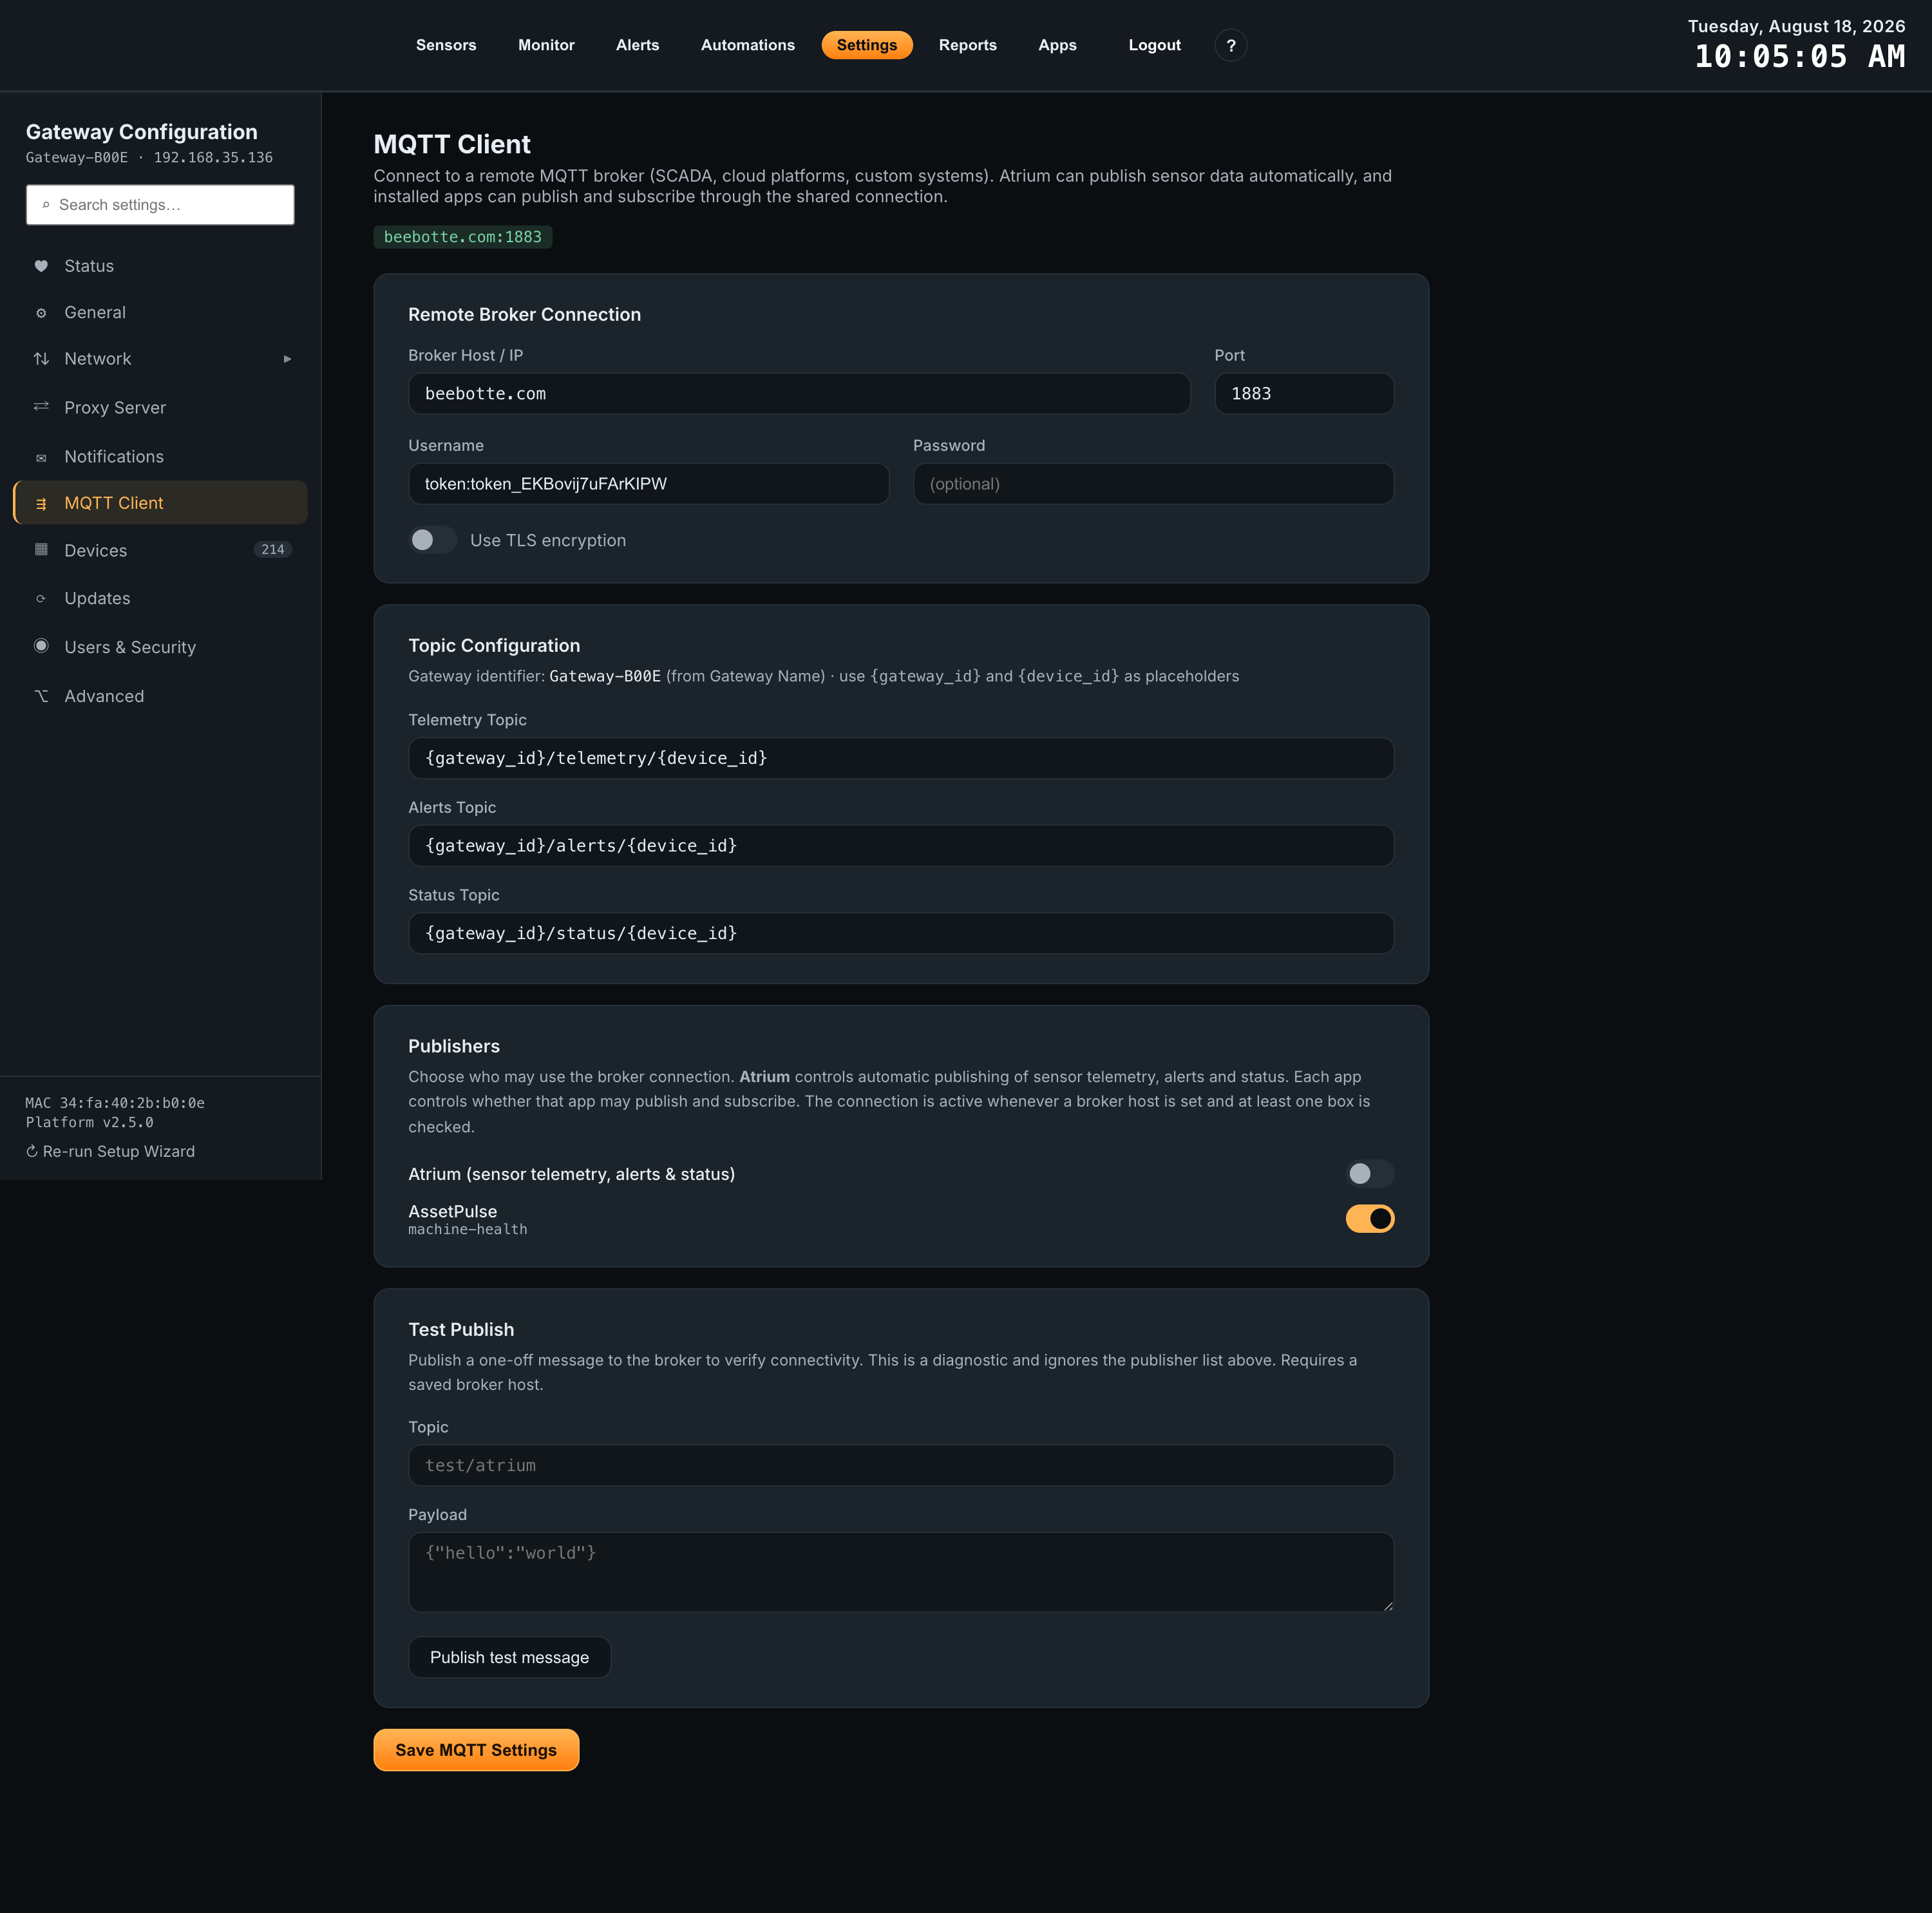
MQTT is set up under Settings → MQTT Client. It takes two steps that are easy to conflate: first point the gateway at your broker, then separately grant the Atrium publisher so sensor telemetry, alerts, and status changes are actually published.
Topics
Topic patterns are configurable. {gateway_id} is replaced with the gateway name and {device_id} with the sensor’s device ID:
| Feed | Default pattern | QoS | Retained |
|---|---|---|---|
| Telemetry | {gateway_id}/telemetry/{device_id} | 1 | No |
| Alerts | {gateway_id}/alerts/{device_id} | 1 | No |
| Status | {gateway_id}/status/{device_id} | 1 | Yes |
Status messages are retained, so a subscriber that connects late still learns each device’s current online/offline state without waiting for the next transition. Subscribe with a wildcard such as Gateway-D8FC/telemetry/# to receive every sensor.
Payloads
All three payloads are JSON, with epoch-millisecond timestamps, exactly as in the REST API.
{
  "device_id": "00:13:a2:00:42:41:65:28",
  "timestamp": 1788874772898,
  "sensor_type": 1,
  "data": { "temperature": 25.2, "humidity": 41.8 },
  "battery": 99.64,
  "rssi": 40
}
Note that data is an object of all metrics from that one packet, whereas the REST telemetry endpoint returns one row per metric. The MQTT shape is usually the more convenient of the two for ingestion.
{
  "device_id": "00:13:a2:00:42:41:65:28",
  "sensor_name": "Line 4 Feed Pump — Bearing",
  "alert_type": "threshold",
  "metric": "temperature",
  "value": 88.4,
  "threshold": 85,
  "condition": "above",
  "timestamp": 1788874772898
}
alert_type is threshold or offline; for an offline alert, metric is the literal string "offline".
{
  "device_id": "00:13:a2:00:42:41:65:28",
  "old_status": "healthy",
  "new_status": "offline",
  "reason": "no report within 2x interval",
  "timestamp": 1788874772898
}
Security
The broker connection supports username/password authentication, TLS, broker-certificate verification with an uploaded CA, and mutual TLS with a client certificate. Private keys and passphrases are encrypted at rest on the gateway. Use the Test Publish tool after saving to confirm the connection before relying on it.
MQTT endpoints
Everything in the interface is also reachable over the API. All MQTT endpoints are on the ingest daemon, and all return 503 if the MQTT subsystem is unavailable.
Whether Atrium publishing is on, the resolved topic paths, and the publisher grant list. Verified live:
{
  "publishing_enabled": false,
  "topics": [
    "Article_Channel/Gateway-D8FC/telemetry/<device_id>",
    "Article_Channel/Gateway-D8FC/alerts/<device_id>",
    "Article_Channel/Gateway-D8FC/status/<device_id>"
  ],
  "publishers": [
    { "id": "atrium", "name": "Atrium (sensor telemetry, alerts & status)",
      "granted": false }
  ]
}
The resolved topics array is the quickest way to confirm exactly what to subscribe to — the placeholders are already substituted. The gateway above has a custom prefix (Article_Channel/) configured ahead of the default pattern, which is why its topics are longer than the defaults listed earlier — another reason to read the resolved list rather than assume the default.
Broker settings. The password is returned masked, never in clear text, and certificate material is reported only as has_ca_cert, has_client_cert, has_client_key booleans.
Saves broker settings and reconnects immediately. host is required and must be a valid hostname; port must be 1–65535. Topic patterns are validated. PEM material is checked before it is stored.
Submitting a blank password — or the mask returned by GET — preserves the stored password, so you can change topics without knowing the credential.
Sets the publisher grant list — the switch that actually starts the sensor-data feed. Grant atrium to enable automatic publishing.
Turns publishing on or off without discarding the broker configuration.
Publishes one message immediately, bypassing the grant list — the fastest way to prove host, port, credentials, and TLS are correct before enabling the real feed. A broker host must be saved first.
21. Worked Example: Feeding a CMMS
A concrete pattern for pulling Atrium data into a maintenance management system such as ServiceNow, Maximo, Fiix, or Limble. The specifics below are generic HTTP; adapt them to your platform’s integration framework.
Design decisions to make first
-
1
Decide what actually triggers workMost CMMS integrations do not want a firehose of temperature readings — they want events. Poll
/api/alerts/historyand create work orders from alert events; pull telemetry only for the affected sensor, as evidence attached to the record. This keeps the volume low and the mapping obvious. -
2
Establish how the gateway is reachableA cloud-hosted CMMS cannot reach a LAN address. Either enable Remote Access (Section 2) for a public HTTPS hostname, or run a small on-premises connector that polls the gateway locally and forwards to your platform. The connector approach is generally preferable: it keeps the gateway off the public internet entirely.
-
3
Map sensors to your assetsWrite your CMMS asset identifier into the sensor’s
assetfield withPOST /api/sensors/:id/meta(Section 8). Every subsequent alert and reading then carries a device ID you can resolve to an asset in one lookup, with no mapping table to maintain on your side. -
4
Create a dedicated loginProvision a viewer account for the integration rather than embedding admin credentials (Section 13). Store its password in your platform’s credential store and plan to rotate it.
The polling loop
A complete, idempotent event-ingestion loop. The high-water mark on id is what makes it safe to re-run.
import requests

GATEWAY = "https://b00e.iolight.com"     # or http://192.168.1.50 on-premises
USER, PASSWORD = "integrations", "•••"

_token = None

def login():
    """Exchange credentials for a session token."""
    global _token
    r = requests.post(f"{GATEWAY}/api/auth/login",
                      json={"username": USER, "password": PASSWORD},
                      timeout=15)
    r.raise_for_status()
    _token = r.json()["token"]
    return _token

def call(path, **params):
    """GET with automatic re-auth on 401. Tokens expire after 7 days."""
    global _token
    if _token is None:
        login()
    for attempt in (1, 2):
        r = requests.get(f"{GATEWAY}{path}",
                         headers={"Authorization": f"Bearer {_token}"},
                         params=params, timeout=30)
        if r.status_code == 401 and attempt == 1:
            login()                       # token expired — get a new one and retry
            continue
        r.raise_for_status()
        return r.json()

def poll_alerts(last_seen_id):
    """Return new alert events oldest-first, plus the new high-water mark.

    The endpoint returns newest-first and has no 'since' parameter, so we
    walk the page and stop at the first id we have already processed.
    """
    page = call("/api/alerts/history", limit=100)
    fresh = [e for e in page["history"] if e["id"] > last_seen_id]
    if not fresh:
        return [], last_seen_id
    fresh.sort(key=lambda e: e["id"])     # process in chronological order
    return fresh, fresh[-1]["id"]

def sensor_context(device_id, metric):
    """Fetch the asset mapping and recent readings to attach as evidence."""
    sensor = call(f"/api/sensors/{device_id}")
    readings = call(f"/api/sensors/{device_id}/telemetry",
                    metric=metric, limit=20)
    return sensor, readings["readings"]

# ── main loop ────────────────────────────────────────────────────────────────
last_seen_id = load_high_water_mark()     # persist this in your own store

events, last_seen_id = poll_alerts(last_seen_id)

for ev in events:
    if ev["event_type"] != "triggered":
        resolve_work_order(ev)            # a 'cleared' event — close the ticket
        continue

    sensor, readings = sensor_context(ev["device_id"], ev["metric"])

    create_work_order(
        asset_id    = sensor["asset"],            # your CMMS asset ID
        location    = sensor["location"],
        summary     = f"{sensor['name']}: {ev['metric']} {ev['condition']} "
                      f"{ev['threshold_value']} (read {ev['value']})",
        occurred_at = ev["timestamp"],            # epoch ms, UTC
        evidence    = readings,
        source_ref  = f"atrium:{ev['id']}",       # idempotency key
    )

save_high_water_mark(last_seen_id)
Notes on the pattern
- Use
source_reffor idempotency. Alert eventids are stable and unique, so keying your work orders on them makes a duplicate poll harmless. This matters more than it looks: a network timeout after a successful fetch is the normal case, not the exception. - Handle
clearedevents. Atrium logs both edges. Ignoringclearedleaves tickets open after the condition resolves; using it lets you auto-close, or at least annotate. - Do not poll faster than the sensors report. Every 5 minutes is ample for alert events. Alerts are evaluated as readings arrive, so a shorter interval buys you nothing but load.
- Persist the high-water mark outside the process. If it resets to zero, the loop replays the entire alert history — which the
source_refkey will absorb, but noisily. - Watch the retention window. If
data_retention_daysis 30 and your integration is down for 40 days, that data is gone for good. Note that retention purges alert history on the same schedule as telemetry — missed alert events are not recoverable either. Do not treat the gateway as your archive of record. - Expect update outages. A firmware update restarts the services. Retry with backoff rather than treating a run of failures as a fault.
22. Complete Endpoint Index
All 138 platform endpoints on Atrium 2.5.3, grouped by purpose. Every path is served from the same base URL; the Service column tells you which internal service answers, which matters only for interpreting errors.
| Method | Path | Service | Purpose | Details |
|---|---|---|---|---|
| Authentication | ||||
| POST | /api/auth/change-credentials | api | Change the authenticated account's username/password | § |
| POST | /api/auth/login | api | Exchange credentials for a session token | § |
| GET | /api/auth/verify | api | Validate a token and report its account | § |
| Sensors | ||||
| GET | /api/sensor-types | api | Sensor types present, with device counts | § |
| GET | /api/sensors | api | List whitelisted sensors with health and metadata | § |
| GET | /api/sensors/:id | api | One sensor by device ID | § |
| GET | /api/sensors/:id/status-history | api | Health transition history for one sensor | § |
| Telemetry | ||||
| GET | /api/sensors/:id/fft | api | Stored raw vibration captures | § |
| GET | /api/sensors/:id/fft/:fftId | api | One vibration capture | § |
| GET | /api/sensors/:id/metrics | api | Metric names this sensor reports | § |
| GET | /api/sensors/:id/telemetry | api | Readings, filterable by metric and time window | § |
| Metadata | ||||
| GET | /api/sensors/:id/chart-order | api | Preferred chart ordering | § |
| POST | /api/sensors/:id/chart-order | api | Set chart ordering | § |
| GET | /api/sensors/:id/meta | api | Operator metadata for one sensor | § |
| POST | /api/sensors/:id/meta | api | Replace operator metadata (full replace) | § |
| GET | /api/sensors/:id/metric-conversions | api | Unit-conversion formulas | § |
| POST | /api/sensors/:id/metric-conversions | api | Set unit conversions in bulk | § |
| GET | /api/sensors/:id/metric-labels | api | Custom metric display labels | § |
| POST | /api/sensors/:id/metric-labels | api | Set metric labels in bulk | § |
| GET | /api/synthetic-variables | api | List computed/synthetic metrics | § |
| POST | /api/synthetic-variables | api | Create a synthetic variable | § |
| DELETE | /api/synthetic-variables/:id | api | Delete a synthetic variable and its readings | § |
| GET | /api/synthetic-variables/:id | api | One synthetic variable | § |
| POST | /api/synthetic-variables/test | api | Dry-run a formula without saving | § |
| Devices | ||||
| GET | /api/devices | api | List devices by whitelist state (param required) | § |
| POST | /api/devices/bulk-delete | api | Delete devices and all their data (destructive) | § |
| POST | /api/devices/bulk-whitelist | api | Whitelist or un-whitelist many devices | § |
| POST | /api/purge-all-data | api | Delete all telemetry and devices (destructive) | § |
| POST | /api/sensors/:id/whitelist | api | Whitelist or un-whitelist one device | § |
| Alerts | ||||
| GET | /api/alert-templates | api | Pattern-matching alert templates | § |
| POST | /api/alert-templates | api | Create an alert template | § |
| DELETE | /api/alert-templates/:id | api | Delete an alert template | § |
| PUT | /api/alert-templates/:id | api | Update an alert template | § |
| GET | /api/alert-templates/match-preview | api | Preview which devices a match rule covers | § |
| GET | /api/alerts | api | Current alert-rule state | § |
| GET | /api/alerts/history | api | Alert event log — poll this for CMMS events | § |
| GET | /api/sensors/:id/thresholds | api | Threshold rules for one sensor | § |
| POST | /api/sensors/:id/thresholds | api | Write a threshold (see round-trip caveat) | § |
| DELETE | /api/thresholds/:threshold_id | api | Delete an alert rule by ID | § |
| Triggers | ||||
| GET | /api/automations | api | Automations with nested triggers and actions | § |
| POST | /api/automations | api | Create an automation | § |
| DELETE | /api/automations/:id | api | Delete an automation | § |
| PUT | /api/automations/:id | api | Update an automation (replaces sets) | § |
| GET | /api/triggers | api | Triggers with live values and match state | § |
| POST | /api/triggers | api | Create a trigger condition | § |
| DELETE | /api/triggers/:id | api | Delete a trigger | § |
| PUT | /api/triggers/:id | api | Update a trigger | § |
| Event bus | ||||
| GET | /api/bus/bindings | api | Configured event to action bindings | § |
| POST | /api/bus/bindings | api | Create a binding | § |
| DELETE | /api/bus/bindings/:id | api | Delete a binding | § |
| GET | /api/bus/bindings/:id | api | One binding with state and recent runs | § |
| PATCH | /api/bus/bindings/:id | api | Update a binding | § |
| POST | /api/bus/bindings/:id/run | ingest | Dispatch a binding now (real side effects) | § |
| GET | /api/bus/catalog | api | Wireable events and actions on this gateway | § |
| GET | /api/bus/events | api | Recent event log | § |
| POST | /api/bus/publish | api | Publish a diagnostic event into the atrium namespace | § |
| GET | /api/bus/runs | api | Binding dispatch history | § |
| GET | /api/bus/state | api | Retained current value per topic and entity | § |
| GET | /api/bus/status | ingest | Broker counters and bound actions | § |
| Gateway | ||||
| GET | /api/gateway/config | api | Full configuration — call this first | § |
| POST | /api/gateway/config | api | Write configuration (unsent keys are reset) | § |
| GET | /api/gateway/proxy | api | Outbound proxy settings (secrets masked) | § |
| POST | /api/gateway/proxy | api | Save outbound proxy settings | § |
| POST | /api/gateway/proxy-test | api | Test a proxy configuration | § |
| POST | /api/gateway/smtp-test | ingest | Send a test email with supplied credentials | § |
| POST | /api/system/check-updates | api | Check for a firmware update | § |
| POST | /api/system/execute-update | api | Apply the pending firmware update | § |
| POST | /api/system/force-update | api | Install a specific version | § |
| GET | /api/system/nodered | api | Node-RED intent and process state | § |
| POST | /api/system/nodered | api | Enable or disable Node-RED | § |
| GET | /api/system/sensor-library | api | Sensor decoder library version state | § |
| POST | /api/system/sensor-library/check | api | Check for a newer decoder library | § |
| POST | /api/system/sensor-library/update | api | Install a decoder library version | § |
| GET | /api/system/sensor-library/update-progress | api | Library update progress | § |
| GET | /api/system/time | api | Gateway clock, for skew detection | § |
| GET | /api/system/update-progress | api | Firmware update progress | § |
| GET | /api/users | api | Admin and viewer account state (admin only) | § |
| DELETE | /api/users/viewer | api | Delete the viewer account (admin only) | § |
| POST | /api/users/viewer | api | Create or update the viewer account (admin only) | § |
| Network | ||||
| POST | /api/network/cellular | api | Configure the cellular modem (EG5120 only) | § |
| POST | /api/network/confirm | api | Confirm a pending change, cancelling rollback | § |
| POST | /api/network/ipv4 | api | Set interface IPv4 (arms watchdog) | § |
| POST | /api/network/lan | api | Set LAN address and DHCP pool (arms watchdog) | § |
| POST | /api/network/ntp | api | Set NTP servers and timezone | § |
| GET | /api/network/status | api | Full network state (read-only, safe) | § |
| POST | /api/network/wifi | api | Switch WiFi AP/client mode (arms watchdog) | § |
| GET | /api/network/wifi/scan | api | Scan for visible networks (slow, up to 30s) | § |
| GET | /api/network/wifi/status | api | WiFi mode, SSID, link and rollback reason | § |
| Radio | ||||
| GET | /api/digimesh-peers | api | Registered non-sensor radio peers | § |
| POST | /api/digimesh-peers | api | Register a radio peer | § |
| DELETE | /api/digimesh-peers/:address | api | Remove a radio peer | § |
| PUT | /api/digimesh-peers/:address | api | Update a radio peer | § |
| GET | /api/mesh-topology | api | Whole mesh as nodes, edges and routes | § |
| POST | /api/sensors/:id/fft/:fftId/analyze | ingest | Compute a spectrum from a stored capture | § |
| GET | /api/sensors/:id/mesh-map | api | Stored route for one sensor | § |
| POST | /api/sensors/:id/mesh-map | ingest | Queue a route-discovery request | § |
| POST | /api/sensors/:id/request-fft | ingest | Queue a raw vibration capture | § |
| GET | /api/sensors/:id/sensor-config | ingest | Reported and desired sensor configuration | § |
| POST | /api/sensors/:id/sensor-config | ingest | Queue a sensor configuration change | § |
| GET | /api/sensors/config-options/:type | ingest | Configuration schema for a sensor type | § |
| Monitor | ||||
| GET | /api/dashboard/views | api | Caller's dashboard views | § |
| POST | /api/dashboard/views | api | Create a view | § |
| DELETE | /api/dashboard/views/:id | api | Delete a view and its widgets | § |
| PUT | /api/dashboard/views/:id | api | Rename or reorder a view | § |
| GET | /api/dashboard/widgets | api | Caller's widgets, optionally by view | § |
| POST | /api/dashboard/widgets | api | Create a widget | § |
| DELETE | /api/dashboard/widgets/:id | api | Delete a widget | § |
| PUT | /api/dashboard/widgets/:id | api | Update or move a widget | § |
| Reports | ||||
| GET | /api/saved-queries | api | Saved SQL snippets | § |
| POST | /api/saved-queries | api | Create a saved query | § |
| DELETE | /api/saved-queries/:id | api | Delete a saved query | § |
| GET | /api/scheduled-reports | api | Configured scheduled reports | § |
| POST | /api/scheduled-reports | api | Create a scheduled report | § |
| DELETE | /api/scheduled-reports/:id | api | Delete a scheduled report | § |
| PUT | /api/scheduled-reports/:id | api | Update a scheduled report | § |
| POST | /api/scheduled-reports/:id/send-now | ingest | Generate and email a report immediately | § |
| Apps | ||||
| GET | /api/apps | api | Installed apps with license and model state | § |
| POST | /api/apps/:id/disable | api | Disable an app | § |
| POST | /api/apps/:id/enable | api | Enable an app | § |
| DELETE | /api/apps/:id/license | api | Remove a stored license | § |
| GET | /api/apps/:id/license | api | License status for one app | § |
| POST | /api/apps/:id/license | api | Activate a license | § |
| POST | /api/apps/:id/token | api | Mint an app-scoped token (not an API key) | § |
| POST | /api/apps/:id/uninstall | api | Uninstall an app | § |
| GET | /api/apps/catalog | api | App Center catalog | § |
| GET | /api/apps/catalog/:id | api | One catalog app, all versions and README | § |
| POST | /api/apps/install | api | Install an uploaded app package | § |
| POST | /api/apps/install-from-catalog | api | Install an app from the catalog | § |
| GET | /app-ui/:appId/* | api | App UI static assets (no auth) | § |
| Direct SQL | ||||
| POST | /api/sqlite/query | api | Execute arbitrary SQL (use with care) | § |
| GET | /api/sqlite/schema | api | Column definitions for one table | § |
| GET | /api/sqlite/tables | api | List database tables | § |
| MQTT | ||||
| GET | /api/mqtt/config | ingest | Broker settings (password masked) | § |
| POST | /api/mqtt/config | ingest | Save broker settings and reconnect | § |
| POST | /api/mqtt/publishers | ingest | Set the publisher grant list | § |
| GET | /api/mqtt/status | ingest | Publishing state and resolved topics | § |
| POST | /api/mqtt/test-publish | ingest | Publish one test message, bypassing grants | § |
| POST | /api/mqtt/toggle | ingest | Turn publishing on or off | § |
23. Limits, Gotchas and Known Issues
Collected here so you can scan them before writing code rather than discovering them in production. Each of these has caught a real integrator.
Design constraints
| Constraint | What it means for you |
|---|---|
| Tokens expire after 7 days | Not extended by use. Handle 401 by re-authenticating and retrying. There is no refresh-token flow and no non-expiring API key. |
| No webhooks or websockets | The gateway never calls you over HTTP. Poll, or use MQTT for push. Alert actions are limited to email and relay_command — there is no HTTP action type. |
| Telemetry is deleted on a retention schedule | data_retention_days (default 100, often lowered) governs a nightly purge at 03:00 gateway time that deletes readings, raw ingest rows, and alert history older than the window. Nothing older survives. The gateway is not an archive — poll often enough to stay inside the window. |
| All times are UTC epoch milliseconds | Never seconds. The display timezone and °C/°F preference affect the UI only. |
| Readings are per metric, not per packet | A sensor reporting temperature and humidity produces two rows per report. MQTT telemetry payloads, by contrast, group a packet’s metrics into one data object. |
| Values are native units | Conversions and labels are display metadata. Fetch them separately and apply them yourself if your figures must match the customer’s screen. |
| Hardware is modest | The EG5120 has 4 cores and ~2 GB RAM; the EG5100 has one core, ~1 GB, and no swap. Wide queries and tight polling loops are felt. Prefer narrow, indexed requests. |
| Result caps | /api/sensors: 5000 max. Telemetry raw: 10,000 max. Telemetry aggregated: 5000 buckets. Bus events and runs: 500 max. FFT list: 200 max. |
| Firmware gates endpoints | /api/bus/* needs 2.4.0+; /api/network/* and /api/digimesh-peers need 2.5.0+. Older firmware returns 404. Check platform_version first. |
Known issues on platform 2.5.3
Easy mistakes
- Forgetting
?whitelist=on/api/devices— the parameter is mandatory and its absence is a400, not a default. - Treating
POST /api/sensors/:id/metaas a merge — it is a full replace. Read, modify, write back. - Treating
POST /api/gateway/configas a merge — same trap, with more collateral damage: a partial POST resets SMTP, retention, timezone, and temperature unit. - Assuming raw and bucketed telemetry share an order — raw comes back newest-first, bucketed oldest-first.
- Parsing
tagsas an object — it is a JSON-encoded string, so it needs a second parse. - Reading
rssias a conventional negative dBm — Atrium reports a positive magnitude where lower is better. 40 is strong; 90 is marginal. - Expecting a
triggerto alert on its own — it needs an automation referencing it before anything happens. - Assuming an
errorstatus means a broken sensor — it also covers low battery and weak signal. Inspect the underlying fields. - Paging alert history with
offsetalone — rows shift as events arrive. Track the highestidinstead. - Expecting a radio write to take effect immediately — sensors sleep.
"status":"pending"means queued, not applied. - Creating dashboards with the integration’s account — views and widgets are per-user, so the customer will not see them.
- Renaming the gateway after wiring MQTT — it rewrites every topic path and silently orphans subscribers.
Security checklist
-
1
Change the default credentialsBefore anything else, and certainly before enabling Remote Access.
-
2
Give the integration its own accountDo not embed admin credentials in an external platform. Remember that the viewer role is a usability boundary, not a hardened permission model — the account still needs a strong, unique, rotated password.
-
3
Prefer an on-premises connector to public exposureA small local service that polls the gateway and forwards to your platform keeps the gateway off the public internet entirely. Reach for Remote Access only when that is not possible.
-
4
Use TLS on MQTTEnable TLS with certificate verification, and mutual TLS if your broker supports it. Verify with Test Publish before trusting the feed.
-
5
Keep the SQL endpoint out of production pathsIt executes arbitrary statements, including writes, and bypasses every validation rule. Use the purpose-built endpoints.