

TagoIO User Guide
Connect an Atrium gateway to a TagoIO profile. Each sensor you enable becomes its own TagoIO device, the gateway reports its readings as they arrive, and a TagoIO dashboard can change the sensor’s settings back the other way — validated on the gateway before anything reaches the radio.
01Overview
TagoIO is a cloud IoT platform. This app makes your Atrium gateway report into it. You supply two TagoIO credentials once, pick which of the gateway’s sensors should report, and from then on the gateway creates the TagoIO devices, keeps their names and tags in step with Atrium, and pushes every reading as it arrives.
The gateway acts as a multiplexer. It holds a single set of TagoIO credentials and reports on behalf of every sensor you enable, so you do not create or manage TagoIO devices by hand and there is no per-sensor credential to distribute.
02Requirements
TagoIO needs a gateway new enough to host apps that subscribe to sensor traffic and configure sensors, plus a TagoIO account you can generate two credentials in.
| Requirement | Detail |
|---|---|
| Platform version | Atrium 2.3.2 or newer. The App Center will not offer the install on an older gateway. |
| Gateway model | The app declares no model restriction. This guide was written against an EG5120. |
| License | Not required. TagoIO carries no PAID badge in the App Center and needs no license key. |
| Sensors | Any NCD wireless sensor the gateway has already set up. Readings are mapped generically from Atrium’s normalized metric names, so there is no per-sensor-type support list. |
| Network | Outbound HTTPS from the gateway to api.<region>.tago.io and http.tip.<region>.tago.io. |
| TagoIO account | A profile you can generate a profile token and a device authorization in. Regions us-e1 and eu-w1 are supported. |
03Installing
TagoIO installs from the Atrium App Center like any other app.
-
1
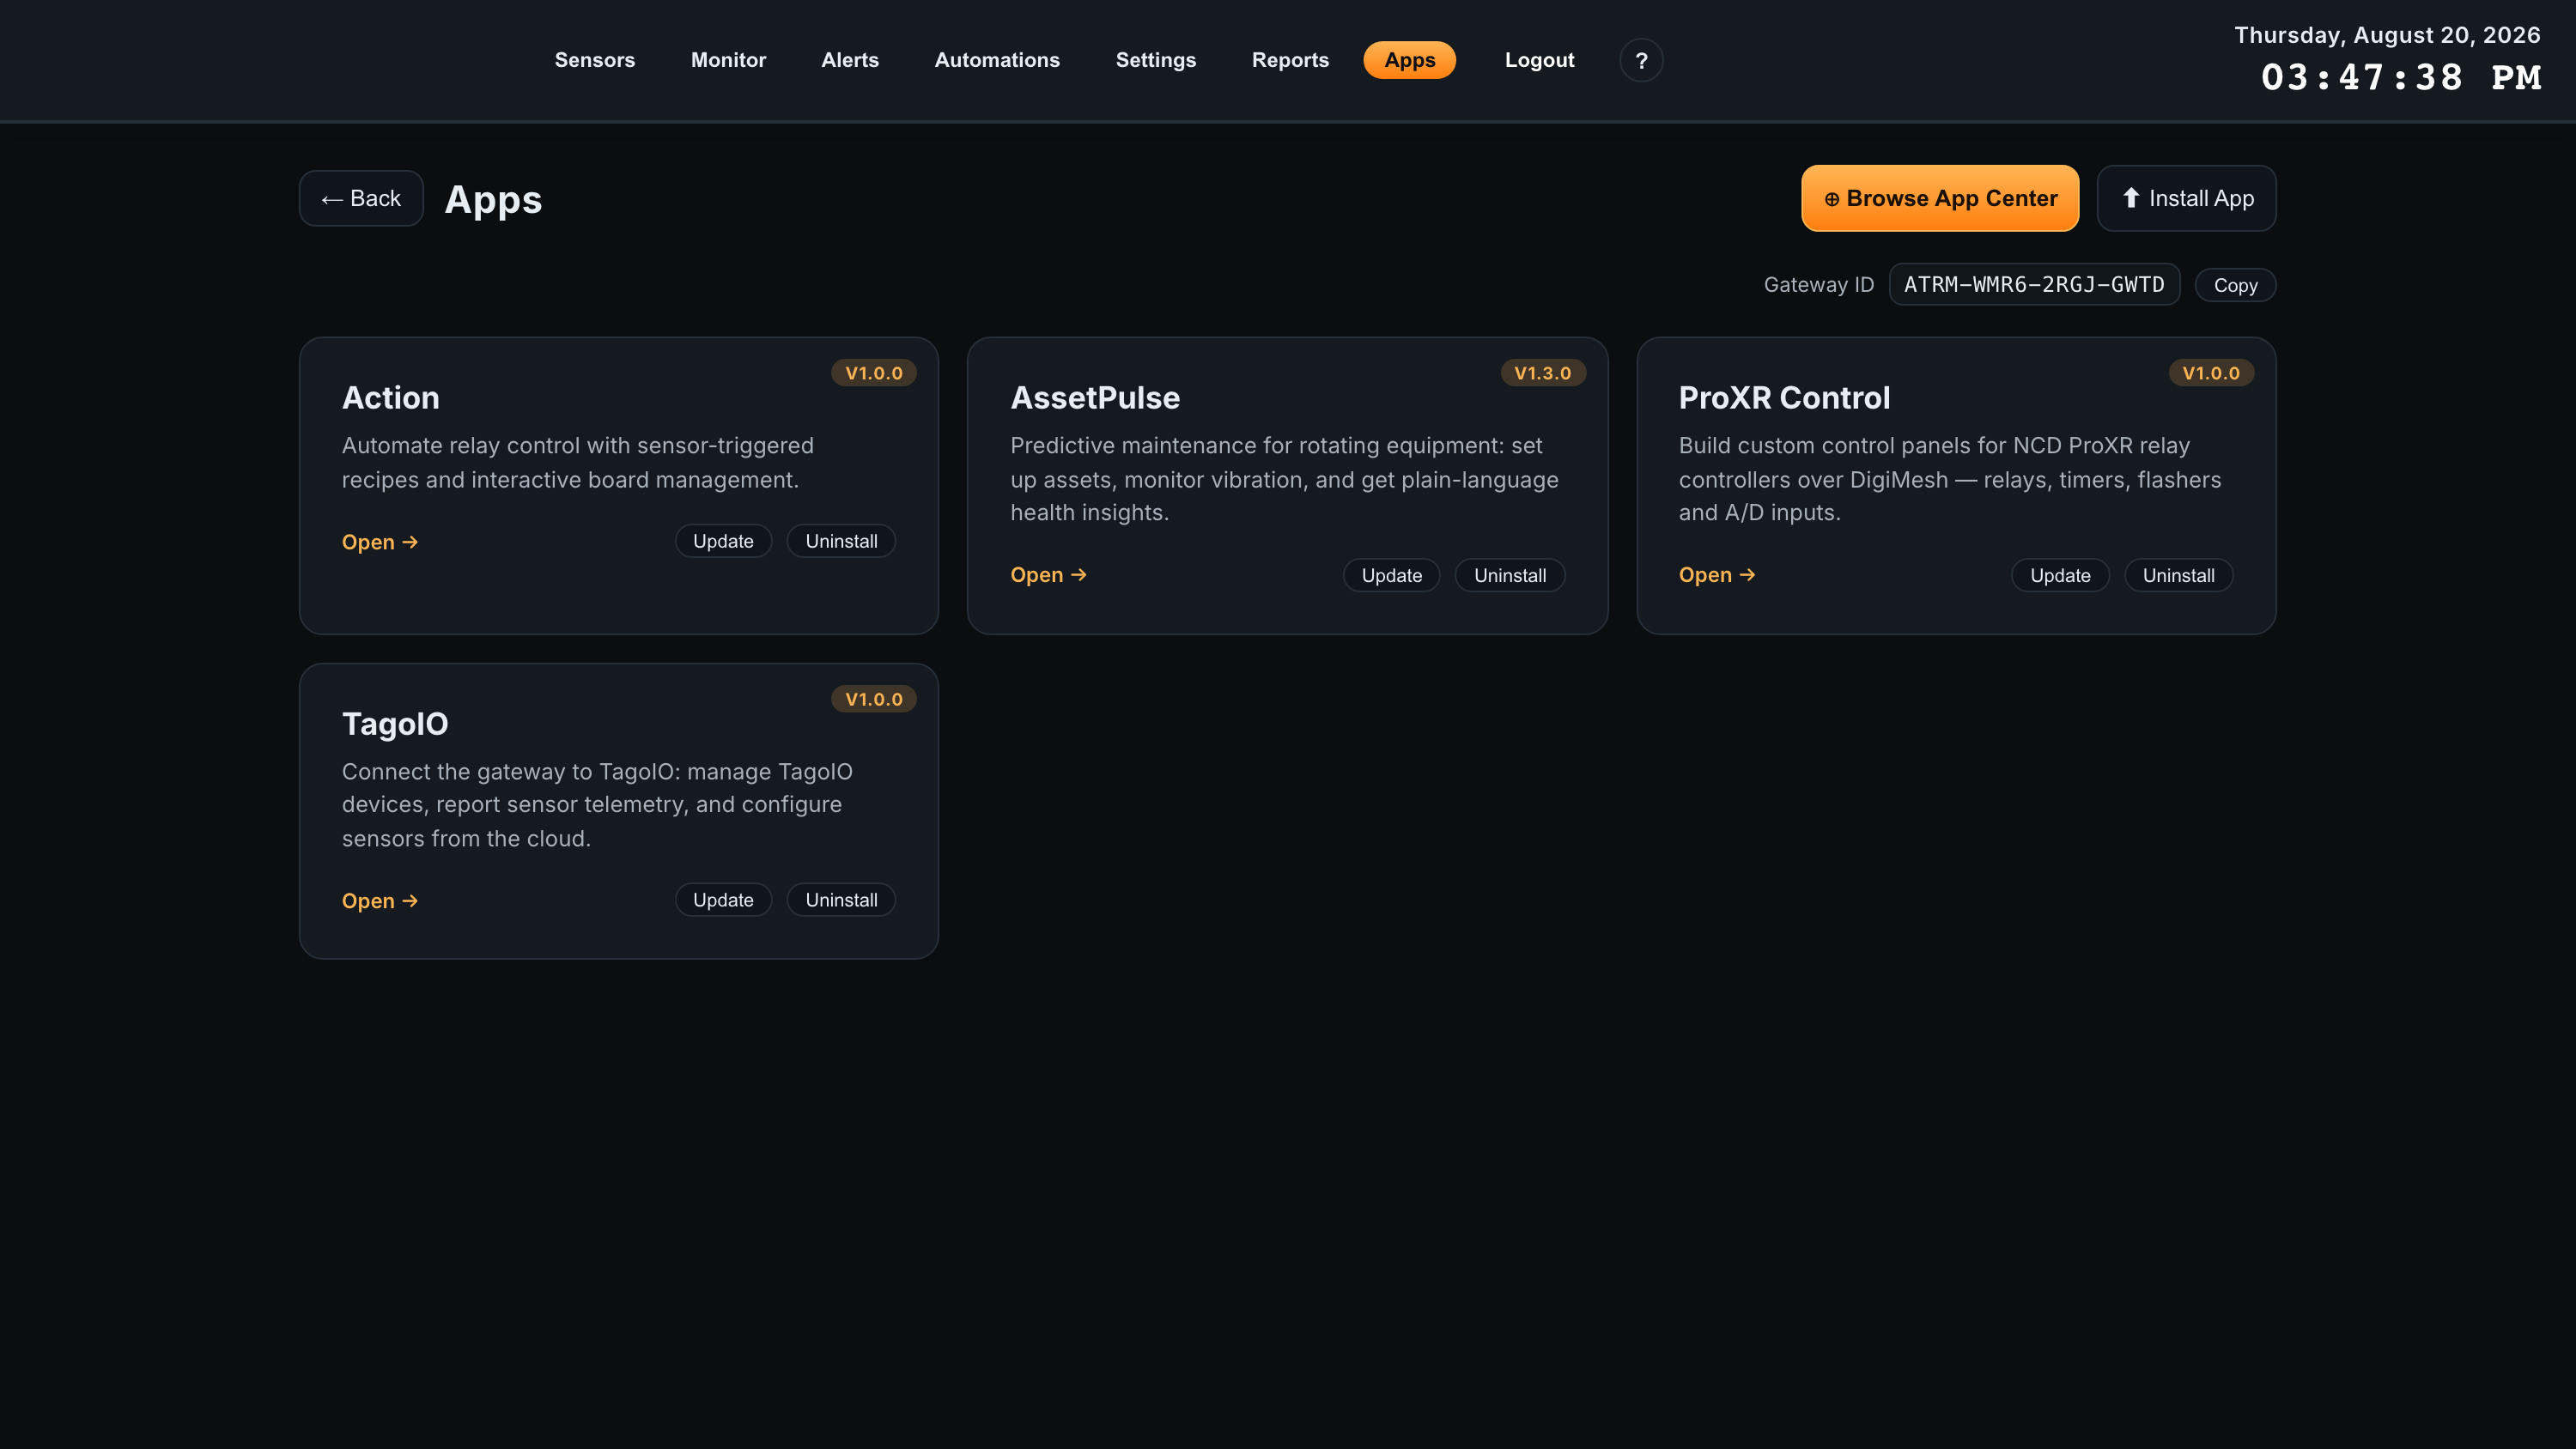
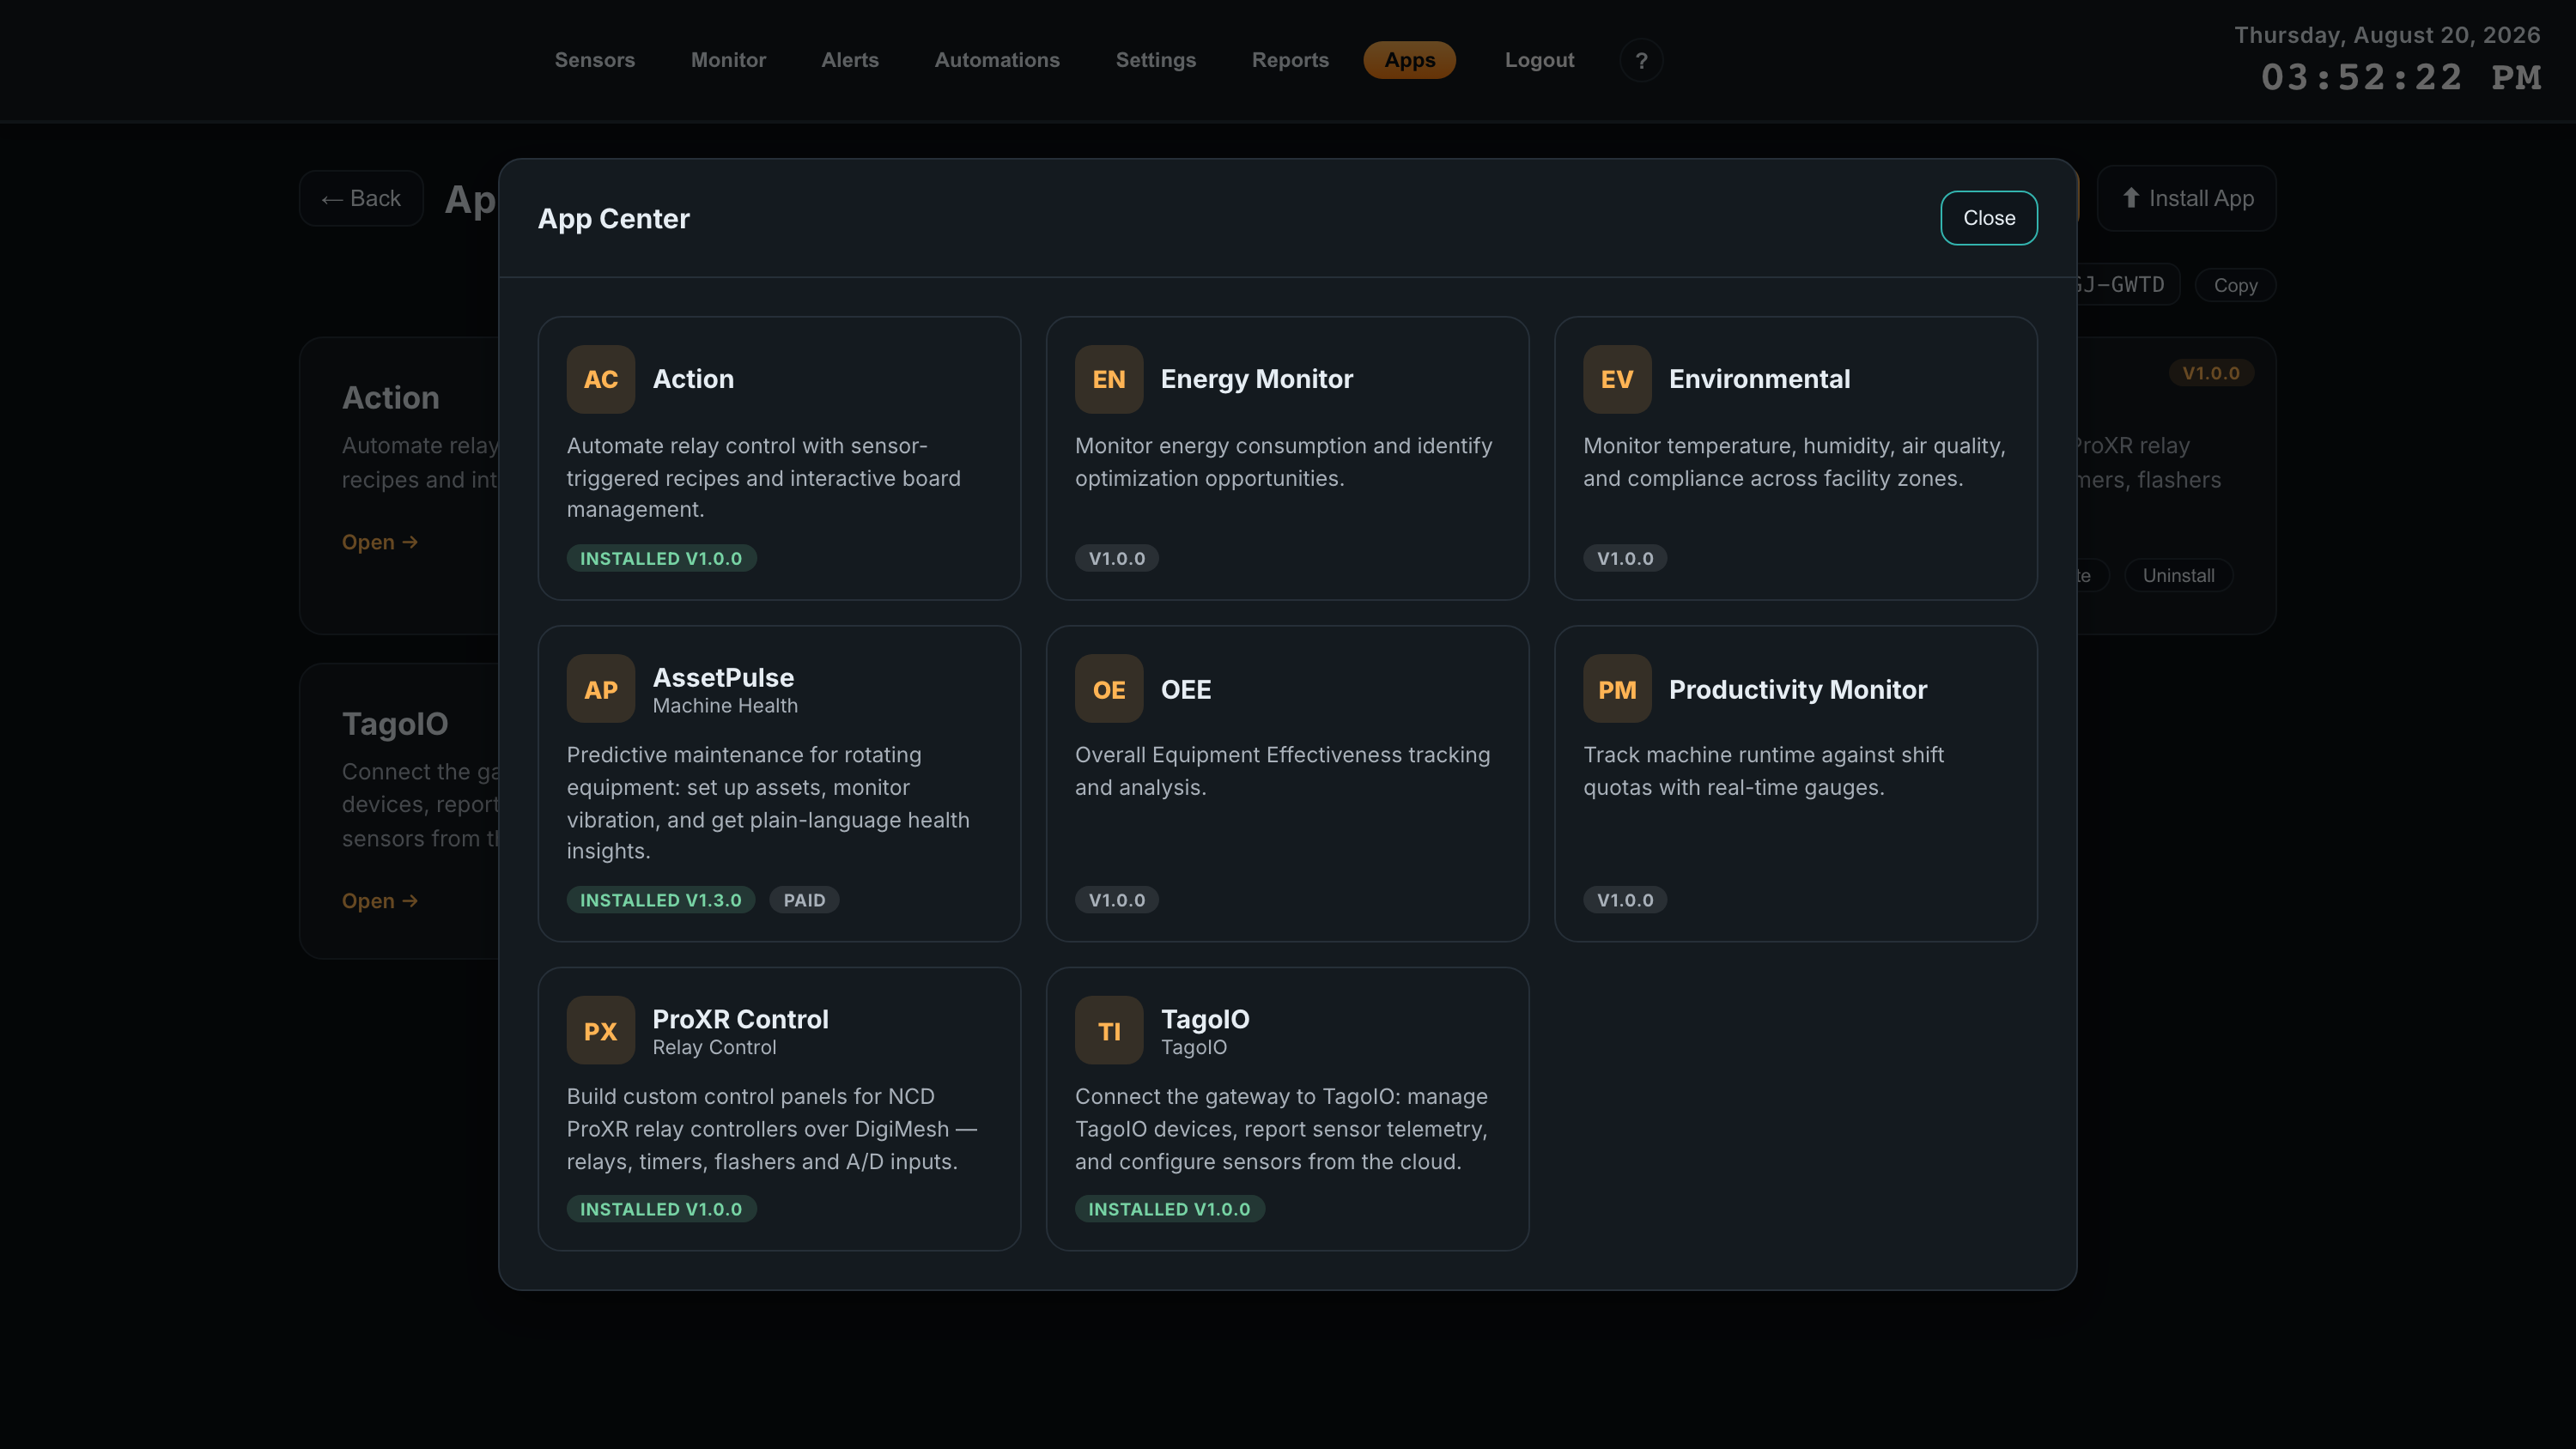
Open the Apps tabIn Atrium, click Apps in the top navigation, then Browse App Center.
-
2
Find TagoIOIt is listed with the subtitle TagoIO and the badge TI. There is no PAID badge, so no license step.
-
3
Install itBoth platform services restart, so the gateway API is briefly unavailable. The card then reads INSTALLED.
-
4
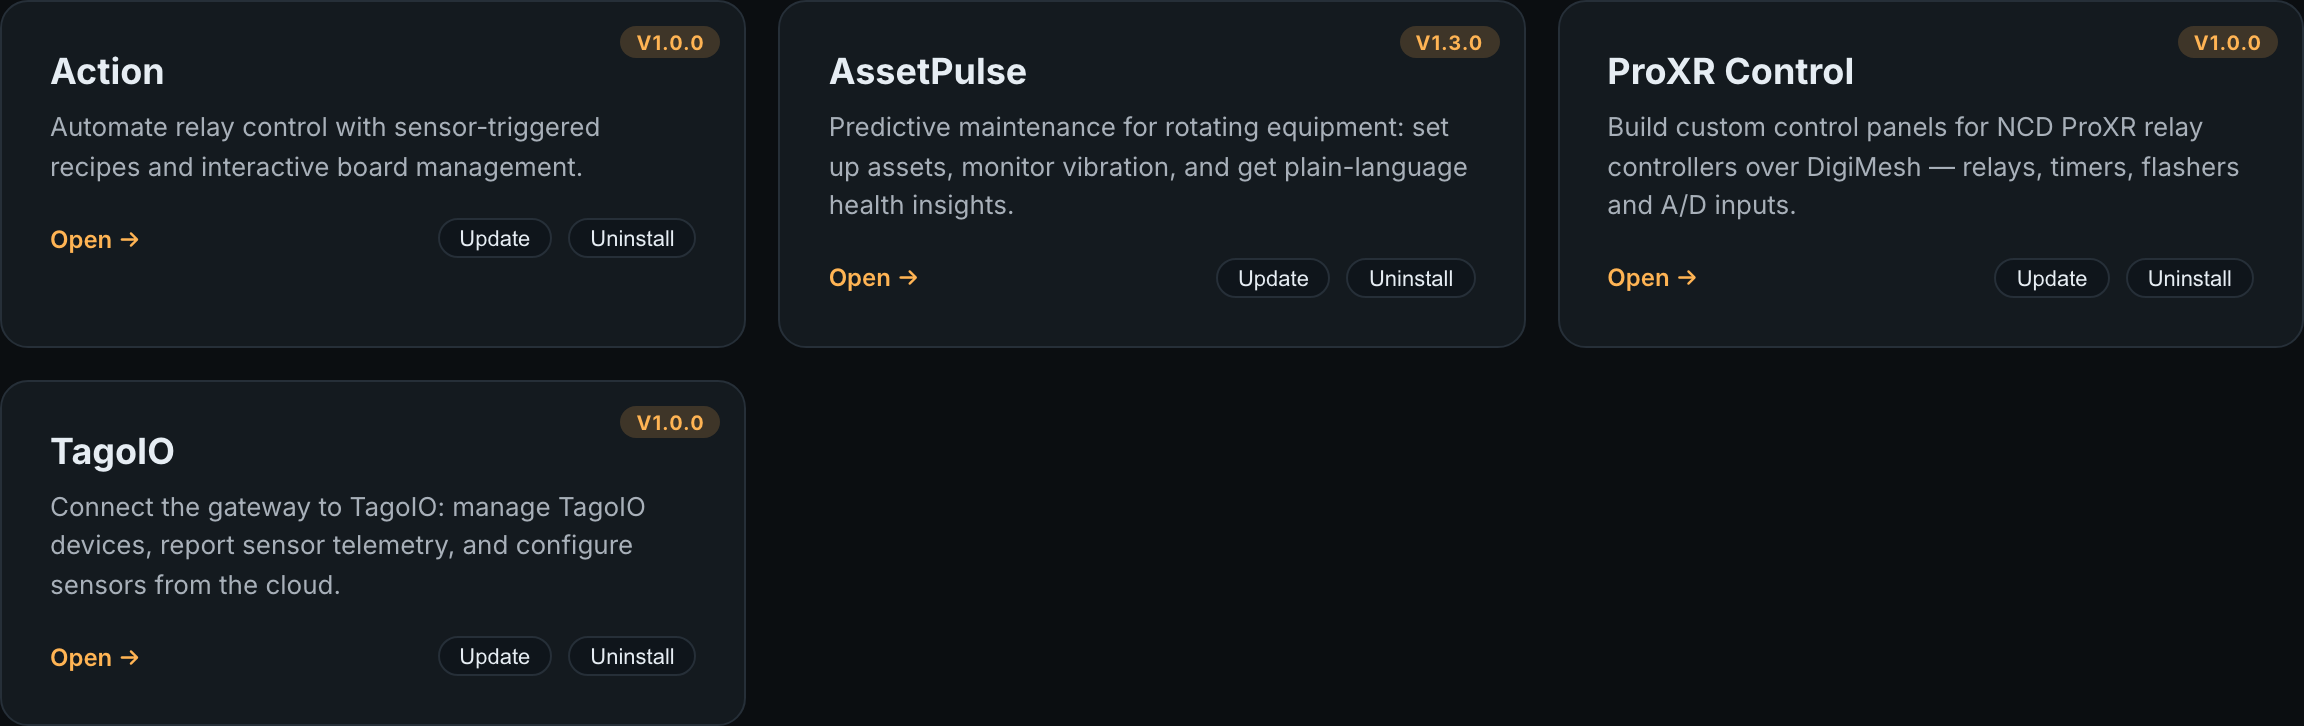
Click Open on the TagoIO cardThe app opens on its Connection screen. Alongside Open the card also carries Update and Uninstall.
What installing changes
- The app derives a gateway prefix for TagoIO serials from the gateway’s name — “Gateway B00E” becomes b00e. See Serial namespace.
- No outbound request is made and nothing is created in TagoIO. Until you connect an account, the app is inert.
04First-Time Setup
Four steps take you from a freshly installed app to sensors reporting into TagoIO with a dashboard that can change their settings. Everything else in this guide is detail on these four screens.
1. Get your TagoIO credentials
Two separate credentials are needed, because TagoIO uses two different interfaces. Both are generated in TagoIO, not in Atrium.
| Credential | Where in TagoIO | What the gateway uses it for |
|---|---|---|
| Profile token p-… |
Profile settings → Tokens | Creating and updating devices through the REST API. It is tied to one profile. |
| Authorization at… or a 16-character hash |
Devices → Authorization → Generate, token format TagoTiP(s) | Sending telemetry over TagoTiP. You may paste either the token or its token hash; the gateway derives the hash it needs. |
2. Connect the gateway
-
1
Open the Connection screenIt is the app’s first screen. The panel reads Not connected and the form below is headed Connect to TagoIO.
-
2
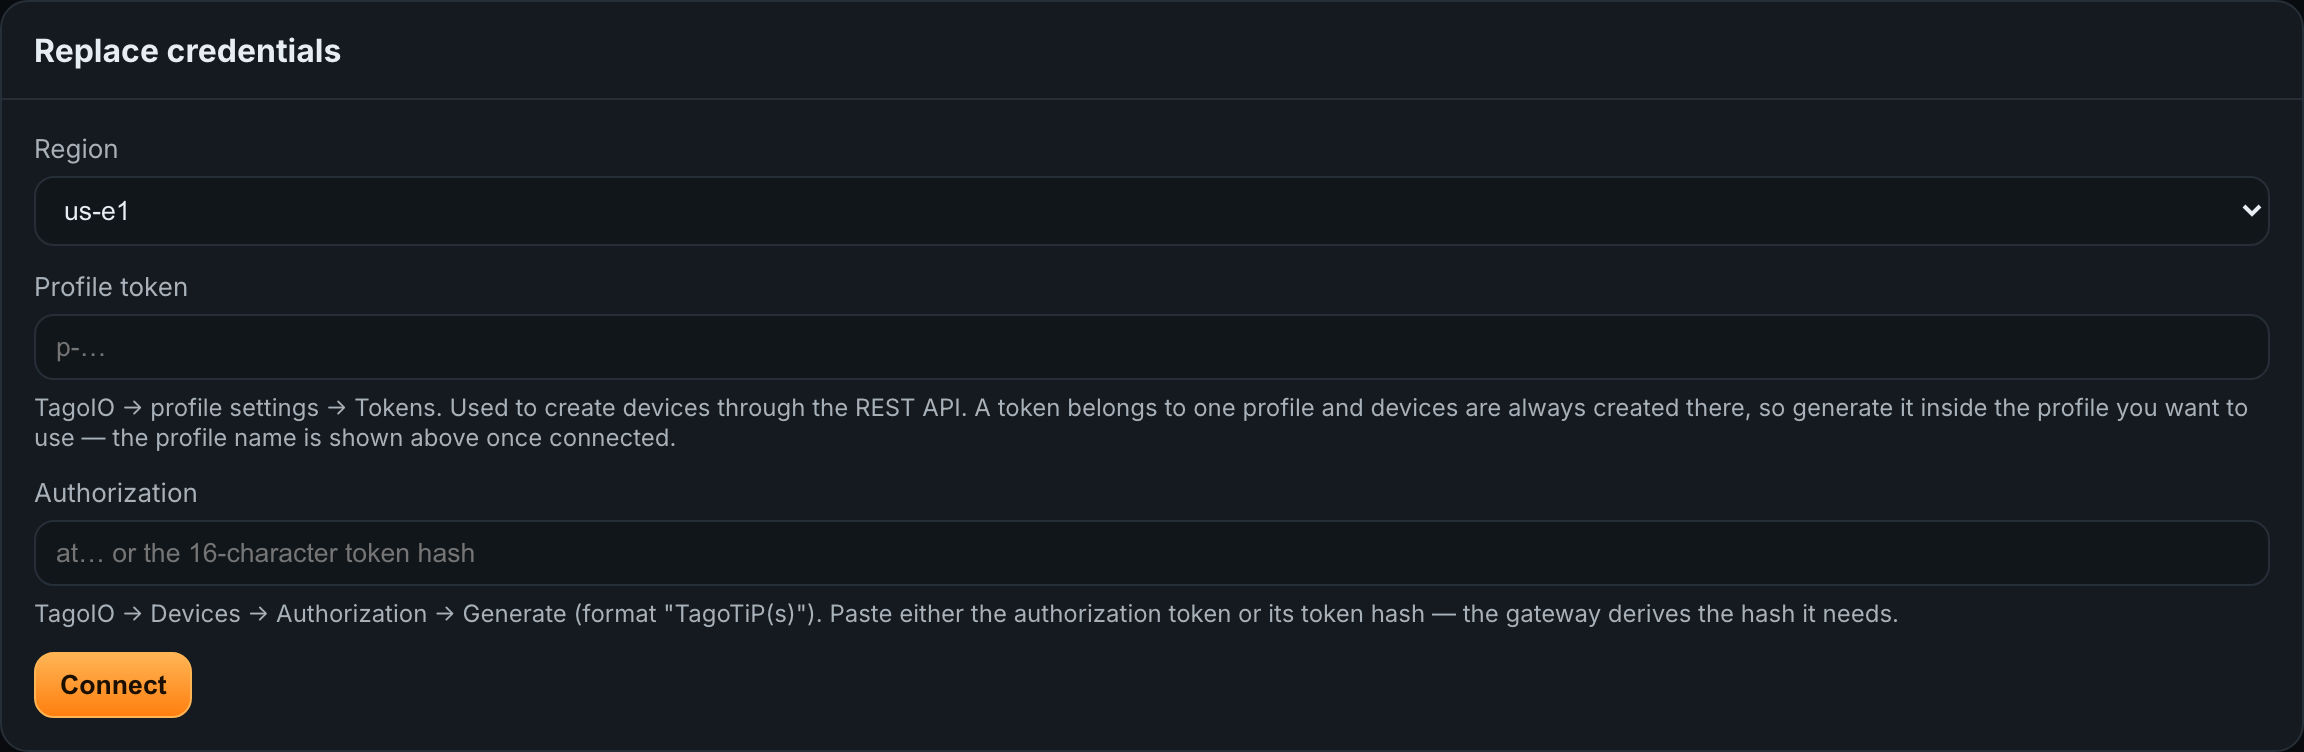
Choose your Regionus-e1 or eu-w1, matching the region your TagoIO account lives in. This decides which TagoIO hosts the gateway talks to.
-
3
Paste the Profile token and AuthorizationBoth fields are masked. Connect stays disabled until both contain something.
-
4
Click ConnectThe button reads Verifying… while the gateway checks the token against TagoIO. On success the message Connected to TagoIO. appears, the chip turns Connected, and the panel fills in your account and profile name.
3. Choose which sensors report
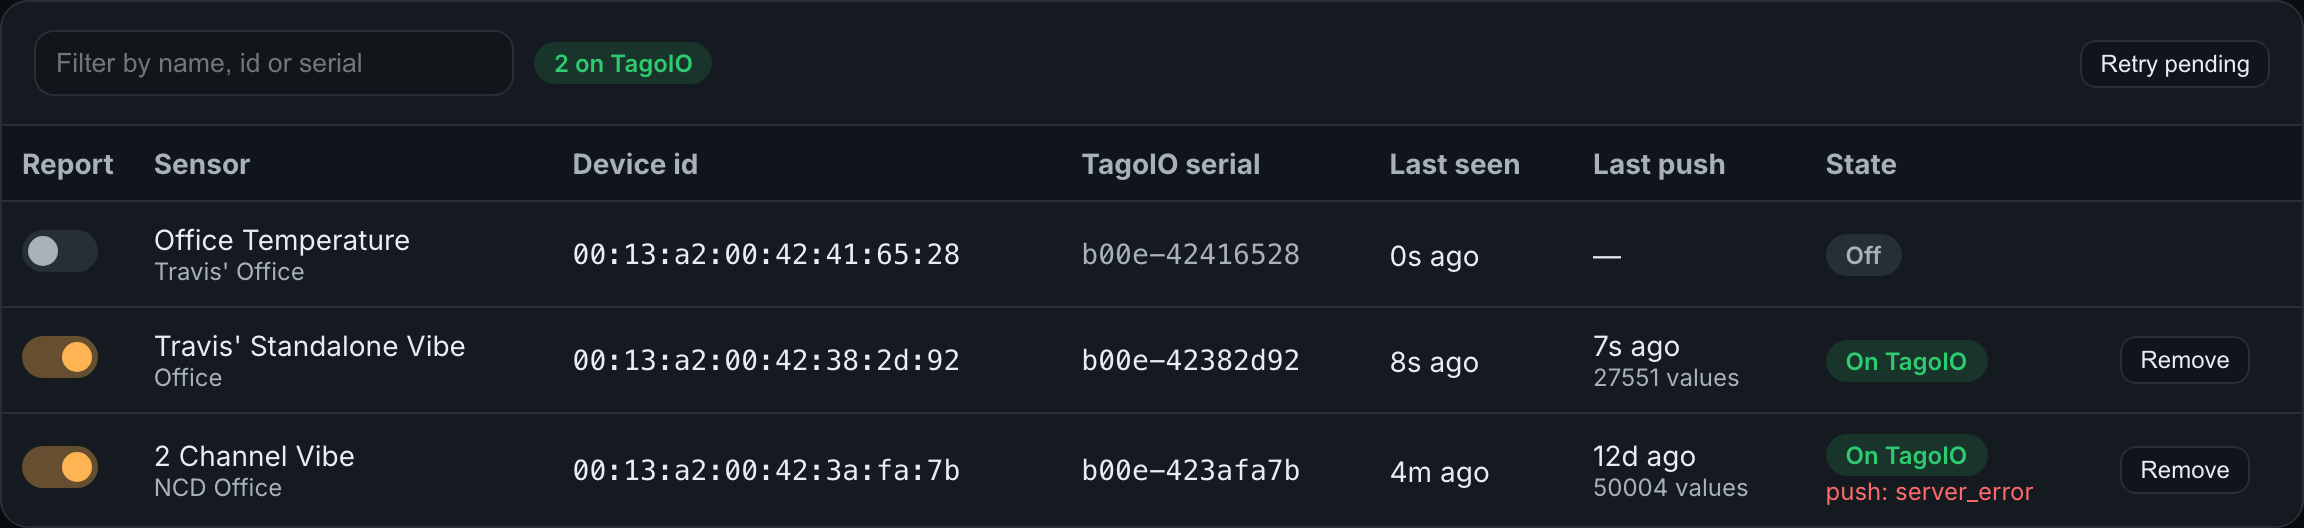
Nothing reports until you say so. Open Devices and use the Report switch on each sensor you want in TagoIO.
Turning a switch on assigns that sensor a permanent TagoIO serial and creates its TagoIO device immediately, so the State column normally moves to On TagoIO within a second or two. If TagoIO is unreachable the sensor sits at Pending and a background worker keeps retrying, so you can enable sensors before the link is healthy.
4. Build the TagoIO dashboard
This step is only needed if you want to change sensor settings from TagoIO. If you only want readings flowing in, you are already done after step 3.
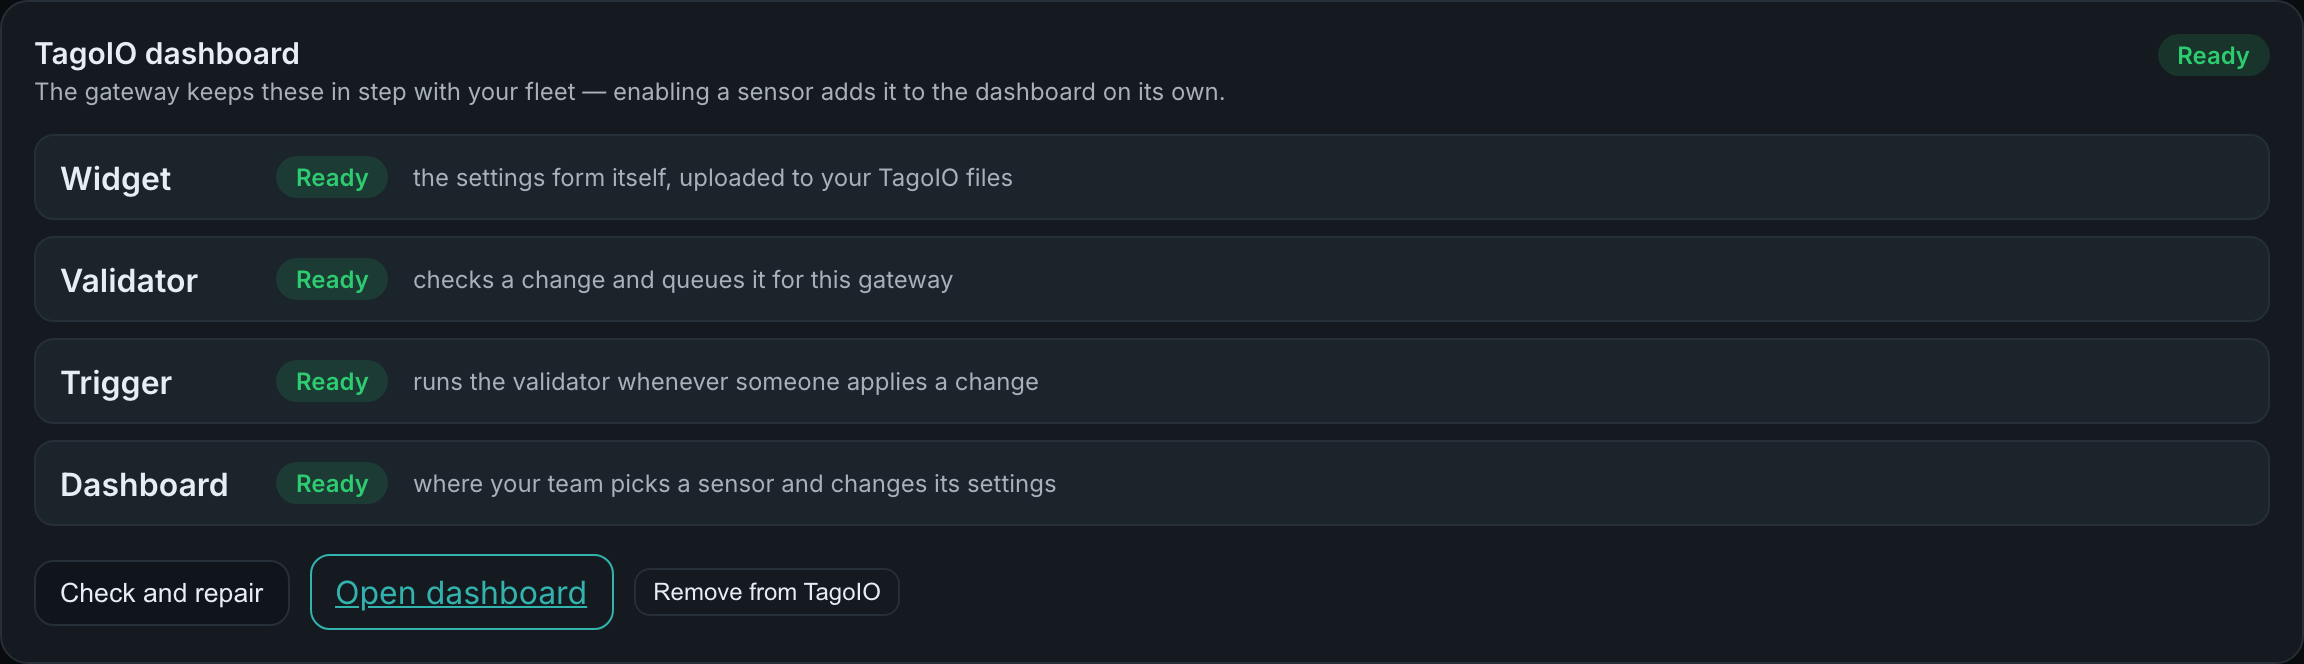
Open Configuration and click Set up in TagoIO. The gateway creates four things in your TagoIO account and reports each one’s state. Once all four read Ready, Open dashboard takes you to it.
05Connection
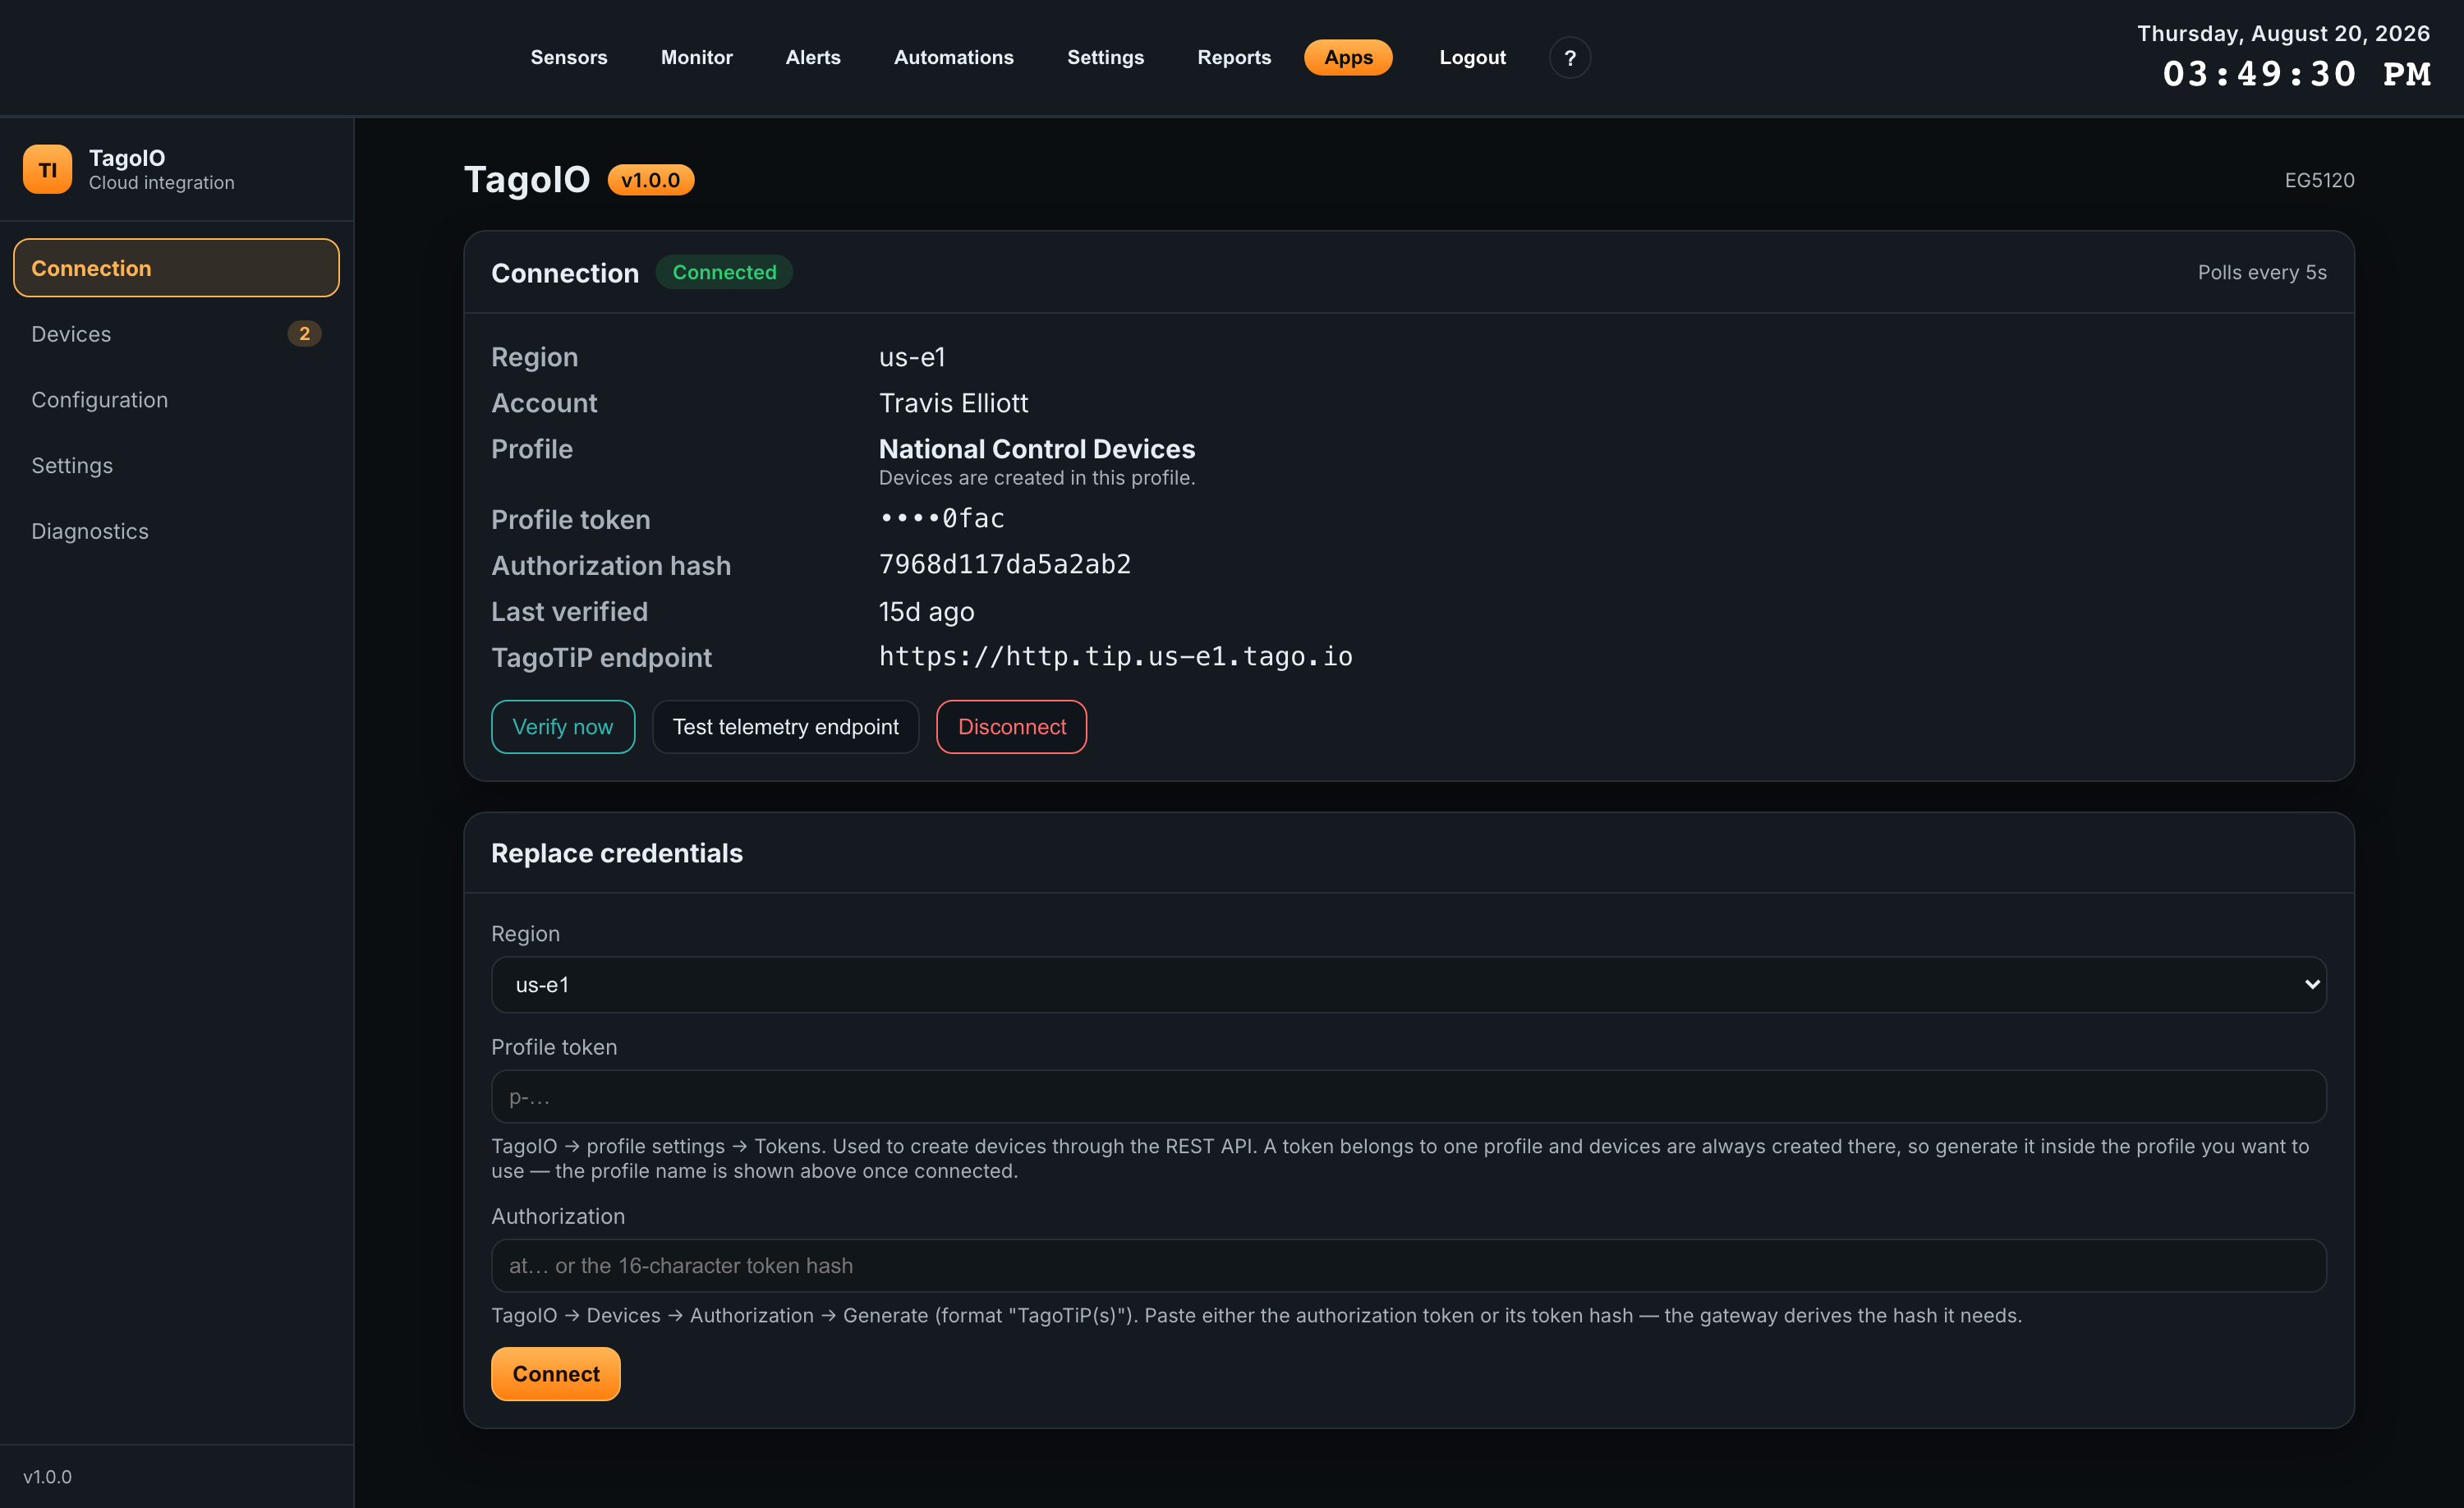
The Connection screen is where the gateway’s link to TagoIO is established and checked. It refreshes itself every 5 seconds, which the panel states as Polls every 5s.
Status panel
The chip beside the word Connection is the one-glance summary.
| Chip | Means |
|---|---|
| Not connected | No credentials have been stored. Nothing is reported and nothing is created in TagoIO. |
| Connected | Credentials are stored and TagoIO accepted them the last time they were checked. |
| Unverified | Credentials are stored but have not been confirmed against TagoIO yet. |
| Error | The last attempt failed. The reason is shown in the Last error row. |
The rows beneath it are:
| Row | What it tells you |
|---|---|
| Region | The TagoIO region in use, us-e1 or eu-w1. |
| Account | The TagoIO account name the profile token resolved to. Useful confirmation you connected the account you meant to. |
| Profile | The TagoIO profile devices are created in, with the reminder Devices are created in this profile. |
| Profile token | The last four characters only, as ••••0fac. The token itself is never shown again, and never appears in the app’s API responses or logs. |
| Authorization hash | The 16-character hash the gateway derived. This is shown in full because the TagoTiP protocol treats it as public, and quoting it helps support. |
| Last verified | How long ago TagoIO last confirmed the credentials. This does not go stale on its own — a large value simply means nobody has clicked Verify recently. |
| TagoTiP endpoint | The host telemetry is sent to, derived from the region. |
| Last error | Only present when something failed. It is cleared by the next success. |
Verify, test, disconnect
Three buttons appear once credentials are stored. None of them writes data to TagoIO.
Verify now
Re-checks the stored profile token against the TagoIO REST API and refreshes the account and profile names. On success it reports Credentials verified. This is the check to run when device creation is failing.
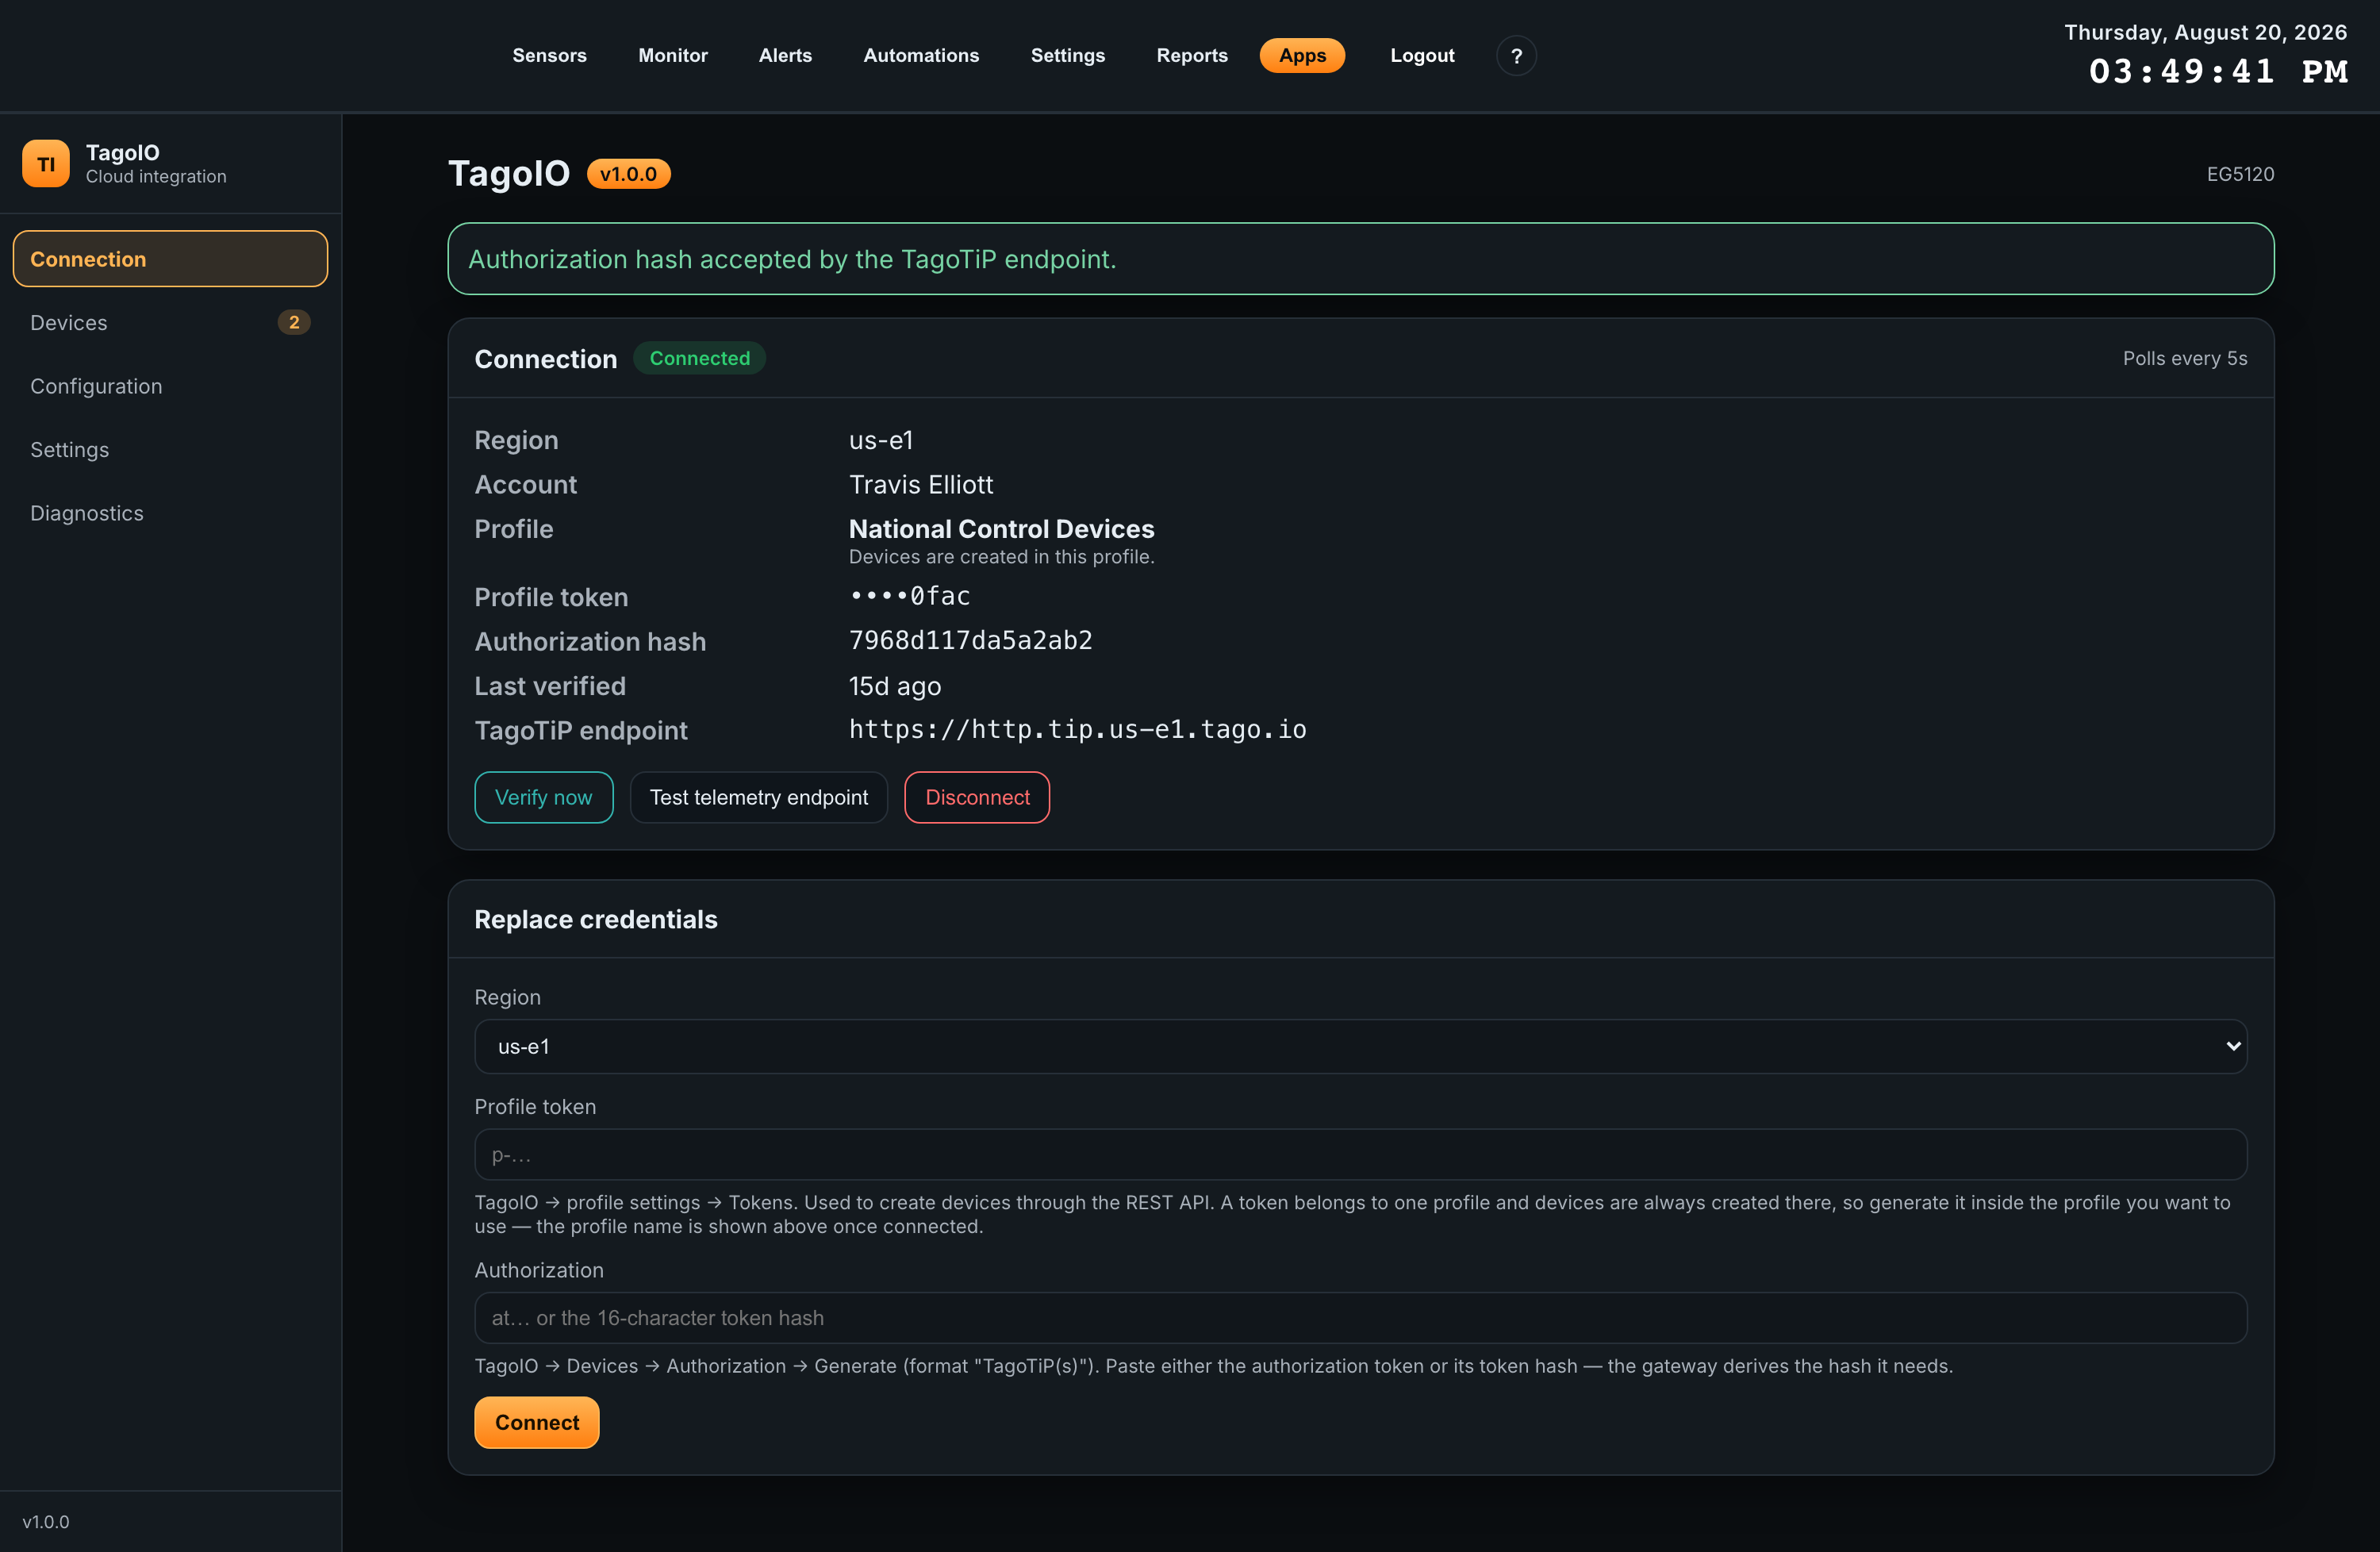
Test telemetry endpoint
Checks the other half — the Authorization hash used for telemetry, which Verify now does not cover. It pushes to a randomly named serial that cannot exist. TagoIO resolves the profile before it looks up the serial, so a device_not_found answer proves the hash is valid, while invalid_token proves it is not. No data is written either way, and no real device is touched.
Success reads Authorization hash accepted by the TagoTiP endpoint. Failure reads The TagoTiP endpoint rejected this authorization hash.
Disconnect
Deletes the stored credentials from the gateway. Reporting stops immediately. Your TagoIO devices and their data are left exactly as they are, and so are the gateway’s device mappings, so reconnecting the same profile resumes where it left off.
Replacing credentials
Once connected, the lower panel is headed Replace credentials and works the same way. Use it to rotate a token, or to move to a different region or profile.
The gateway keeps no copy of what you type: the fields are cleared as soon as it has accepted them.
Profiles
Because TagoIO cannot move a device between profiles, connecting a token from a different profile while devices are already mapped is refused rather than silently orphaning them. A panel appears headed This token belongs to a different profile, naming how many devices exist in the current profile and what will happen.
Your two options are:
- Relink to <profile> — the app clears its mappings and recreates the devices in the new profile. The originals stay in the old profile for you to delete in TagoIO. The confirmation reads Relinked. Enabled sensors will be recreated in the new profile.
- Cancel — nothing changes.
06Devices
Devices is where you decide which sensors reach TagoIO, and where you check that they are getting there. The heading counts the sensors Atrium has set up, for example 3 whitelisted sensor(s); the count on the sidebar item is how many are enabled for TagoIO.
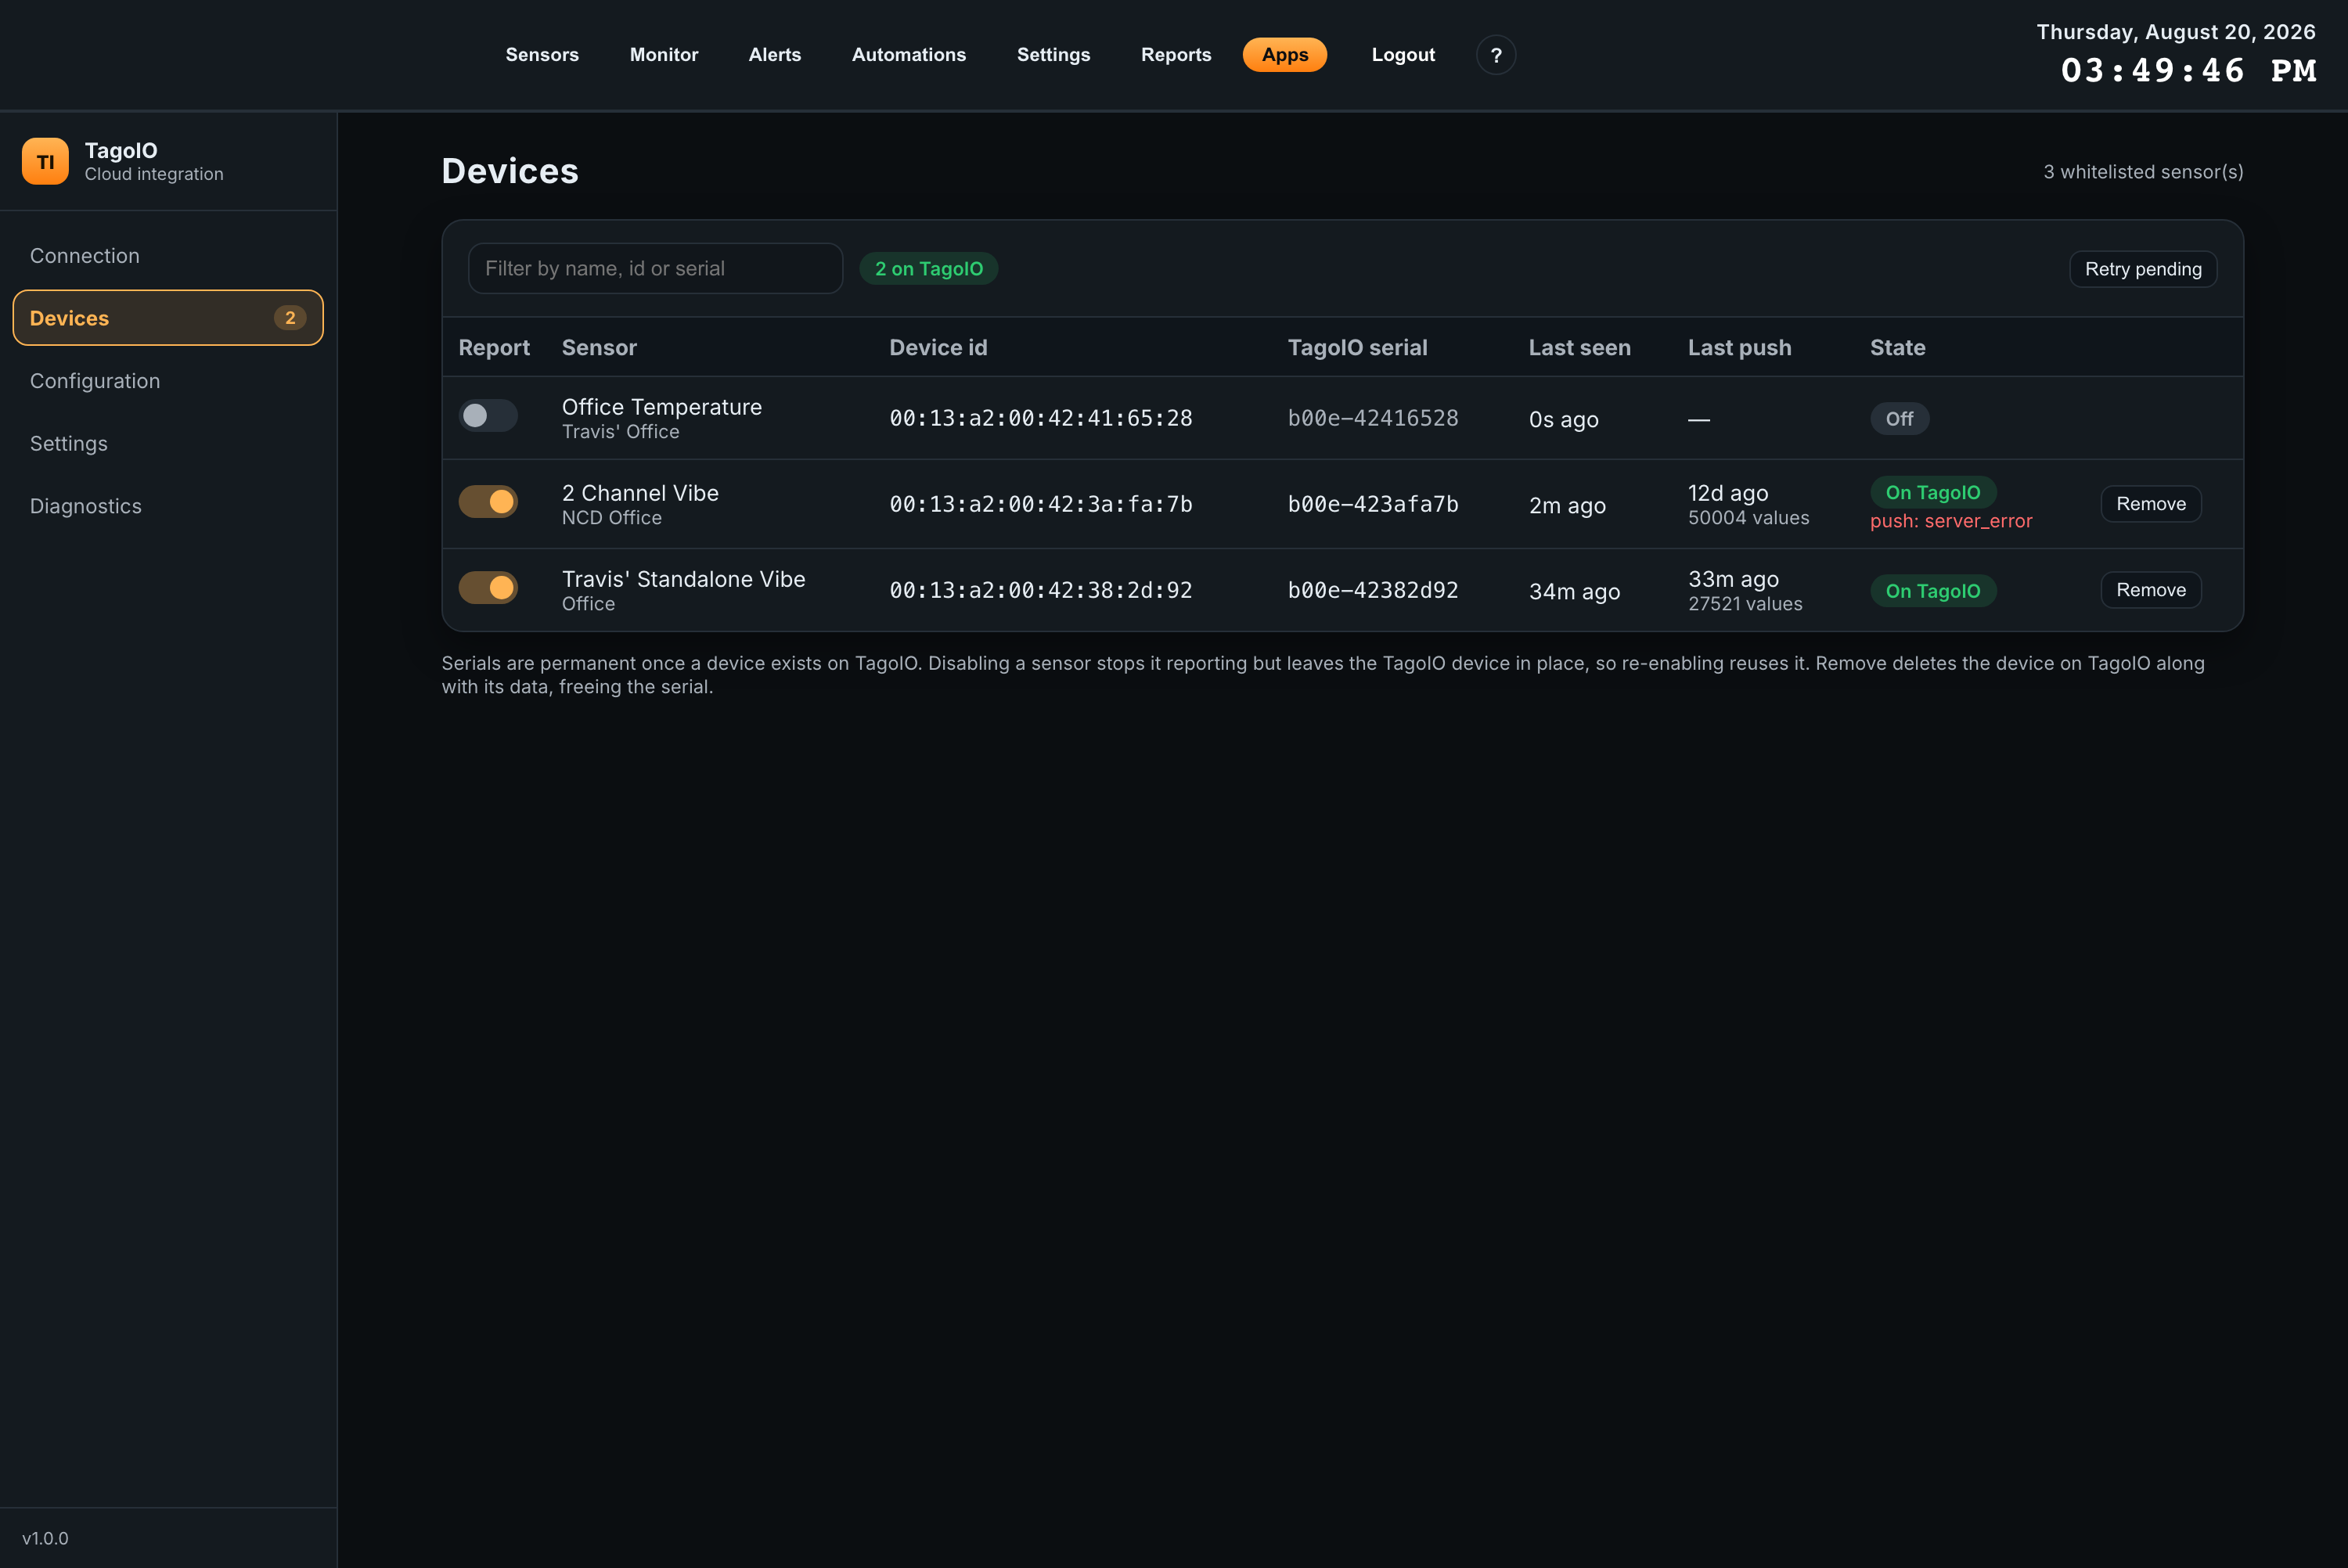
Reading the table
| Column | What it shows |
|---|---|
| Report | The switch that enables or disables reporting for this sensor. |
| Sensor | The sensor’s Atrium name, with its location beneath it when one is set. This is also the name given to the TagoIO device. |
| Device id | The sensor’s 64-bit radio address, colon-delimited. |
| TagoIO serial | The serial this sensor has, or would get. Shown grey until a serial is actually assigned. |
| Last seen | When the gateway last heard from the sensor over the radio. Nothing to do with TagoIO — a sensor can be seen recently and still be failing to push. |
| Last push | When the gateway last delivered readings to TagoIO, with the cumulative count of values sent beneath it. Shown as — unless the device is enabled and created. |
| State | The sync state chip, plus any error. Errors are prefixed to say which stage failed: push: for telemetry, tags: for the metadata sync. |
Above the table, the Filter by name, id or serial box narrows the list, and the chips summarise the fleet: how many are on TagoIO, how many pending, how many failed. Retry pending is enabled only when there is something pending or failed to retry.
Turning reporting on and off
Switching on assigns a permanent serial and attempts the TagoIO device creation straight away, so you get immediate feedback. If the sensor was enabled before, its existing TagoIO device is reused rather than duplicated — and the app checks the device still exists in TagoIO first, so one deleted from the TagoIO dashboard is rebuilt instead of being trusted as present.
Switching off stops the sensor reporting but leaves the TagoIO device and its data in place. The app confirms this as Device disabled. It stays on TagoIO but stops reporting. Its state chip becomes Off.
If the gateway is not connected, a notice at the top of the page says so and enabling a device queues it until the connection is restored.
Sync states and retries
| Chip | Meaning | What to do |
|---|---|---|
| Off | Not enabled for TagoIO. | Nothing. This is the resting state for sensors you do not want in TagoIO. |
| Pending | Enabled, but the TagoIO device does not exist yet. | Wait. A background worker retries every 60 seconds in batches of 5, backing off to at most one hour between attempts. |
| On TagoIO | The TagoIO device exists and the sensor is reporting to it. | Nothing. Check Last push to confirm data is flowing. |
| Failed | Creation was attempted and TagoIO refused it. The reason is shown under the chip. | Read the error. Retry on the row clears the backoff and tries immediately. |
Retry pending in the toolbar reconciles everything outstanding at once and reports the outcome, for example Created 2 device(s); 0 failed. A row that is enabled but not yet created also carries its own Retry button.
Removing a device
Remove is the only way to free a serial, which matters if a sensor was mapped by mistake. Because serials are permanent on TagoIO, this is a real deletion, so it is confirmed inline: the row’s buttons become Delete on TagoIO and Cancel.
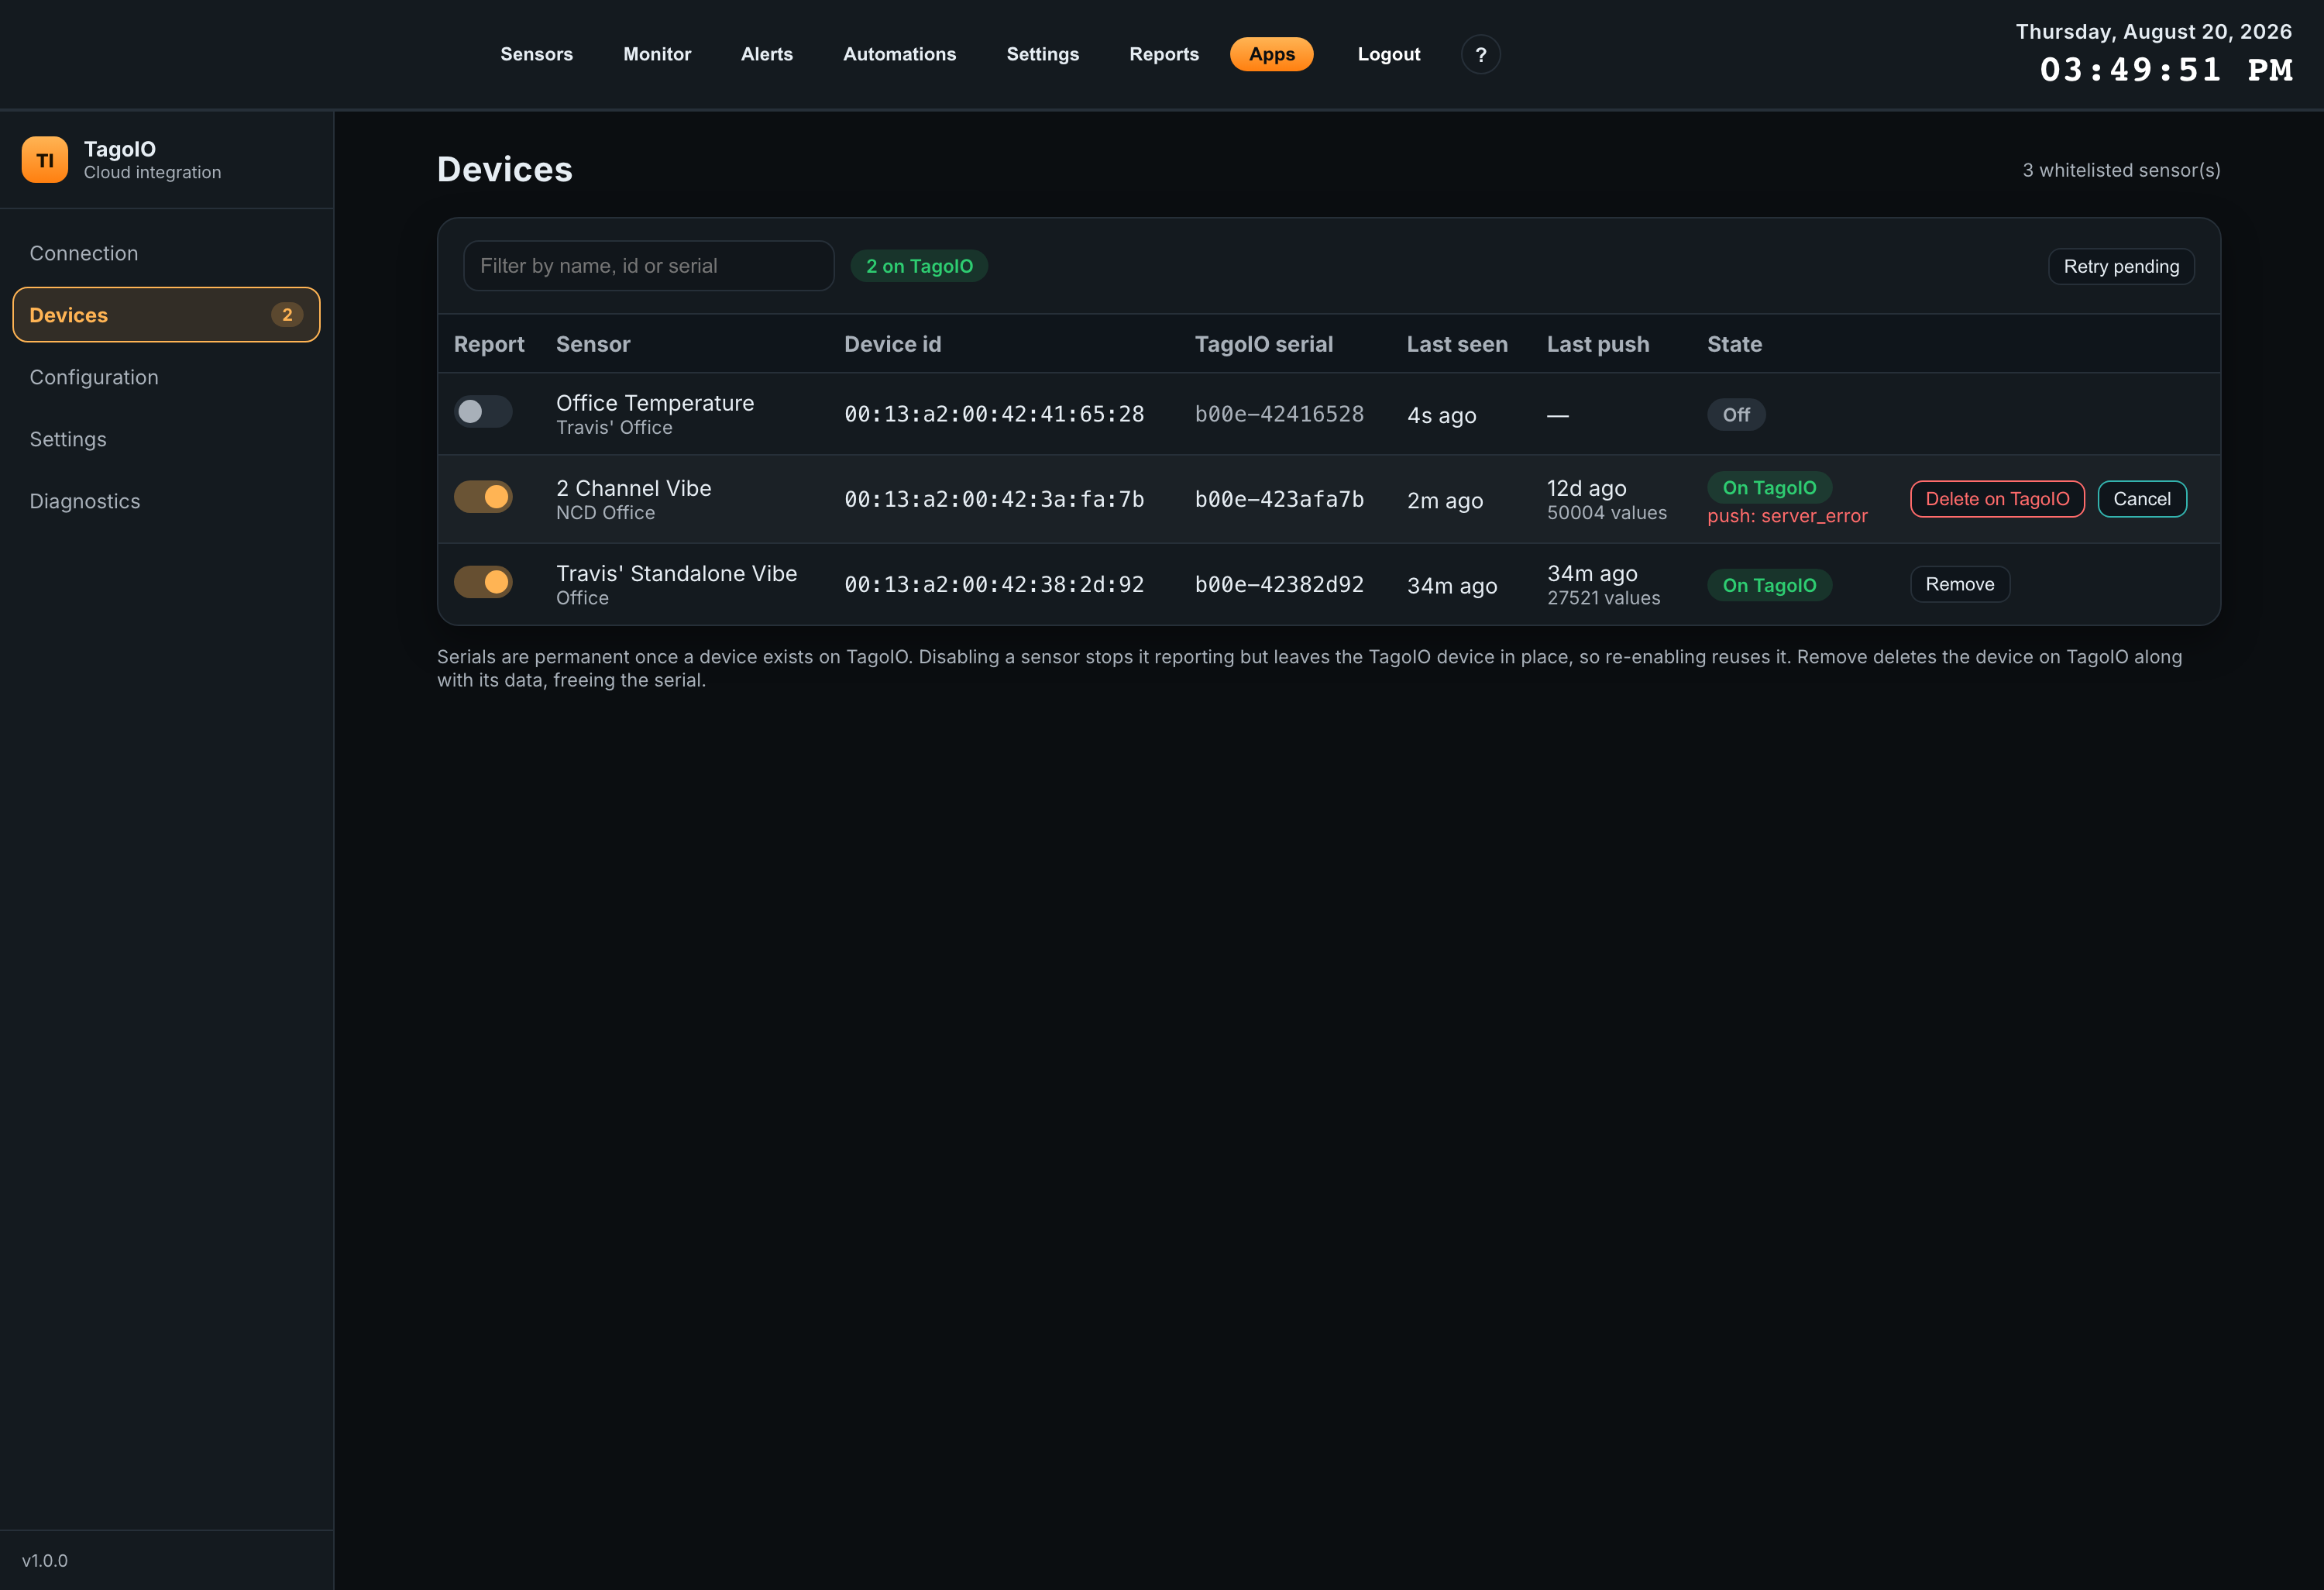
If TagoIO refuses the delete, the app offers a second path rather than leaving you stuck: a panel explains that TagoIO would not delete the device and offers Forget the mapping, which frees the serial locally and leaves the TagoIO device, if any, alone. Use it when you already deleted the device in the TagoIO dashboard yourself.
07Configuration
Configuration is the gateway’s side of two-way sensor settings. As the page itself says: settings changes made in TagoIO land here first, the gateway validates every value against the sensor’s own options before it touches the radio, then waits for the sensor’s next check-in — so a change is normally pending for one report interval.
This is the screen to open when someone says “I changed the interval in TagoIO and nothing happened”. Sync now in the header runs a pull, acknowledge and publish pass immediately instead of waiting for the next minute, and reports what it did.
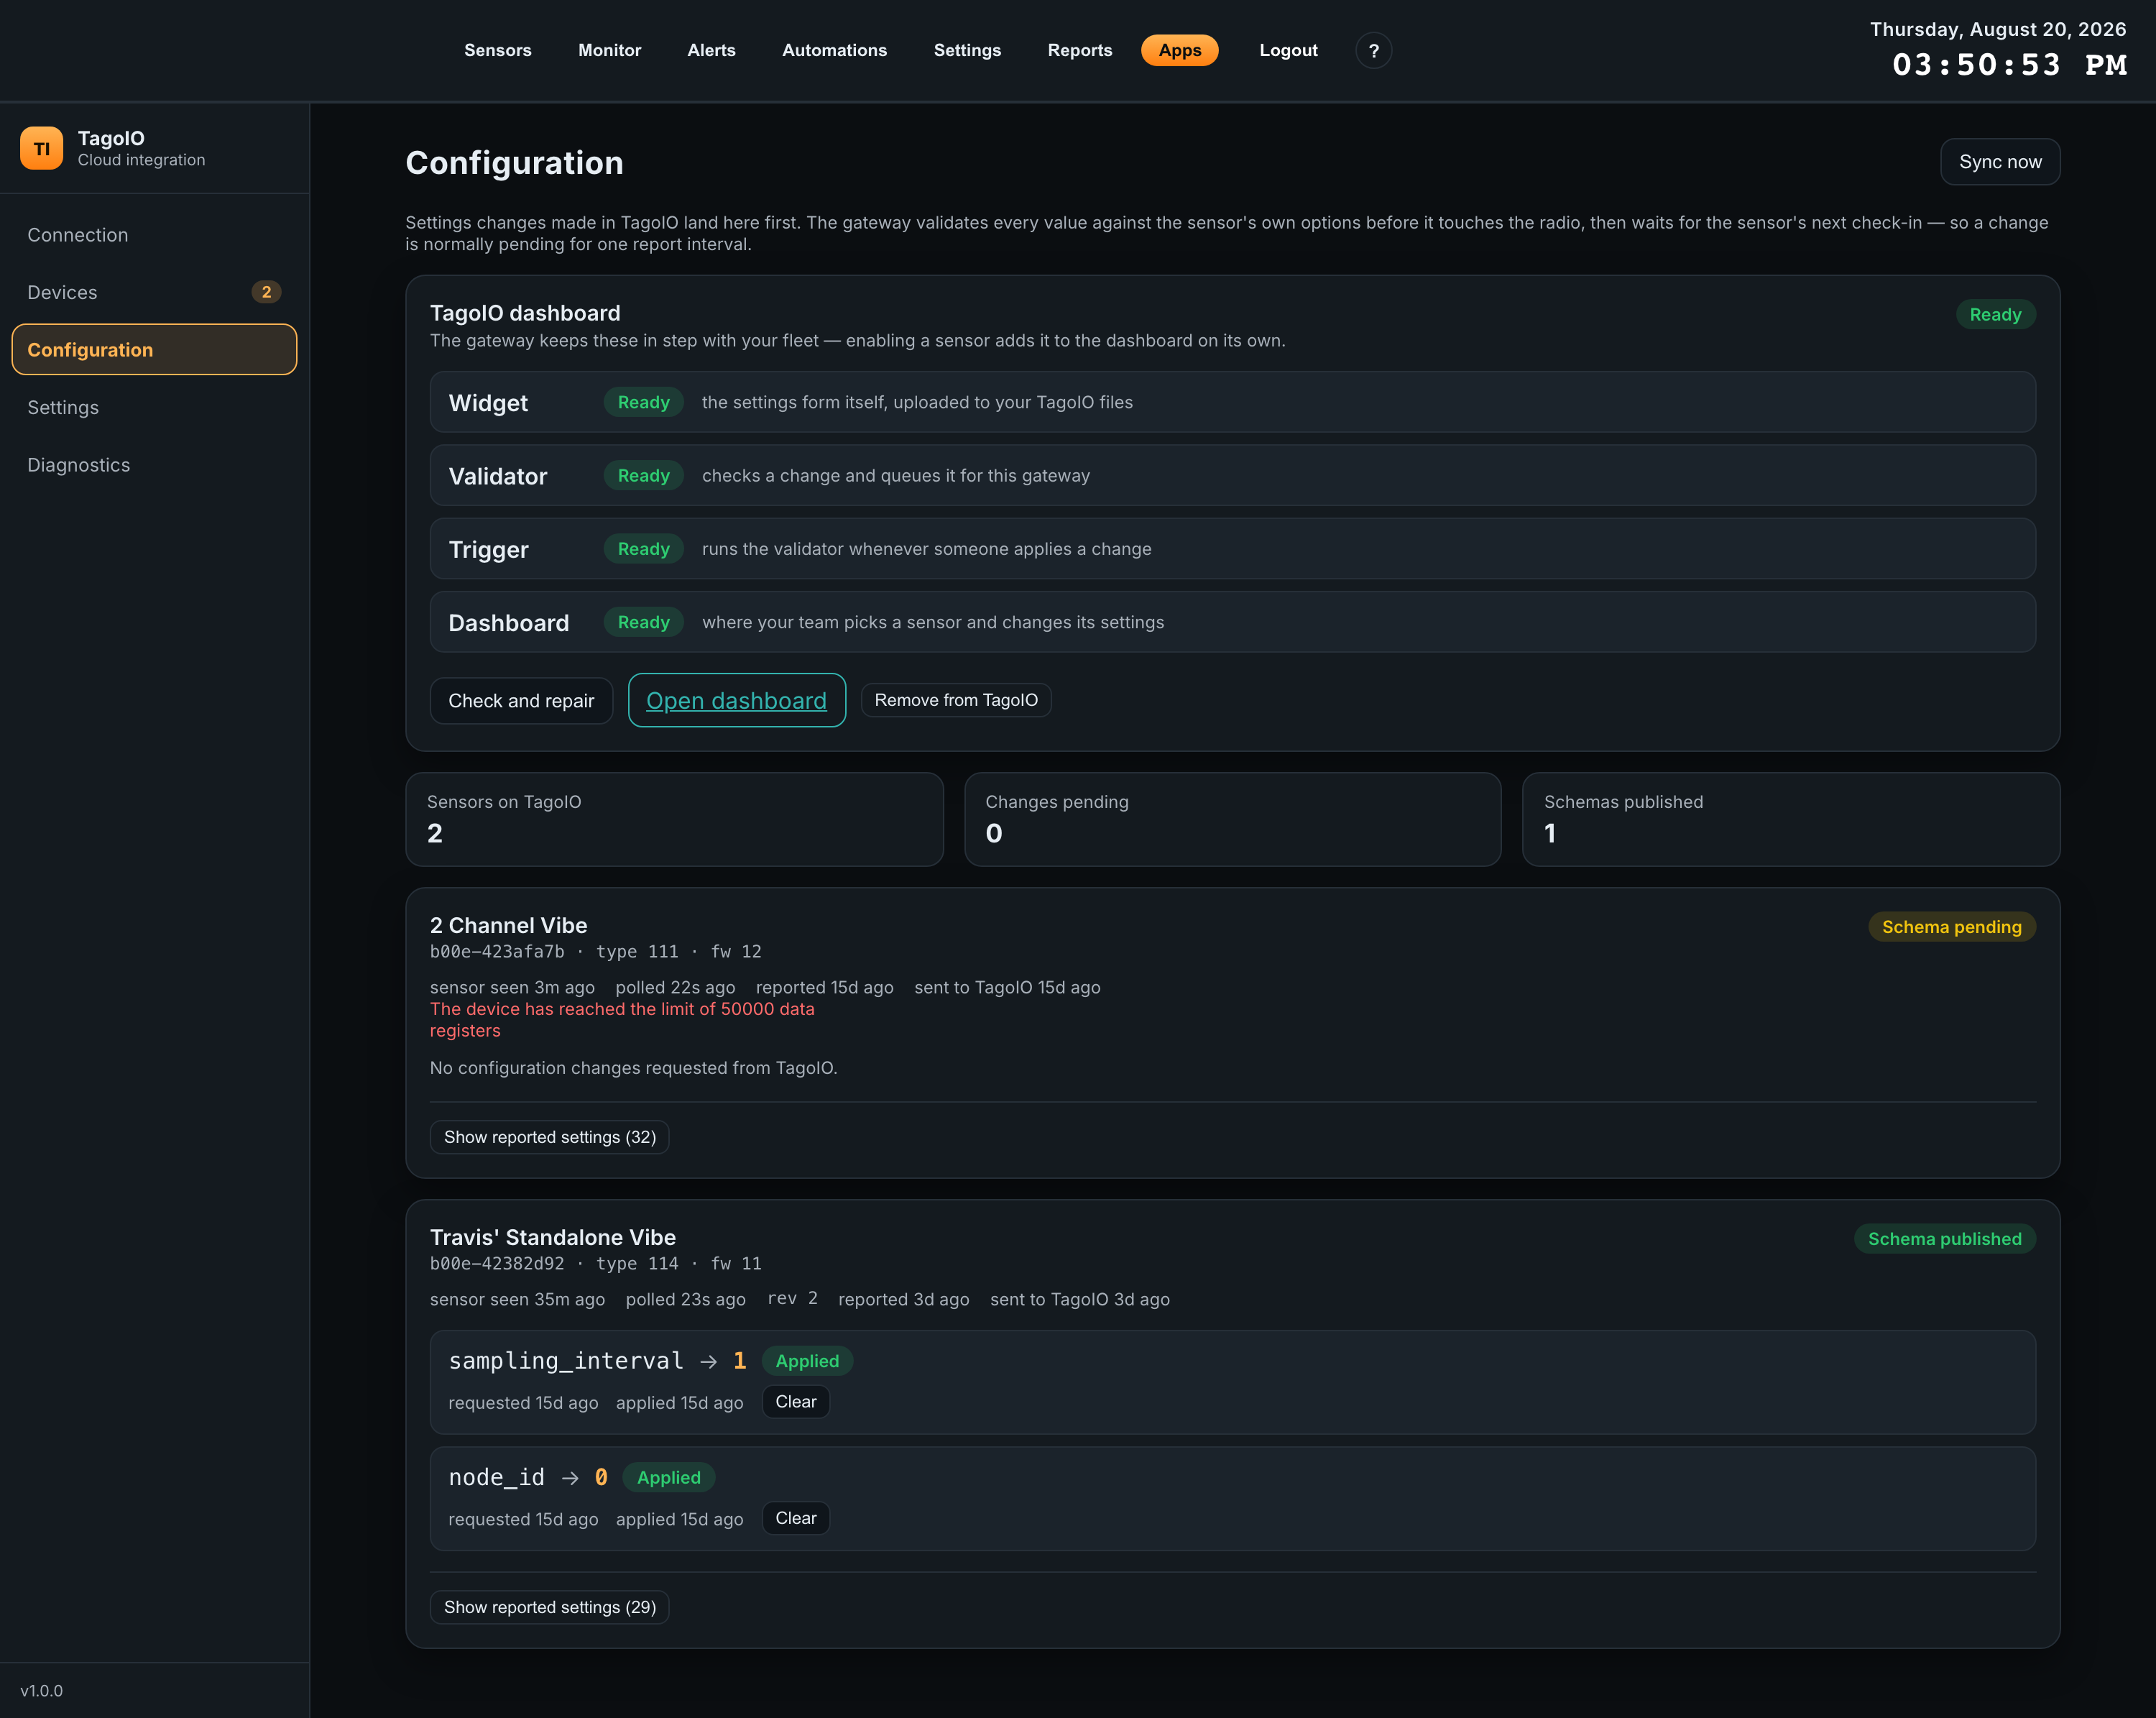
TagoIO dashboard setup
Sensor configuration needs four things to exist in your TagoIO account. The card describes each by what it does for you rather than by its TagoIO type.
| Item | Card description | What it actually is in TagoIO |
|---|---|---|
| Widget | the settings form itself, uploaded to your TagoIO files | An HTML file in the account’s Files, at atrium/sensor-config/<content-hash>/index.html. |
| Validator | checks a change and queues it for this gateway | An Analysis named NCD Sensor Configuration. |
| Trigger | runs the validator whenever someone applies a change | An Action named NCD Sensor Configuration. |
| Dashboard | where your team picks a sensor and changes its settings | A dashboard labelled NCD Sensor Configuration carrying the widget. |
Each item carries a state chip:
| Chip | Meaning |
|---|---|
| Ready | Present and current. |
| Working… | Being created. TagoIO bundles an Analysis after accepting it, so the validator legitimately sits here for a while. |
| Waiting | Blocked on something else finishing first. |
| Failed | The reason replaces the description text on that row. |
| Not created | Does not exist yet. |
The buttons
- Set up in TagoIO — shown when nothing has been provisioned. Creates all four. This is the first thing the app ever writes to your TagoIO account.
- Check and repair — replaces the above once provisioned. Safe to press twice, and the way to retry a stalled bundle. It rebuilds anything that has gone missing, including an Analysis you deleted by hand.
- Open dashboard — opens the TagoIO dashboard in a new tab.
- Remove from TagoIO — confirms inline to Delete the validator and trigger. As the note beside it says, the dashboard, its widget and every sensor stay exactly as they are.
With nothing enabled yet, the card notes: Enable a sensor on the Devices page and the dashboard will pick it up within a minute.
The three counters
| Counter | Meaning |
|---|---|
| Sensors on TagoIO | How many mapped sensors this page is tracking. Only devices that exist in TagoIO appear. |
| Changes pending | Requested settings not yet applied — those queued or waiting for a sensor. |
| Schemas published | How many sensors have had their settings list delivered to TagoIO. A dashboard form cannot be built for a sensor until this has happened. |
Schemas published being lower than Sensors on TagoIO is normal for a short while after enabling a sensor, and is the usual reason a widget shows no form yet.
Per-sensor cards
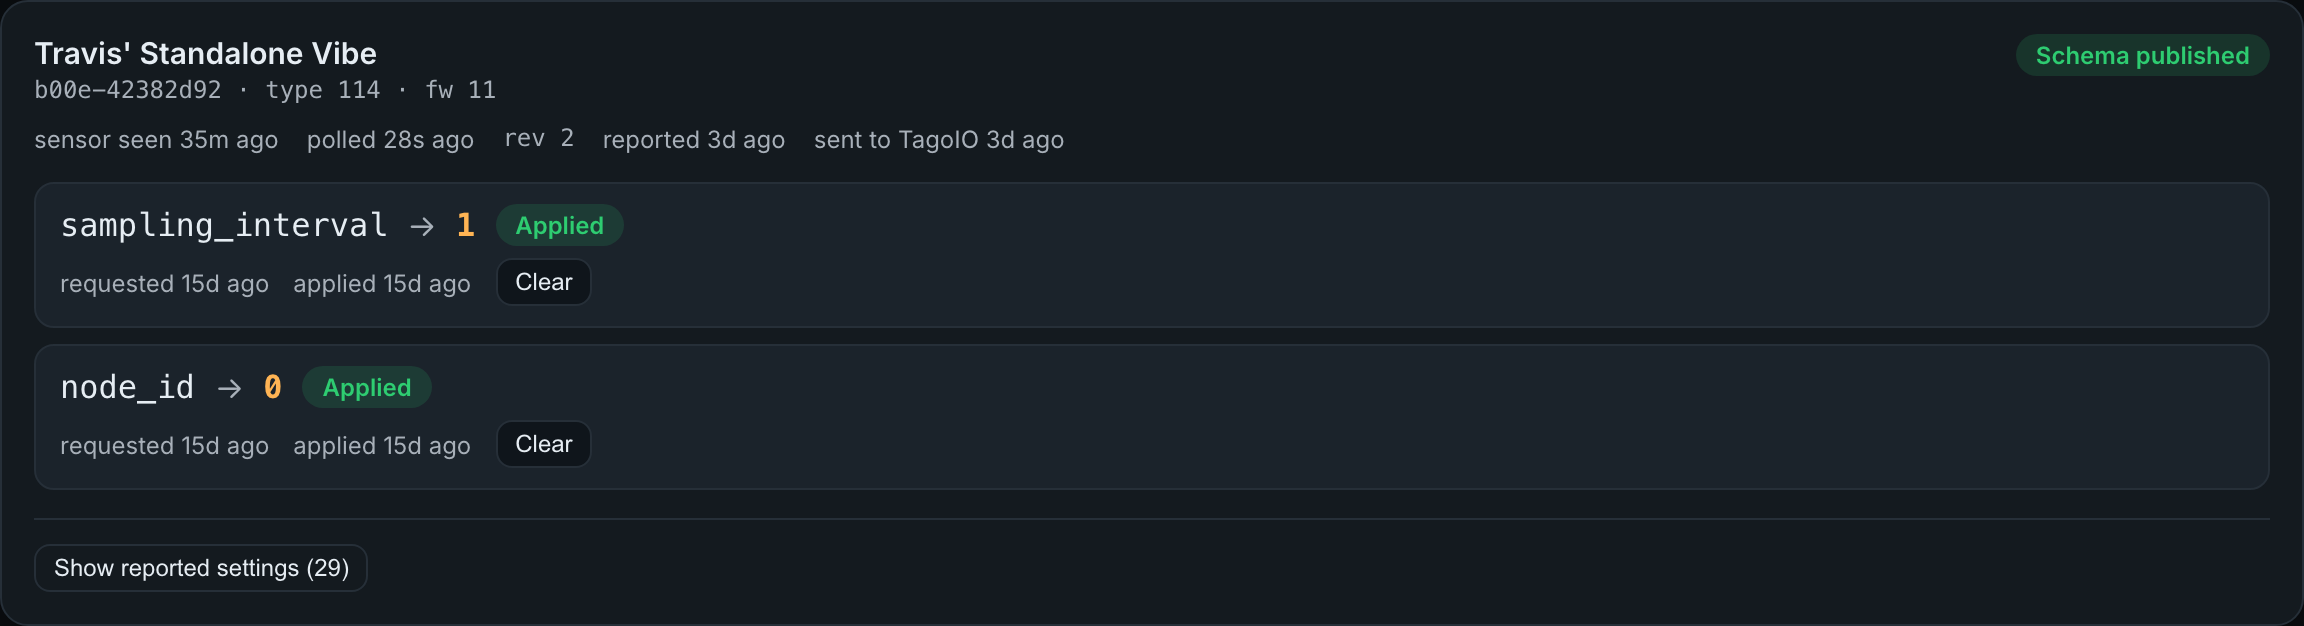
Each mapped sensor gets a card headed with its name, then its serial, sensor type and firmware version.
The schema chip
| Chip | Meaning |
|---|---|
| Schema published | The gateway knows this sensor type’s settings and TagoIO has the current list. |
| Schema pending | The gateway knows the settings but TagoIO does not have the current list yet. |
| No schema | The gateway has not read this sensor type’s options yet, so it will not forward changes at all — it refuses to send values it cannot validate. This resolves on its own once the ingestion daemon has seen the sensor. |
The timing line
Five values, and they mean genuinely different things:
| Value | Meaning |
|---|---|
| sensor seen | When the sensor last checked in over the radio. A change cannot be delivered until this happens again. |
| polled | When the gateway last checked TagoIO for requested changes for this sensor. |
| rev | The revision counter the gateway has processed. It moves when someone applies a change in TagoIO. |
| reported | When the sensor last told the gateway what its settings actually are. |
| sent to TagoIO / not sent to TagoIO yet / nothing to send yet | Whether TagoIO holds that reported set. This is deliberately separate from reported, because a sensor reporting successfully while TagoIO never receives the values looks identical otherwise — and is exactly the case where a widget shows a form with no current values. |
Reported settings
Show reported settings (n) expands the sensor’s current configuration as the sensor itself reports it. This is ground truth from the hardware, not what was requested.
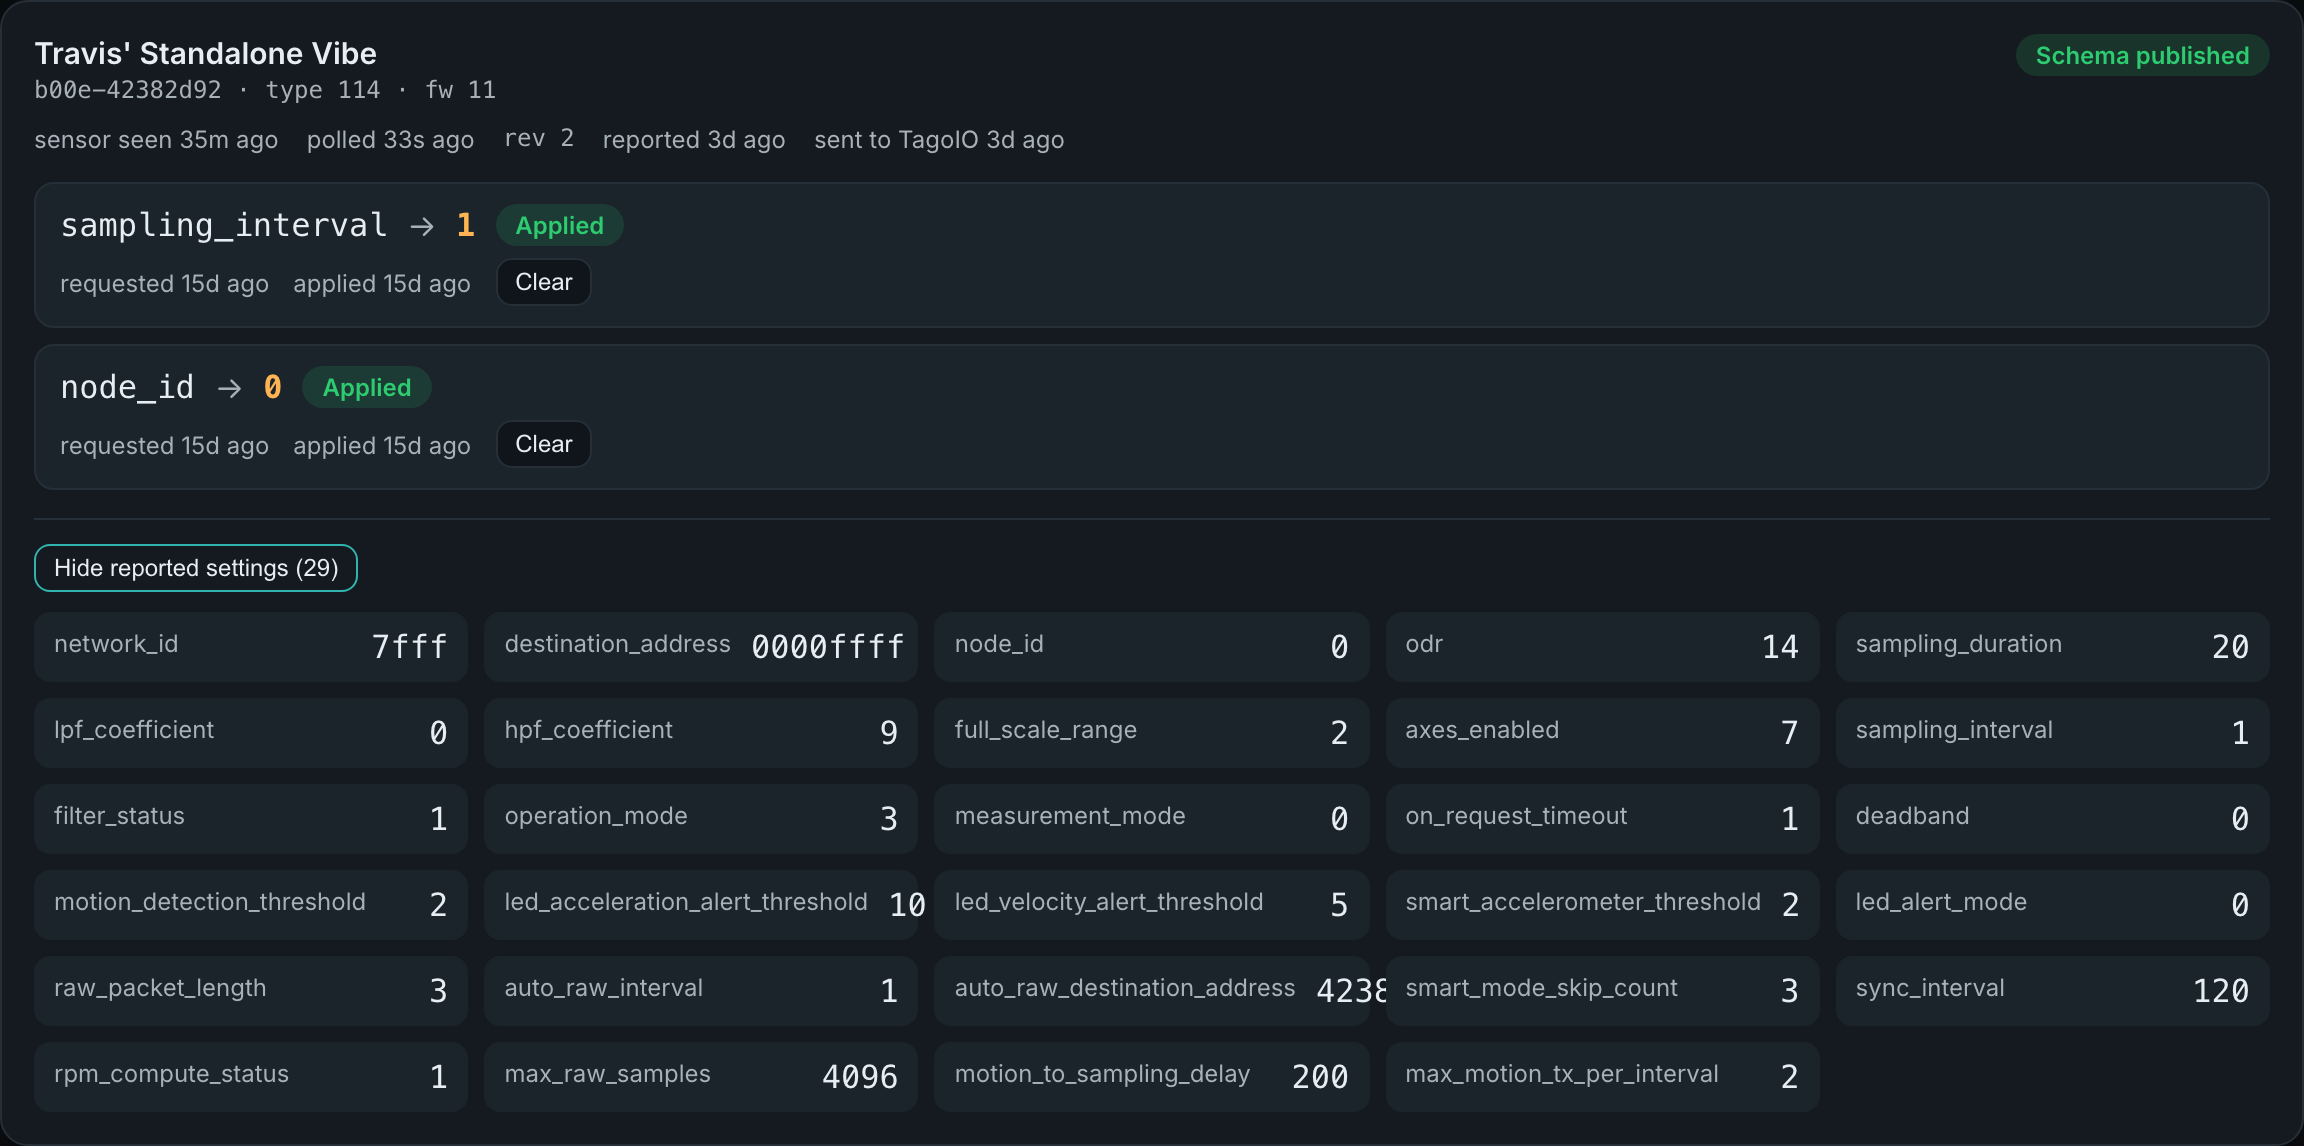
The life of a change
Each requested setting appears as a row reading setting → value with a state chip, when it was requested, and when it was applied.
| Chip | Meaning |
|---|---|
| Queued | Collected from TagoIO and validated, waiting to be sent to the radio. |
| Waiting for sensor | Handed to the radio. The sensor has not confirmed it yet. |
| Applied | The sensor confirmed the change. If it also shows confirming to TagoIO…, the acknowledgement has not reached TagoIO yet, so a dashboard may still show it as pending for a moment. |
| Rejected | The value did not pass validation against the sensor’s own options. The reason is shown beneath the row. |
Clear on a row abandons that request. Use it for a change that is stuck — typically a sensor that is no longer reachable. The app confirms Cleared <setting>. and also tells TagoIO, so the dashboard stops showing it as pending.
When a sensor has nothing outstanding, the card reads No configuration changes requested from TagoIO.
08Settings
Four panels, each with its own Save button. Saving one panel does not affect the others.
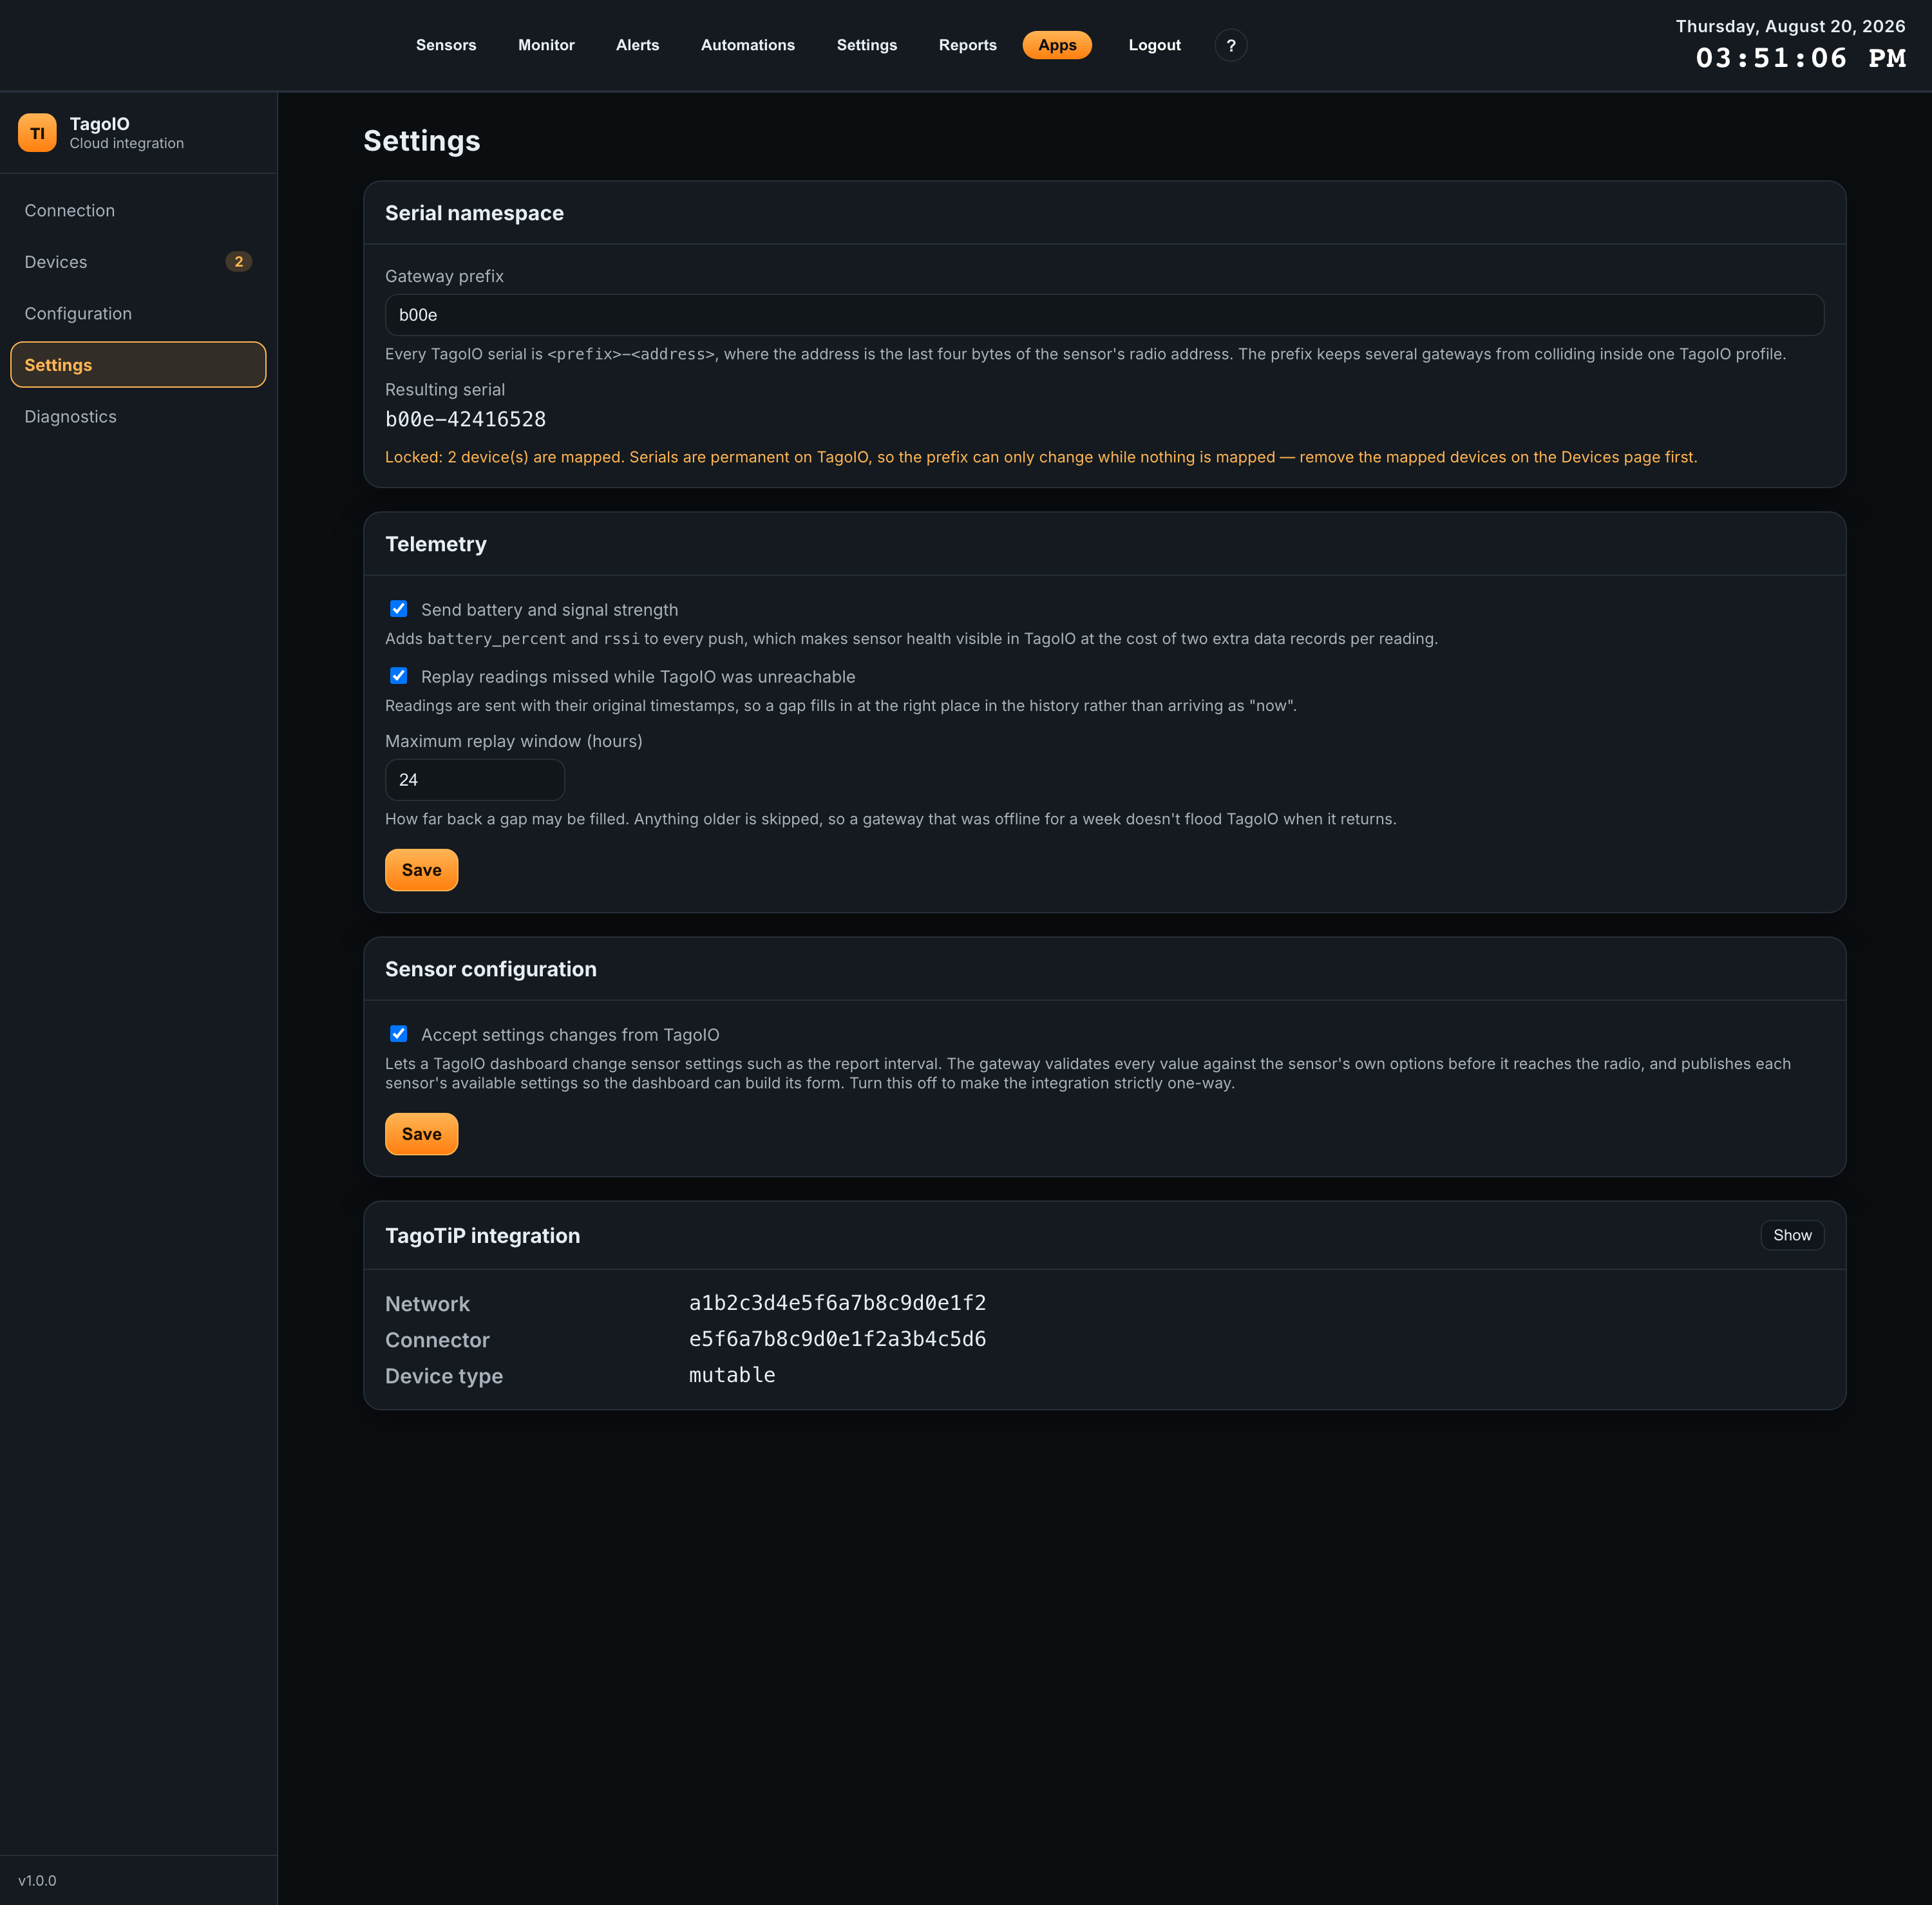
Serial namespace
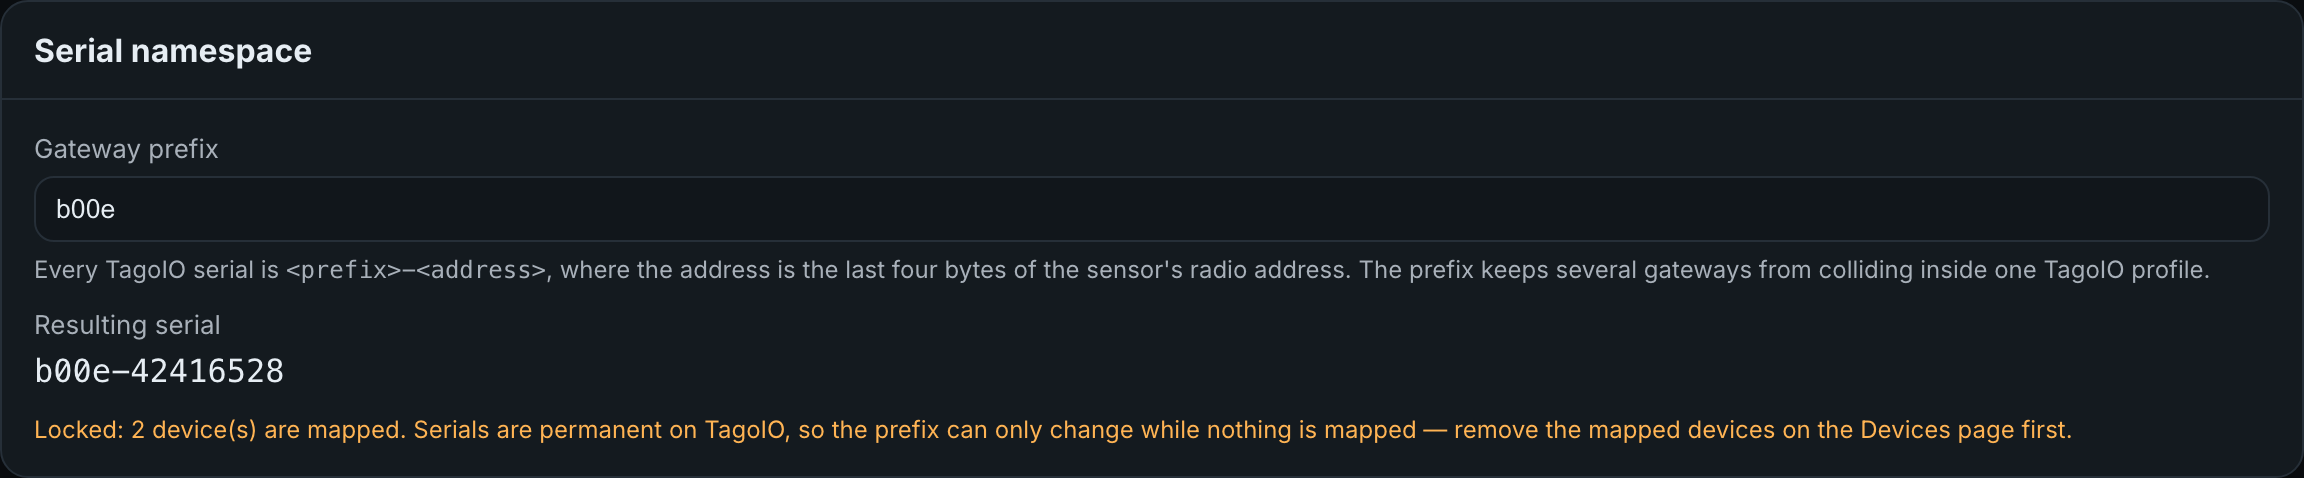
Every TagoIO serial is <prefix>-<address>, where the address is the last four bytes of the sensor’s radio address. The prefix keeps several gateways from colliding inside one TagoIO profile.
| Field | Detail |
|---|---|
| Gateway prefix | Derived at install from the last word of the gateway’s name — “Gateway B00E” becomes b00e. Editable only while nothing is mapped. The value is lower-cased, characters outside a-z 0-9 _ – become a hyphen, and leading and trailing hyphens are dropped. |
| Resulting serial | A live preview built from a real sensor on this gateway, so you can see the effect before saving. |
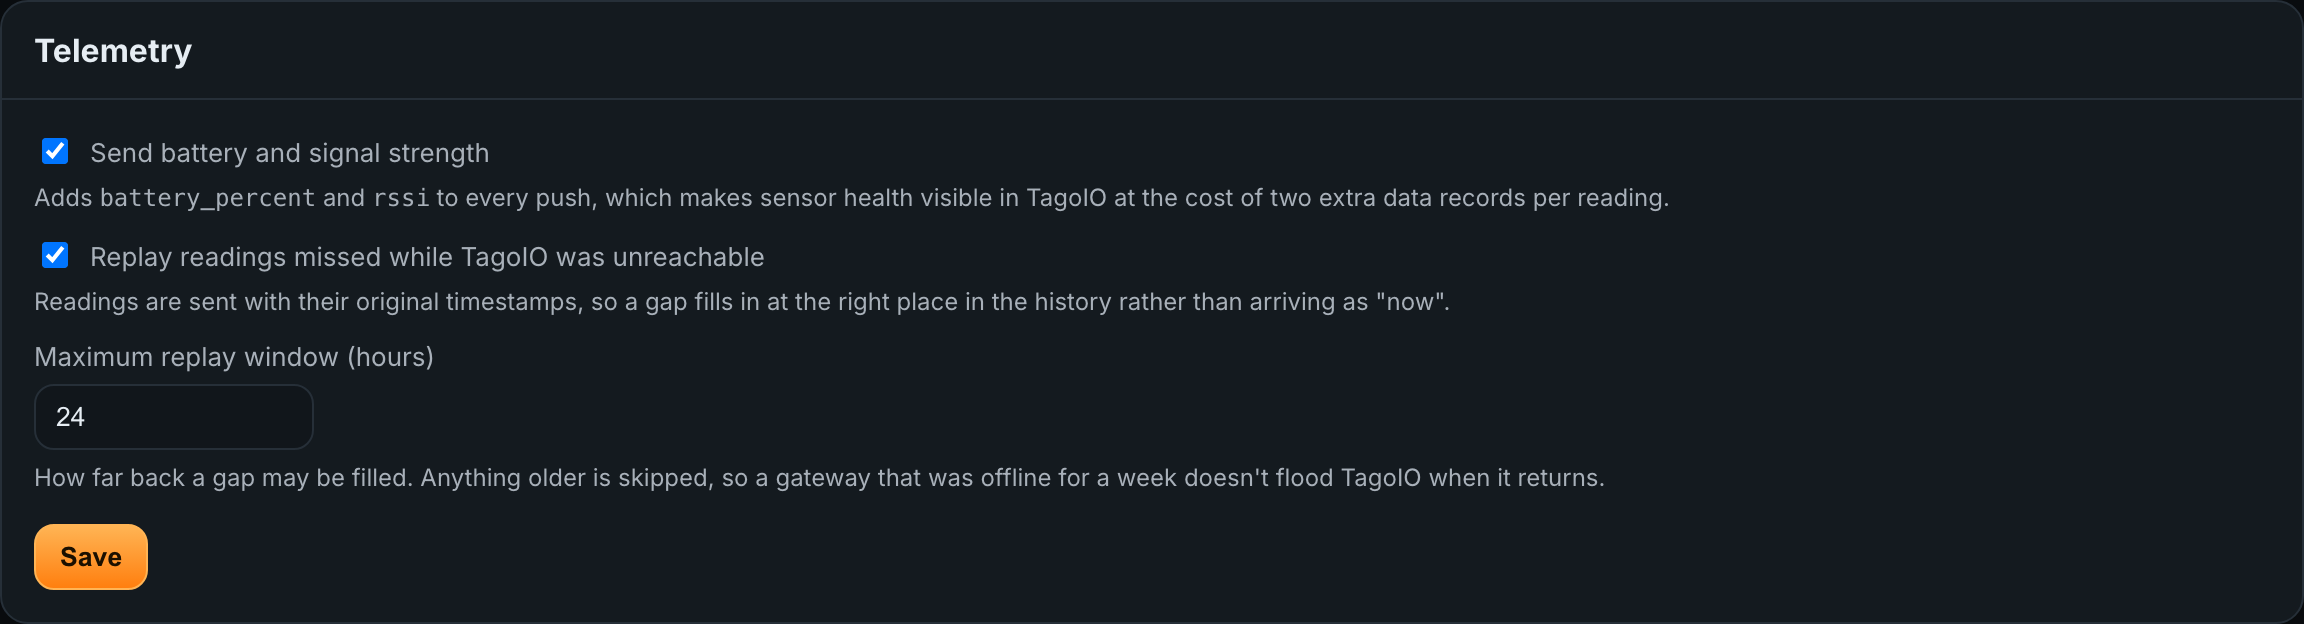
Telemetry
| Setting | Default | Effect |
|---|---|---|
| Send battery and signal strength | On | Adds battery_percent and rssi to every push. Makes sensor health visible in TagoIO at the cost of two extra data records per reading. Turn it off to reduce TagoIO consumption. |
| Replay readings missed while TagoIO was unreachable | On | Readings are sent with their original timestamps, so a gap fills in at the right place in the history rather than arriving as “now”. |
| Maximum replay window (hours) | 24 | How far back a gap may be filled, from 1 to 168 hours. Anything older is skipped, so a gateway offline for a week does not flood TagoIO when it returns. Disabled while replay is off. |
Sensor configuration

Accept settings changes from TagoIO (default on) lets a TagoIO dashboard change sensor settings such as the report interval. The gateway validates every value against the sensor’s own options before it reaches the radio, and publishes each sensor’s available settings so the dashboard can build its form.
Clear it to make the integration strictly one-way — readings out, nothing in. Set up in TagoIO is refused while it is off.
TagoTiP integration
Collapsed by default behind a Show button, because these are fixed TagoIO platform ids for TagoTiP over HTTP. As the panel warns: change them only if TagoIO asks you to — a wrong value makes every device creation fail.
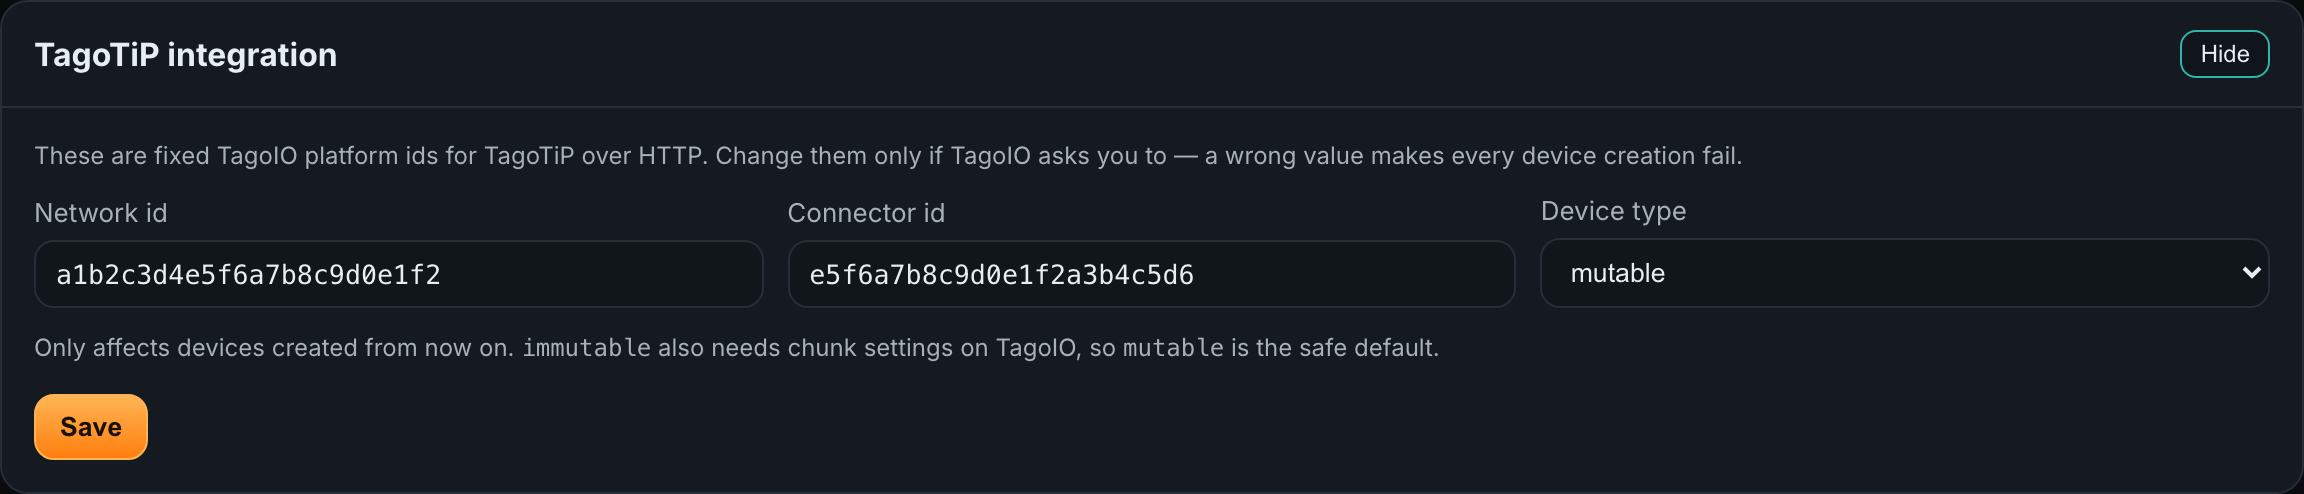
| Field | Detail |
|---|---|
| Network id | The TagoIO network id for TagoTiP over HTTP. |
| Connector id | The matching connector id. |
| Device type | mutable (default), immutable or hybrid. Only affects devices created from now on. immutable also needs chunk settings on TagoIO, so mutable is the safe default. |
09Diagnostics
Diagnostics shows exactly what the gateway sent to TagoIO, straight from the ingestion daemon. Use it to confirm whether a variable is being published before hunting for it in a TagoIO dashboard.
Live push status

| Counter | Meaning |
|---|---|
| TagoIO link | Ready or Not connected — whether the daemon has usable credentials. |
| Reporting sensors | How many sensors the daemon is watching for. |
| Frames seen | Sensor frames received for those sensors. |
| Pushed | Frames successfully delivered to TagoIO. |
| Failed | Frames TagoIO rejected or that could not be delivered. |
| Battery / signal | Included or Off, reflecting the Telemetry setting. |
Recent pushes
The last 25 pushes, newest first. Each entry shows the outcome chip (Sent, or the failure code), the serial, the time, and how many values the push carried. Beneath that is the actual TagoTiP payload, with each variable name and value shown as its own pill so you can pick a name out of the frame.
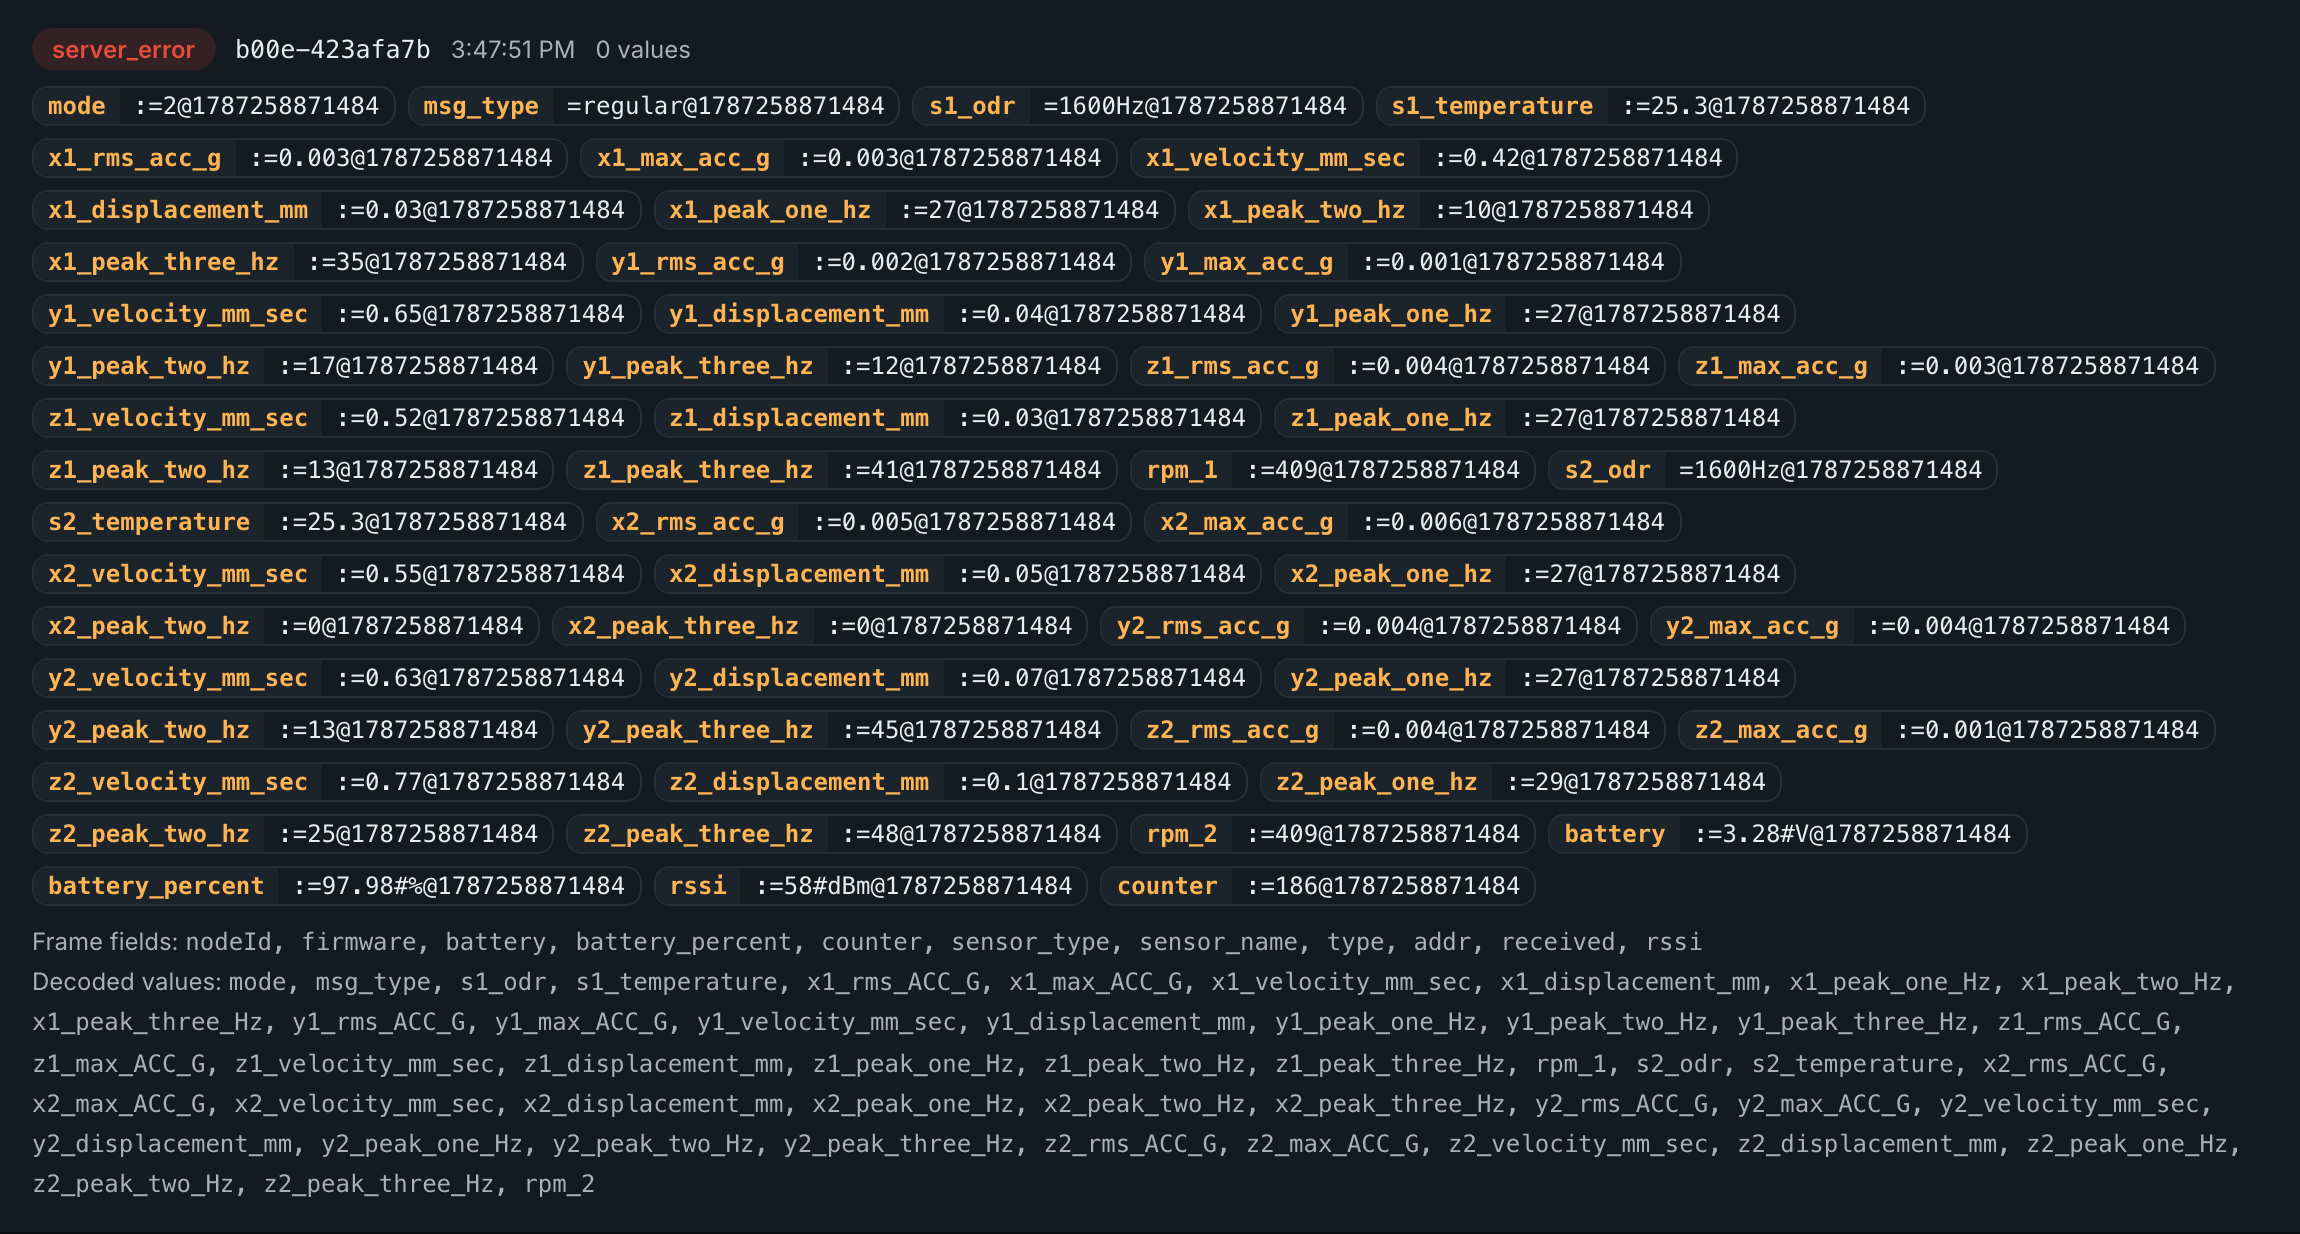
Two lists follow each payload, and the difference between them is the point:
- Frame fields — the metadata the sensor’s frame carried, such as battery, RSSI and counter. Sensors disagree about which of these they send.
- Decoded values — the measurements the sensor’s decoder produced.
If a variable you expect is missing from a TagoIO dashboard, check here first. A name absent from both lists was never sent by the sensor, which is a sensor or decoder question rather than a TagoIO one.
With nothing to show, the panel reads No frames pushed yet. Enable a sensor on the Devices page and wait for its next report.
10Changing Settings from TagoIO
This section is the TagoIO side of the integration — the dashboard the gateway built for you in step 4 of First-Time Setup, and what your team does with it.
Open it from Configuration → Open dashboard, or find the dashboard named NCD Sensor Configuration in your TagoIO account.
The widget
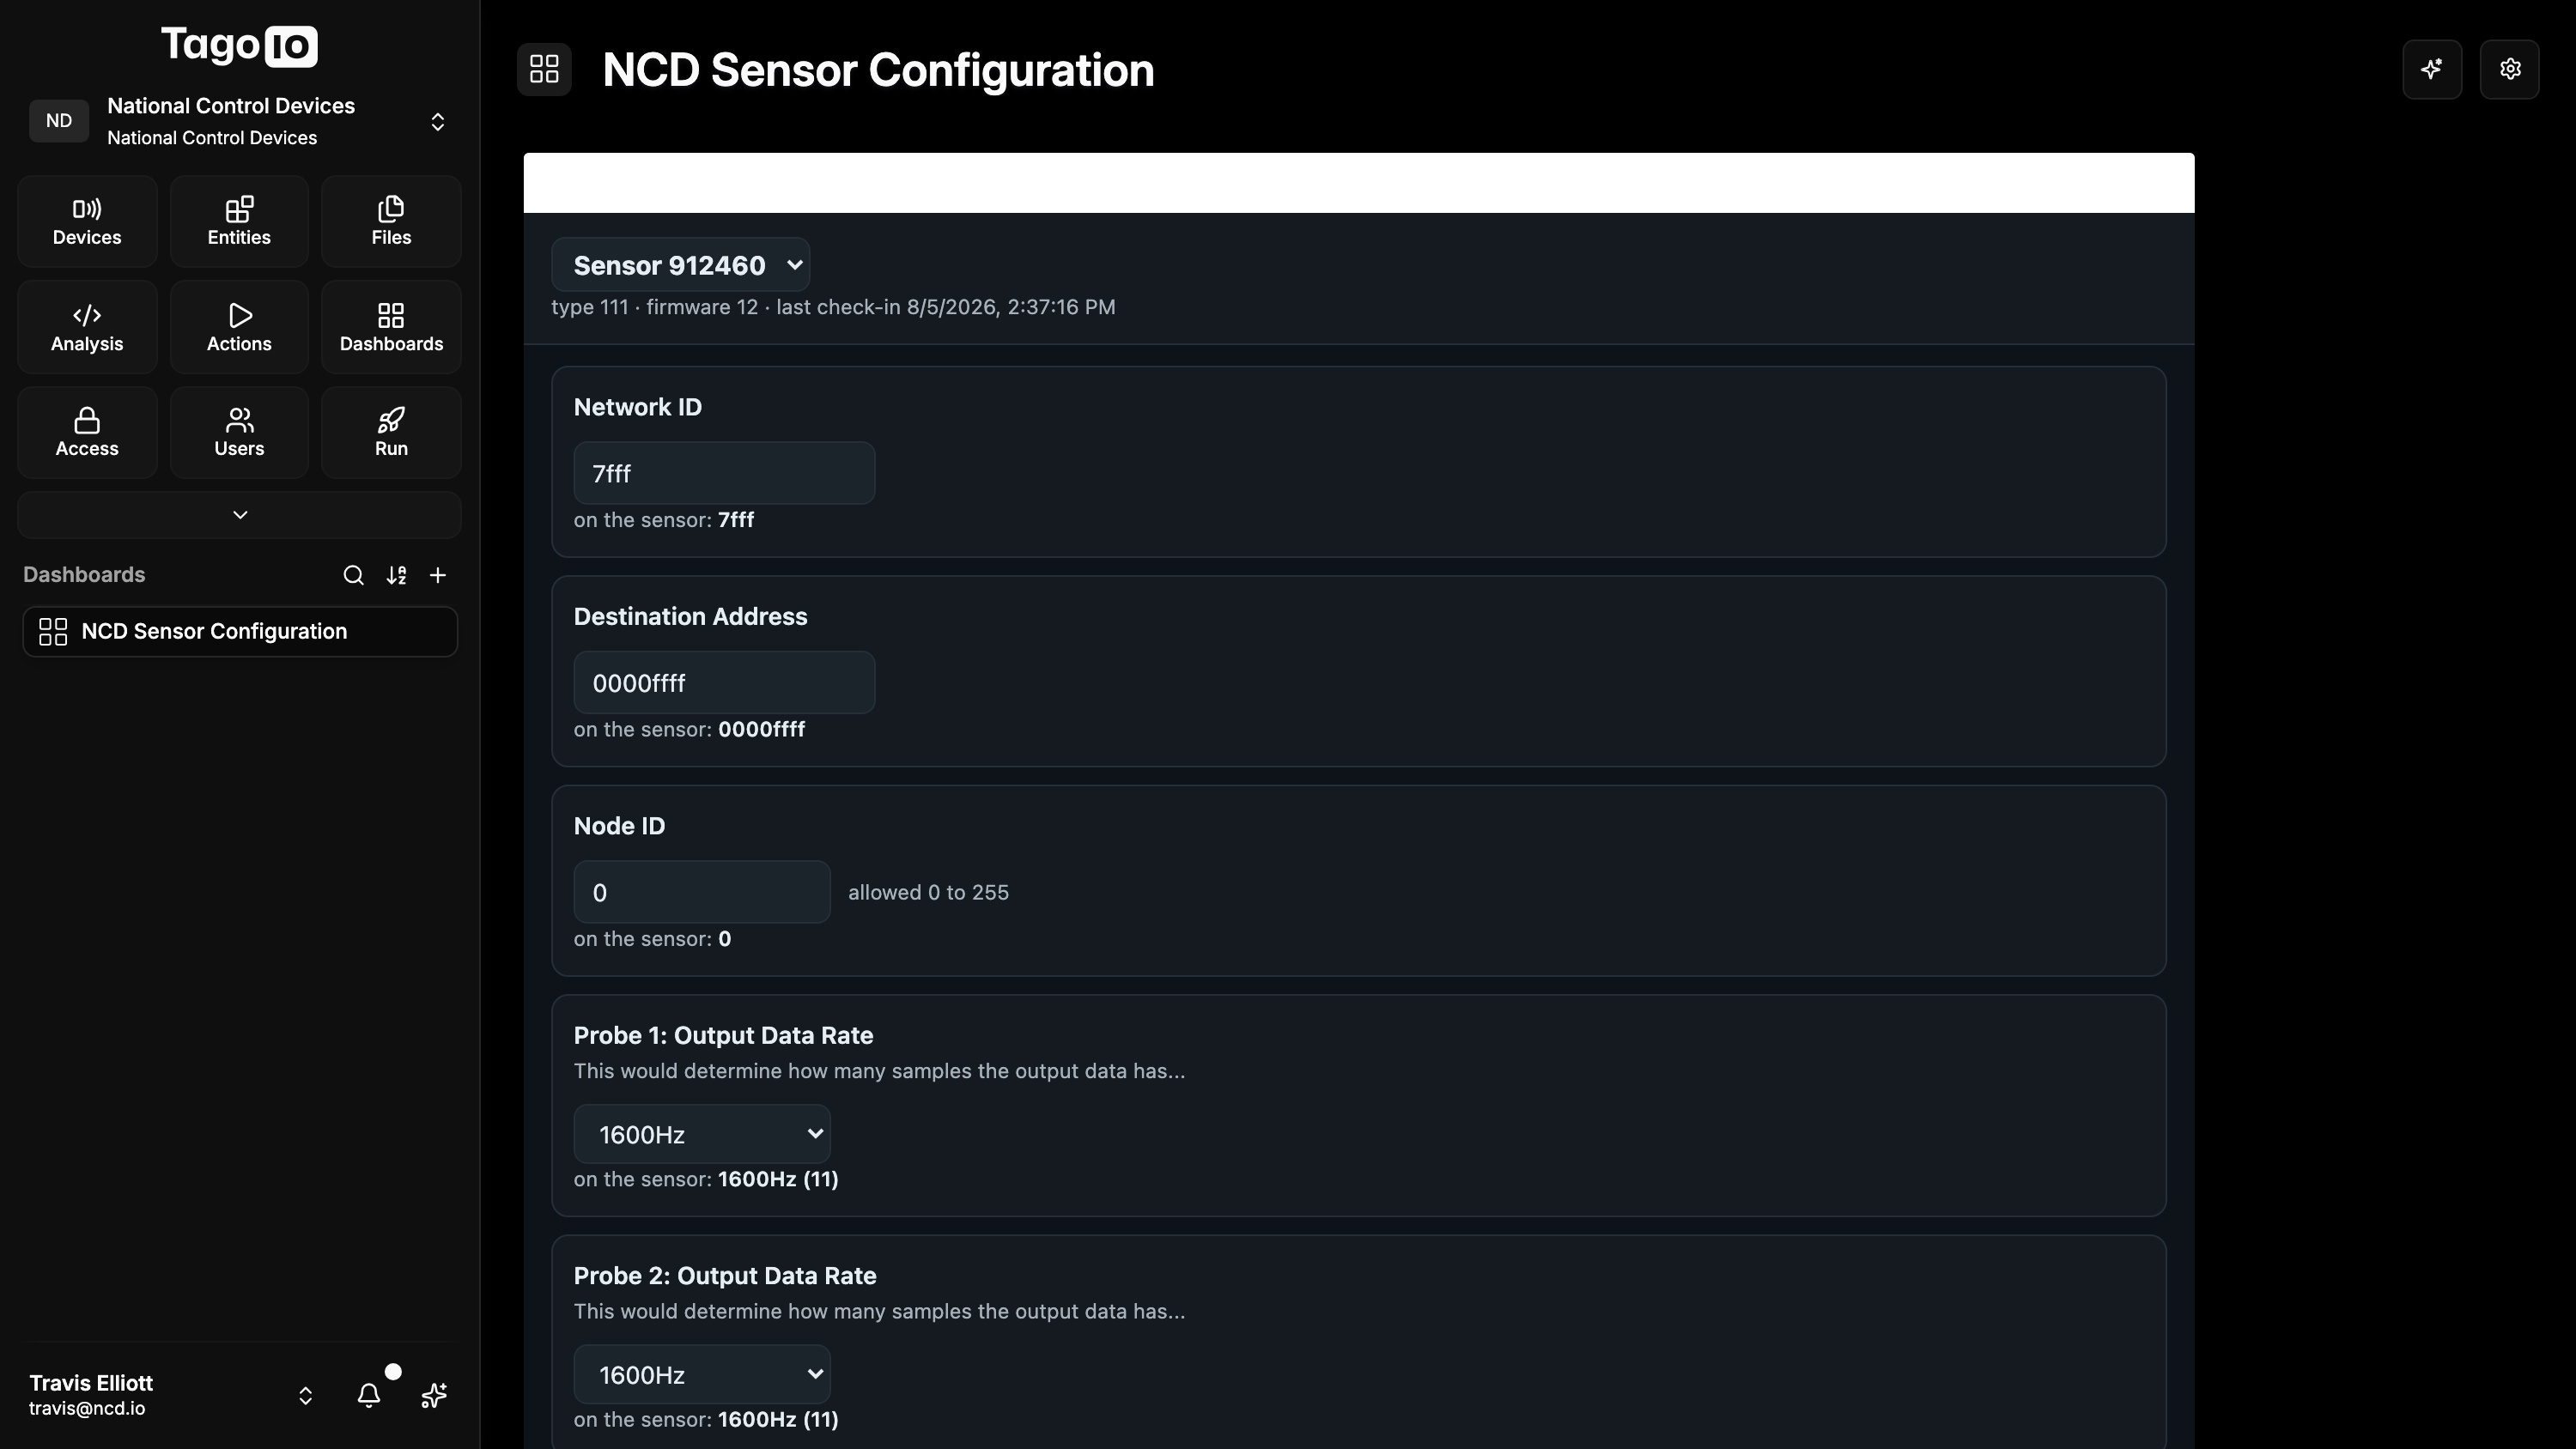
The dashboard carries one custom widget. When more than one sensor is bound to it, the widget’s title is replaced by a sensor picker, so one widget serves the whole fleet rather than needing one per sensor.
Under the picker is a line reading the sensor’s type, firmware version and last check-in time. That header stays pinned while the settings list scrolls, so you always know which sensor you are editing.
Below it is a form built from that sensor’s own settings list — which is why the gateway publishes the schema, and why a new firmware’s settings appear without anyone updating a dashboard. Each row carries up to five things:
| Part of the row | Example | What it tells you |
|---|---|---|
| Title | Sampling Interval | The setting’s name. |
| Description | Set how often will the sensor transmit measurement data. | What the setting does. Comes from the sensor, not from this app. |
| Input | A dropdown, or a number or text box | A dropdown for a fixed set of choices, otherwise a typed value. |
| Allowed range | allowed 0 to 255 | The limits the sensor itself declares. A value outside them is refused. |
| on the sensor: | on the sensor: 5 Minutes (0) | The value the sensor currently reports — ground truth, not what was requested. For a choice, the label is shown with its underlying code in brackets. |
Applying a change
-
1
Pick the sensorUse the picker at the top of the widget. Options are listed alphabetically.
-
2
Edit the settings you want to changeA count of unsaved edits appears next to the button that acts on them.
-
3
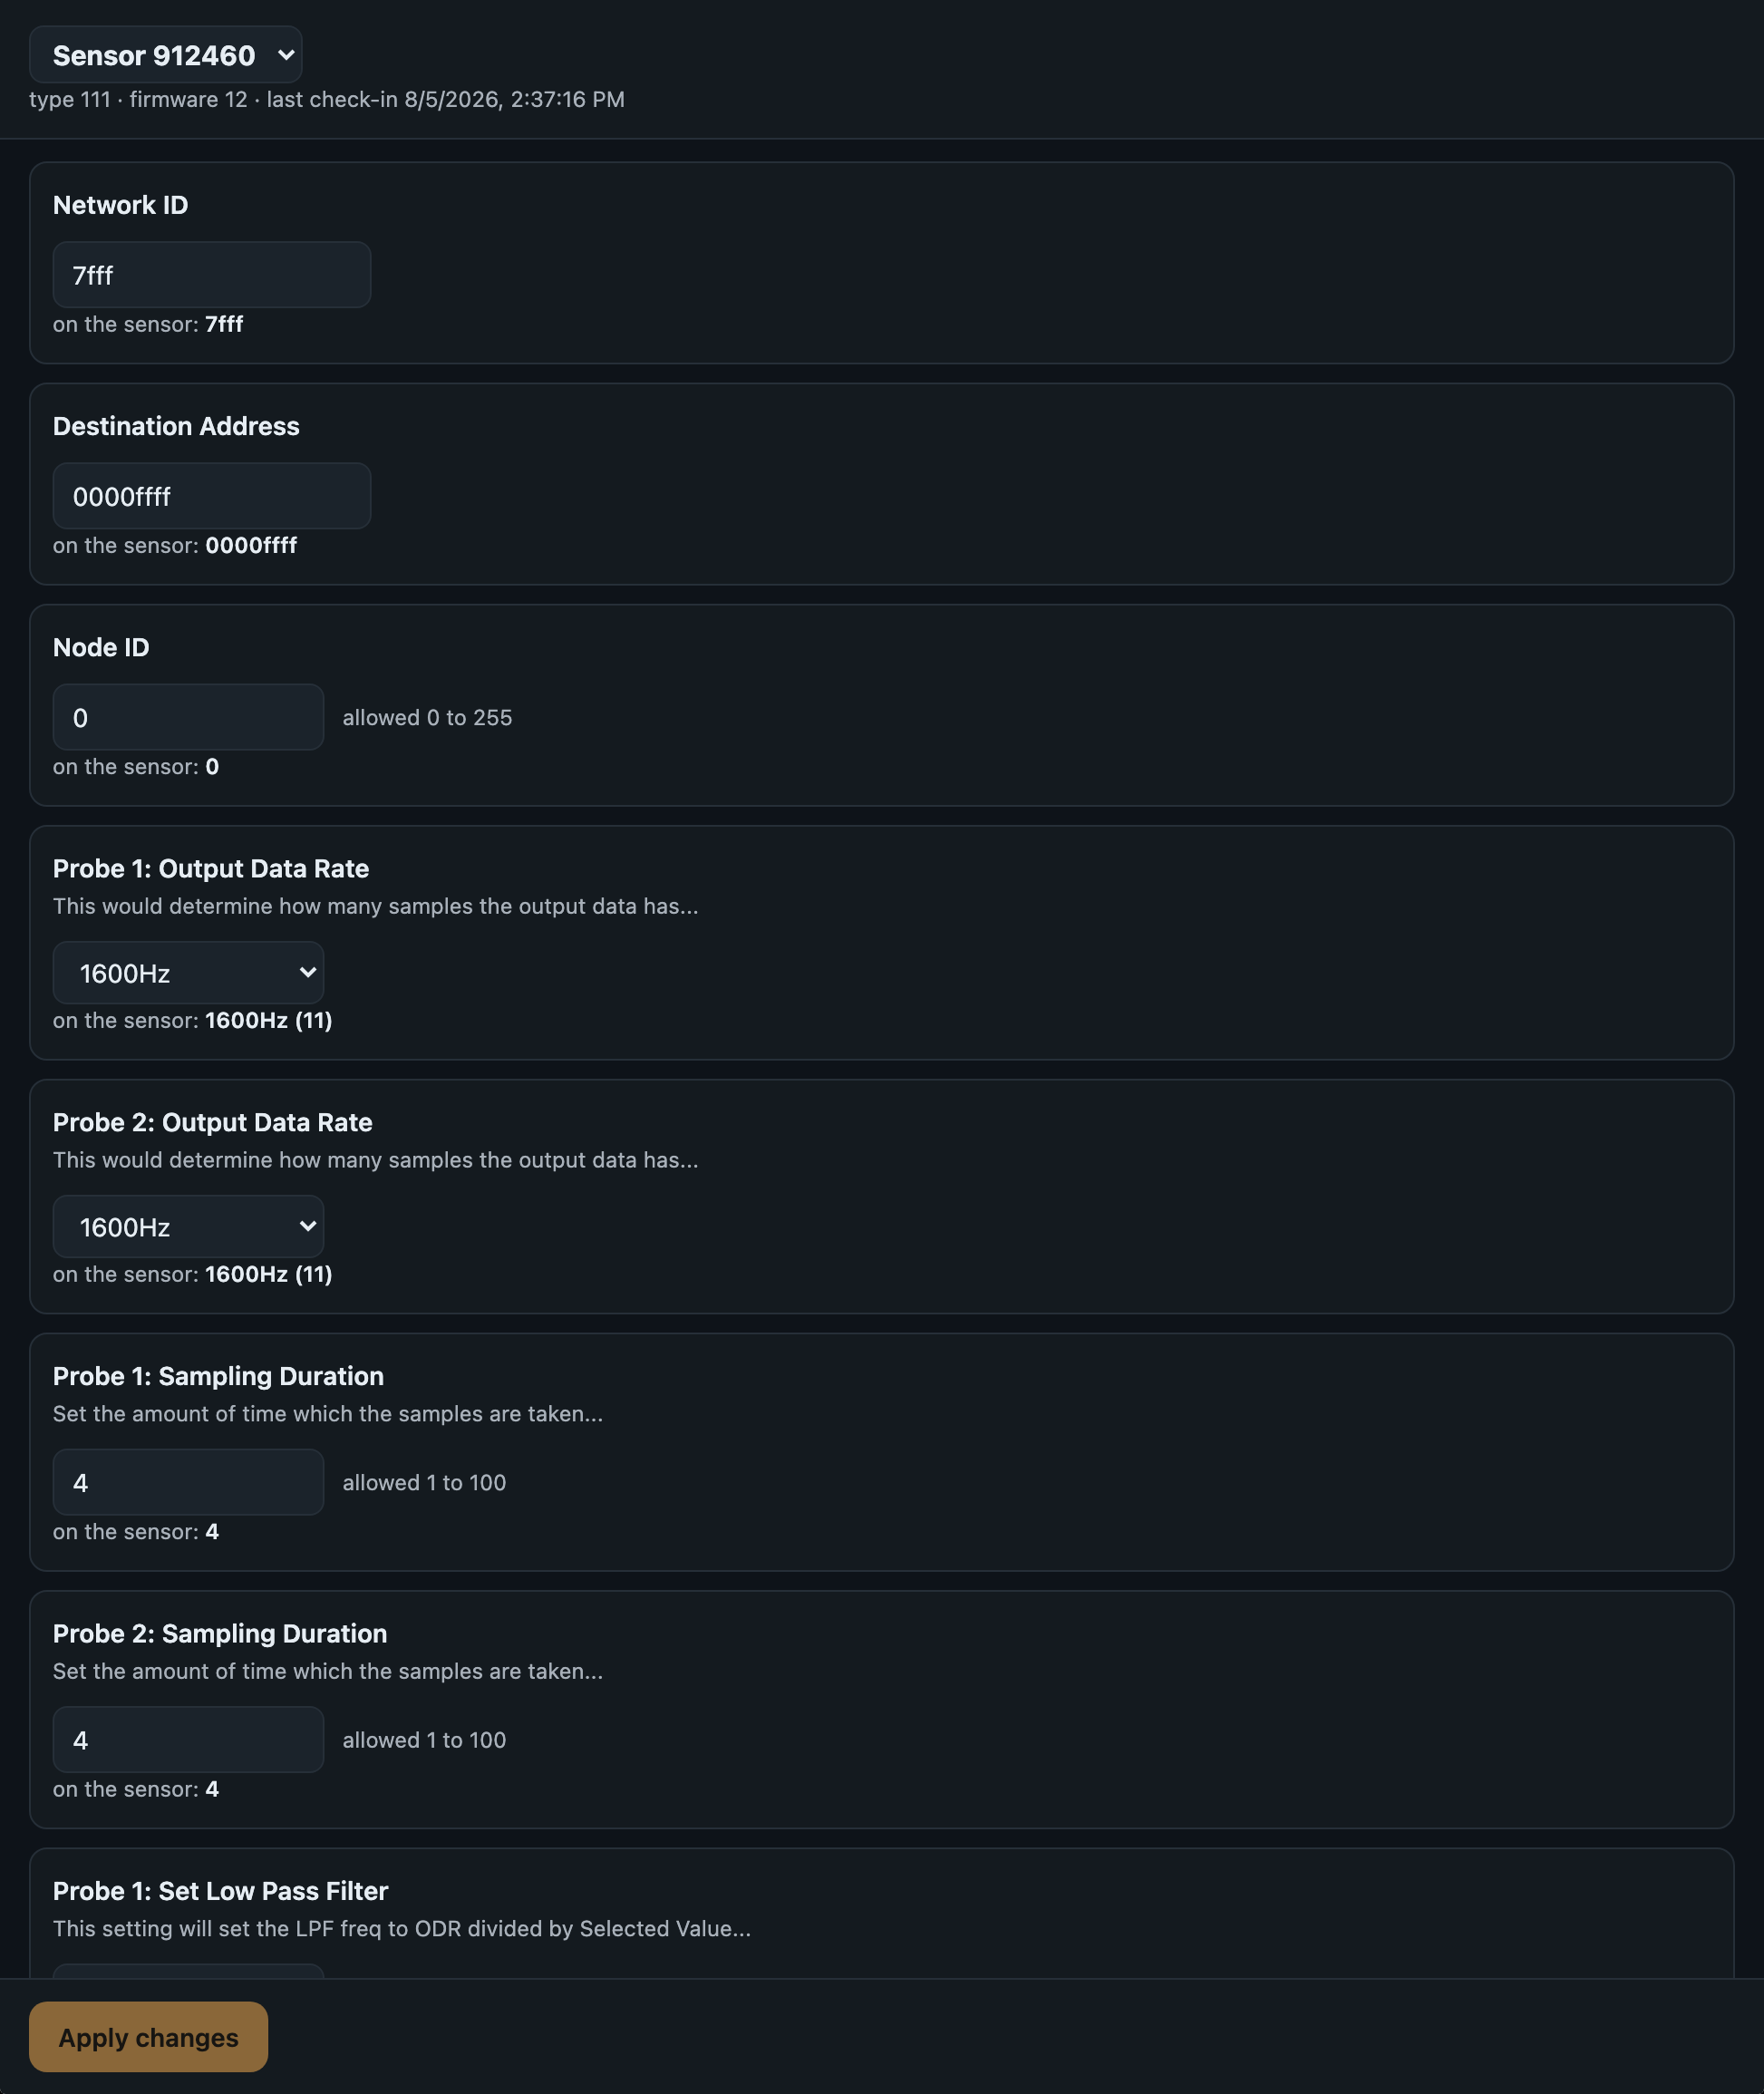
Click Apply changesThe button sits at the bottom of the widget and stays reachable however long the settings list is. It reads Sending… while it works. A Discard button appears next to it only once you have unsaved edits, and abandons them.
-
4
Wait for the sensor’s next check-inThe widget shows the change as pending until the sensor confirms it, typically one report interval.
Messages the widget shows
| Message | What it means |
|---|---|
| Waiting for this sensor’s settings list. | The schema has not arrived yet. The gateway publishes it shortly after the sensor is enabled for TagoIO. Check Schemas published on the Configuration screen. |
| Waiting for the sensor to wake up and take … | The change was accepted and is pending on the hardware. Normal. |
| Change sent to … | The request reached the gateway. |
| Could not send the change: … | The write failed. The reason follows. |
| Could not read this device’s data: … | The widget could not read the device. If it persists, check that the widget is bound to the config_schema variable. |
| A refusal mentioning Invalid variable | TagoIO rejected the write. This usually points at the widget’s variable bindings rather than at the gateway. |
| The picker shows Sensor 912460 rather than a name | No name reached the widget for that device, so it falls back to the last six characters of the TagoIO device id. Those six characters are what TagoIO shows in the ID column under Devices, so you can still identify the sensor there. Naming the sensor in Atrium fixes the label on the next metadata sync. |
11What the Gateway Publishes
What arrives in TagoIO, and what it is called. This is the section to read before building a dashboard or an Access Management rule.
Device identity
| Property | Value |
|---|---|
| Serial | <prefix>-<address>, for example b00e-42416528. The address is the low four bytes of the 64-bit radio address, since all such addresses share the same leading bytes. Permanent once the device exists. |
| Name | The sensor’s Atrium name, falling back to its decoder name and then its device id. |
Telemetry variables
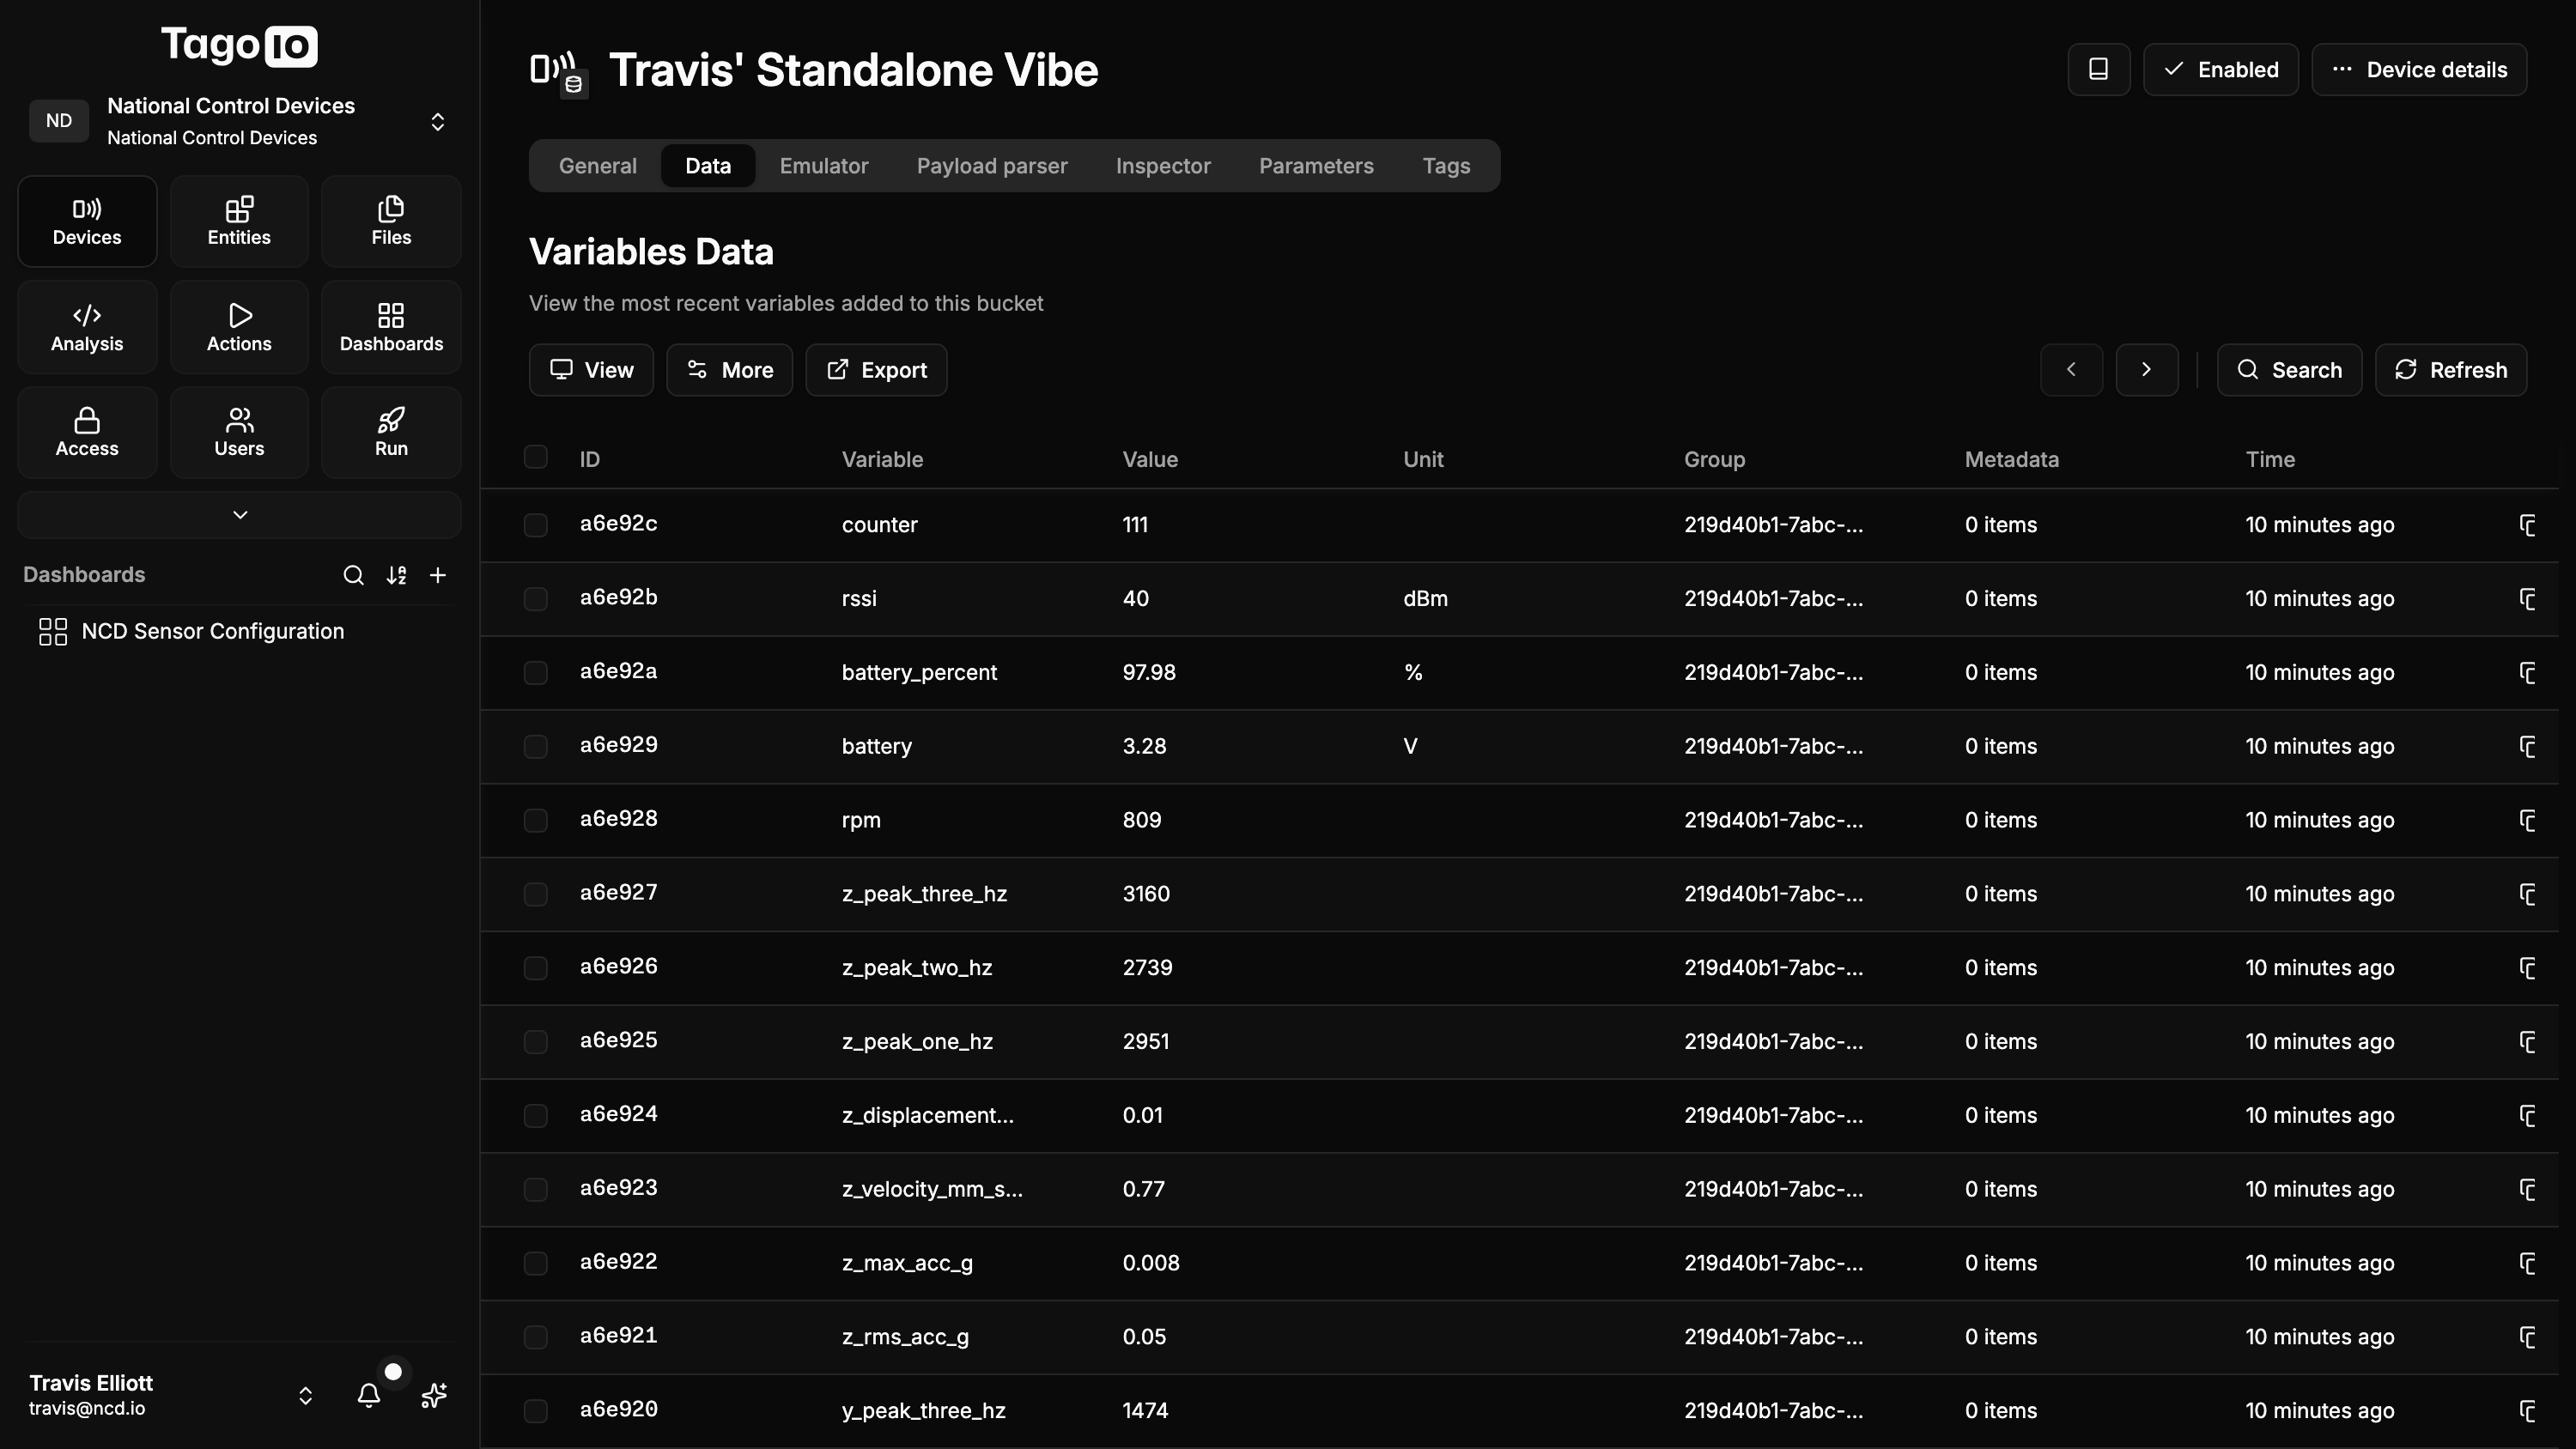
Each sensor frame becomes one TagoTiP group. Decoded values keep the names Atrium normalizes them to, so live and replayed values land on the same TagoIO variable. Numeric strings are converted to numbers so TagoIO can chart them; booleans stay booleans.
Alongside the decoded values, whichever of these the frame carried is sent:
| Variable | Unit sent | Notes |
|---|---|---|
| battery | V | Volts. Sent by sensors that report voltage. |
| battery_percent | % | Only with Send battery and signal strength on. |
| rssi | dBm | Only with Send battery and signal strength on. |
| counter | none | The frame counter. |
| humidity | % | Where the sensor reports it. |
Sensors disagree about which frame fields they report, so whichever are present are sent rather than a fixed set being assumed. If a decoder already reports a value itself, that wins over the frame-level copy, so nothing is published twice.
Device tags
The app maintains ten tags, against a TagoIO limit of 30 per device — leaving room for your own. Tag values are always strings, and an empty value is omitted rather than sent blank.
| Tag | Source |
|---|---|
| atrium_managed | Always 1. Scope a TagoIO Action or Access Management rule to every sensor your Atrium fleet manages. |
| atrium_device_id | The sensor’s radio address. |
| atrium_gateway | The serial prefix from Settings. |
| atrium_gateway_mac | The gateway’s modem MAC. Stable even if the prefix is renamed. |
| atrium_sensor_type | The Atrium sensor type number. |
| atrium_sensor_type_name | Atrium’s name for that sensor type, including the type number — for example 114 – Standalone Smart Vibration Sensor v4. |
| atrium_location | The sensor’s location in Atrium. |
| atrium_asset | The sensor’s asset in Atrium. |
| atrium_firmware | The sensor’s firmware version. |
| atrium_install_date | The install date recorded in Atrium. |
Battery, RSSI, last-seen and status are deliberately not tagged. They change constantly, and keeping them accurate would mean an API write per reading; they are published as variables instead.
Device tokens
Each device the app creates carries two tokens. TagoIO’s own Default token holds the device’s serial number, and the app adds one named atrium-app, which is what it uses to write data. Leave both in place — deleting atrium-app stops that device receiving its configuration records until the gateway mints a replacement.
Configuration variables
These exist only when sensor configuration is enabled, and are what a widget binds to.
| Variable | Carries |
|---|---|
| config_schema | The sensor type’s settable settings, so a dashboard can build its form. |
| config_reported | The settings the sensor last reported. |
| config_desired | A display-only mirror of what is outstanding, so a widget can show pending edits beside current values. |
12Atrium Integration
What the app reads from the gateway, what it writes, and how it relates to the rest of Atrium.
What it reads
- Gateway configuration — model, name and modem MAC, used for the serial prefix and the gateway tags.
- Sensors and their metadata — the sensors Atrium has set up, with their names, locations, assets, firmware, last-seen and battery, for display and for the TagoIO tags.
- Readings — only when replaying a gap, and always narrowed to one sensor, one metric and a bounded time range.
- Sensor frames as they arrive — the live push path.
- Sensor settings options — each sensor type’s settable settings, used both to publish the schema and to validate an incoming value.
What it writes
- Nothing in Atrium’s own data. The app writes only its own database, and requests sensor settings changes through the platform’s device twin — the same mechanism Atrium’s own screens use.
- Credentials are encrypted at rest by the platform’s secret store. They are never returned by the app’s API and never written to logs; only a four-character tail of the profile token is ever displayed.
Where changes come from
Atrium keeps a Desired and a Reported set of settings per sensor and pushes the difference when the sensor checks in. TagoIO edits Desired and displays Reported; it never talks to a sensor directly. That means a settings change made in Atrium and one made in TagoIO go through the same path, and the Configuration screen will pick up a change made outside this app.
13Troubleshooting
Symptoms in the order you are likely to meet them. In general: the Connection screen tells you whether credentials work, the Devices screen whether TagoIO devices exist, and Diagnostics whether readings are actually leaving the gateway.
Connecting
| Symptom | Cause | Fix |
|---|---|---|
| TagoIO rejected the profile token | The token is wrong, revoked, or from a different region. | Generate a fresh profile token in TagoIO and check the Region selector matches your account. |
| authorization must be either a 16-character Token Hash or an Authorization Token | The Authorization field does not match either accepted format. | Paste the whole authorization token (at plus 32 hex characters) or exactly its 16-character hash. No other value is accepted. |
| Could not reach TagoIO | The gateway has no outbound path to TagoIO. | Check the gateway’s internet connection, DNS, and that outbound HTTPS to *.tago.io is not blocked. |
| Connect succeeds but Test telemetry endpoint fails | The profile token is good and the authorization is not. They are separate credentials. | Regenerate the authorization in TagoIO under Devices → Authorization, format TagoTiP(s), and paste it again. |
| This token belongs to a different profile | Devices already exist in another profile and TagoIO cannot move them. | Either generate a token inside the original profile, or accept Relink and let the devices be recreated. See Profiles. |
Devices
| Symptom | Cause | Fix |
|---|---|---|
| A sensor is missing from the Devices list | The list only shows sensors Atrium has already set up. | Complete Sensors → Set Up in Atrium for that sensor, then come back. |
| A device stays Pending | TagoIO was unreachable, or the creation is being retried with backoff. | Wait — retries run every 60 seconds, backing off to at most an hour. Retry pending forces an attempt now. If it never succeeds, use Verify now on the Connection screen. |
| Serial ‘…’ is already in use | Another mapping already holds that serial. | Find the device holding it (filter by serial) and Remove it, which is the only way to free a serial. |
| State Failed mentioning the network or connector | The TagoTiP integration ids in Settings are wrong. | Restore the defaults under Settings → TagoTiP integration. A wrong value makes every device creation fail. |
| Tags limit reached | The TagoIO device already has 30 tags. | Remove some of your own tags from that device in TagoIO. The app needs its ten, plus config_rev when configuration is in use. |
| The prefix field is greyed out | Devices are mapped, and serials are permanent on TagoIO. | Remove every mapped device first, which deletes them in TagoIO. Prefer setting the prefix before enabling anything. |
Telemetry
| Symptom | Cause | Fix |
|---|---|---|
| Last push stays — | The sensor has not reported since it was enabled. | Sensors report on their own schedule, often every 10 minutes. Confirm Last seen is recent, then wait for the next frame. |
| push: server_error and The device has reached the limit of 50000 data registers | The TagoIO device is full. This is a TagoIO account limit, not a gateway fault. | Free data records in TagoIO for that device, or raise the plan limit. Turning off Send battery and signal strength reduces how fast the limit is reached. |
| A variable is missing from a TagoIO dashboard | Either the sensor never sent it, or the dashboard is bound to the wrong name. | Open Diagnostics and read the payload. A name absent from both Frame fields and Decoded values was never sent. |
| Readings arrive with a gap that later fills in | Working as intended — replay puts missed readings back at their original timestamps. | Nothing. Increase Maximum replay window if gaps older than the window are being skipped. |
| A gap has not filled in yet | Replay runs 3 devices a minute and stays about 3 minutes behind the present. | Give it a few minutes. Confirm Replay readings missed while TagoIO was unreachable is enabled in Settings. |
| A long outage left a permanent gap | The outage was longer than the replay window. | The window caps at 168 hours; anything older is skipped by design so TagoIO is not flooded on return. |
| Battery is missing from replayed readings only | The platform keeps battery only as a current value, so it cannot be replayed. | Expected. A replayed gap has everything a live push has except battery. |
| Diagnostics shows a high Failed count | Pushes are being rejected — commonly a full device or an authorization problem. | Read the failure chip on the newest entries in Recent pushes; it carries TagoIO’s own code. |

Sensor configuration
| Symptom | Cause | Fix |
|---|---|---|
| The widget says it is waiting for the settings list | The schema has not been published for that sensor yet. | Check Schemas published on the Configuration screen. A card reading No schema resolves itself once the ingestion daemon has seen the sensor report. |
| A change stays Queued | The gateway has not been able to validate it, or the sensor has not checked in. | Confirm the card does not read No schema, then check sensor seen. A sensor that is not reporting cannot take a change. |
| A change stays Waiting for sensor | The radio has it; the sensor has not confirmed. | Wait one report interval. If the sensor has gone offline, use Clear to abandon the request. |
| A change shows Rejected | The value failed validation against the sensor’s own options. | Read the reason under the row and choose a value the sensor accepts. The gateway’s validation governs, even if the widget accepted it. |
| TagoIO still shows a change as pending after it applied | The acknowledgement has not reached TagoIO yet. | Look for confirming to TagoIO… on the row and press Sync now. It clears on its own. |
| Changes are ignored entirely | Accept settings changes from TagoIO is off. | Enable it under Settings → Sensor configuration. The Configuration screen warns when it is off. |
| Every change seems to be processed twice | A second Action in your TagoIO account also fires on a settings change. | The cloud setup card names it. Tick Switch it off on the next run, or disable it in TagoIO. Nothing is deleted. |
| The validator sits at Working… | TagoIO is still bundling the Analysis. | Wait, then press Check and repair. This is a TagoIO-side job, not a gateway error. |
| The widget shows a form with no current values | TagoIO does not hold the sensor’s reported settings. | Check the sensor card’s last timing value. not sent to TagoIO yet is the real state to fix; press Sync now. |
14Reference
Endpoints the gateway contacts
| Host | Used for |
|---|---|
| api.<region>.tago.io | Credential verification, profile lookup, device creation and updates, and the cloud setup artifacts. |
| http.tip.<region>.tago.io | Telemetry over TagoTiP, and the authorization self-test. |
Regions are us-e1 and eu-w1. All traffic is outbound HTTPS; nothing needs to reach the gateway from the internet.
Timing and limits
| Behaviour | Value |
|---|---|
| App screens refresh | Every 5 seconds. |
| Background worker | Every 60 seconds: rebuilds devices, syncs tags, replays telemetry, moves configuration, keeps the cloud setup in step. |
| Device creation retries | Batches of 5, backing off to at most 1 hour. |
| Metadata (name and tag) updates | At most 3 devices per minute, and only where something actually differs. An unchanged fleet costs no API calls. |
| Replay | 3 devices per minute, round-robin, up to a 1 hour window per pass, bounded by the configured lookback. A pass covering a dense sensor narrows its window rather than sending more than about 900 readings at once. |
| Replay lag | Replay deliberately stays about 3 minutes behind the present, so it never races the live push for a reading that is still arriving. A gap is not filled the instant it appears. |
| Concurrent live pushes | At most 8. Frames beyond that are recovered by replay rather than buffered. |
| Cloud setup re-check | Fleet bindings within a minute; the TagoIO account itself every 15 minutes, which is what notices an artifact deleted by hand. |
| Diagnostics history | The last 25 pushes, held in memory and reset by a service restart. |
| TagoIO tags per device | 30, of which the app uses 10. |
| Replay window | 1 to 168 hours; default 24. |
How a settings change travels
TagoIO widget  ->  Trigger  ->  Validator  ->  device parameters (pending)
                                                       |
                                    gateway notices the revision move
                                                       v
                              gateway validates against the sensor's options
                                                       |
                                                       v
                                        radio  ->  sensor applies it
                                                       |
                                       sensor reports what it applied
                                                       v
                                    acknowledged back to TagoIO (pending clears)
Two properties of that path are worth remembering. The gateway validates every value against the sensor’s own options before anything reaches the radio, independently of TagoIO having validated it. And a change is acknowledged only once the sensor confirms it, which is why a dashboard’s pending state is meaningful rather than cosmetic.
What the app stores on the gateway
Everything the app keeps is bounded by the number of sensors on the gateway, so there is no retention policy to manage and no growth to watch.
- No telemetry is ever copied. Only a cursor per device — the newest reading confirmed delivered. That is what makes replay work without a retry queue: a failed push simply leaves the cursor behind.
- The TagoIO link: region, both credentials encrypted at rest, the derived authorization hash, and the account and profile the token belongs to.
- One row per enabled sensor: its serial, sync state, TagoIO ids, retry and push bookkeeping.
- One settings schema per sensor type and firmware, rather than per sensor, so a fleet of identical sensors stores one copy.
- Requested settings, and the last settings each sensor reported.
Artifacts created in your TagoIO account
| Artifact | Name in TagoIO |
|---|---|
| Analysis (the Validator) | NCD Sensor Configuration |
| Action (the Trigger) | NCD Sensor Configuration |
| Dashboard | NCD Sensor Configuration |
| Widget file | atrium/sensor-config/<content-hash>/index.html in the account’s Files |
All four are tagged atrium_managed=1. The content hash in the widget path means an upgraded widget arrives at a new address, so nobody is left looking at a cached copy of the old one.