

Industrial IoT Wireless Water Detect Sensor
Wireless water and leak detection for industrial and facility monitoring. One board, one or two independent detection channels — each channel drives a probe that reports a simple wet/dry state to an Atrium IIoT Gateway over a long-range wireless mesh. The sensor transmits on a scheduled interval and immediately whenever a channel changes state, so a leak raises an alert the moment it is detected. Choose a spot-detecting puck probe or a linear water rope probe per channel.
01Overview
The NCD Industrial IoT Wireless Water Detect Sensor is a battery-powered wireless transmitter built for early detection of water and conductive-liquid leaks — server rooms, mechanical rooms, drip pans, basements, pump bases, and anywhere unwanted water needs to be caught fast. A detection probe senses water by the conductive bridge it forms across the probe’s contacts — so it responds to ordinary conductive facility water — and the sensor reports that state as a digital wet / dry value. Reports go over a long-range wireless mesh network to an Atrium IIoT Gateway both on a user-defined interval and immediately whenever a channel changes state, so a leak is reported the moment it happens rather than on the next scheduled report.
The same board is sold in two configurations — a single-channel model and a two-channel model — and each channel accepts either probe style. The sensor ships with one of three wireless communication modules; choose the frequency band that matches your gateway and region. The sensor core, firmware, and Atrium integration are identical across all three. The 900 MHz and 868 MHz options run on NCD’s sub-GHz wireless mesh network, which cuts through industrial noise and interference for secure, long-range communication.
Model Comparison
| Model | Detection Channels | Atrium Sensor Type | SKU |
|---|---|---|---|
| 1-Channel — Puck | One channel (ch1_water_detect) | Type 128 | PR63-22A |
| 2-Channel — Puck | Two channels (ch1_water_detect, ch2_water_detect) | Type 129 | PR63-22B |
| 1-Channel — Rope | One channel (ch1_water_detect) | Type 128 | PR63-22C |
| 2-Channel — Rope | Two channels (ch1_water_detect, ch2_water_detect) | Type 129 | PR63-22D |
Probe Options
| Probe | Best for | How it detects |
|---|---|---|
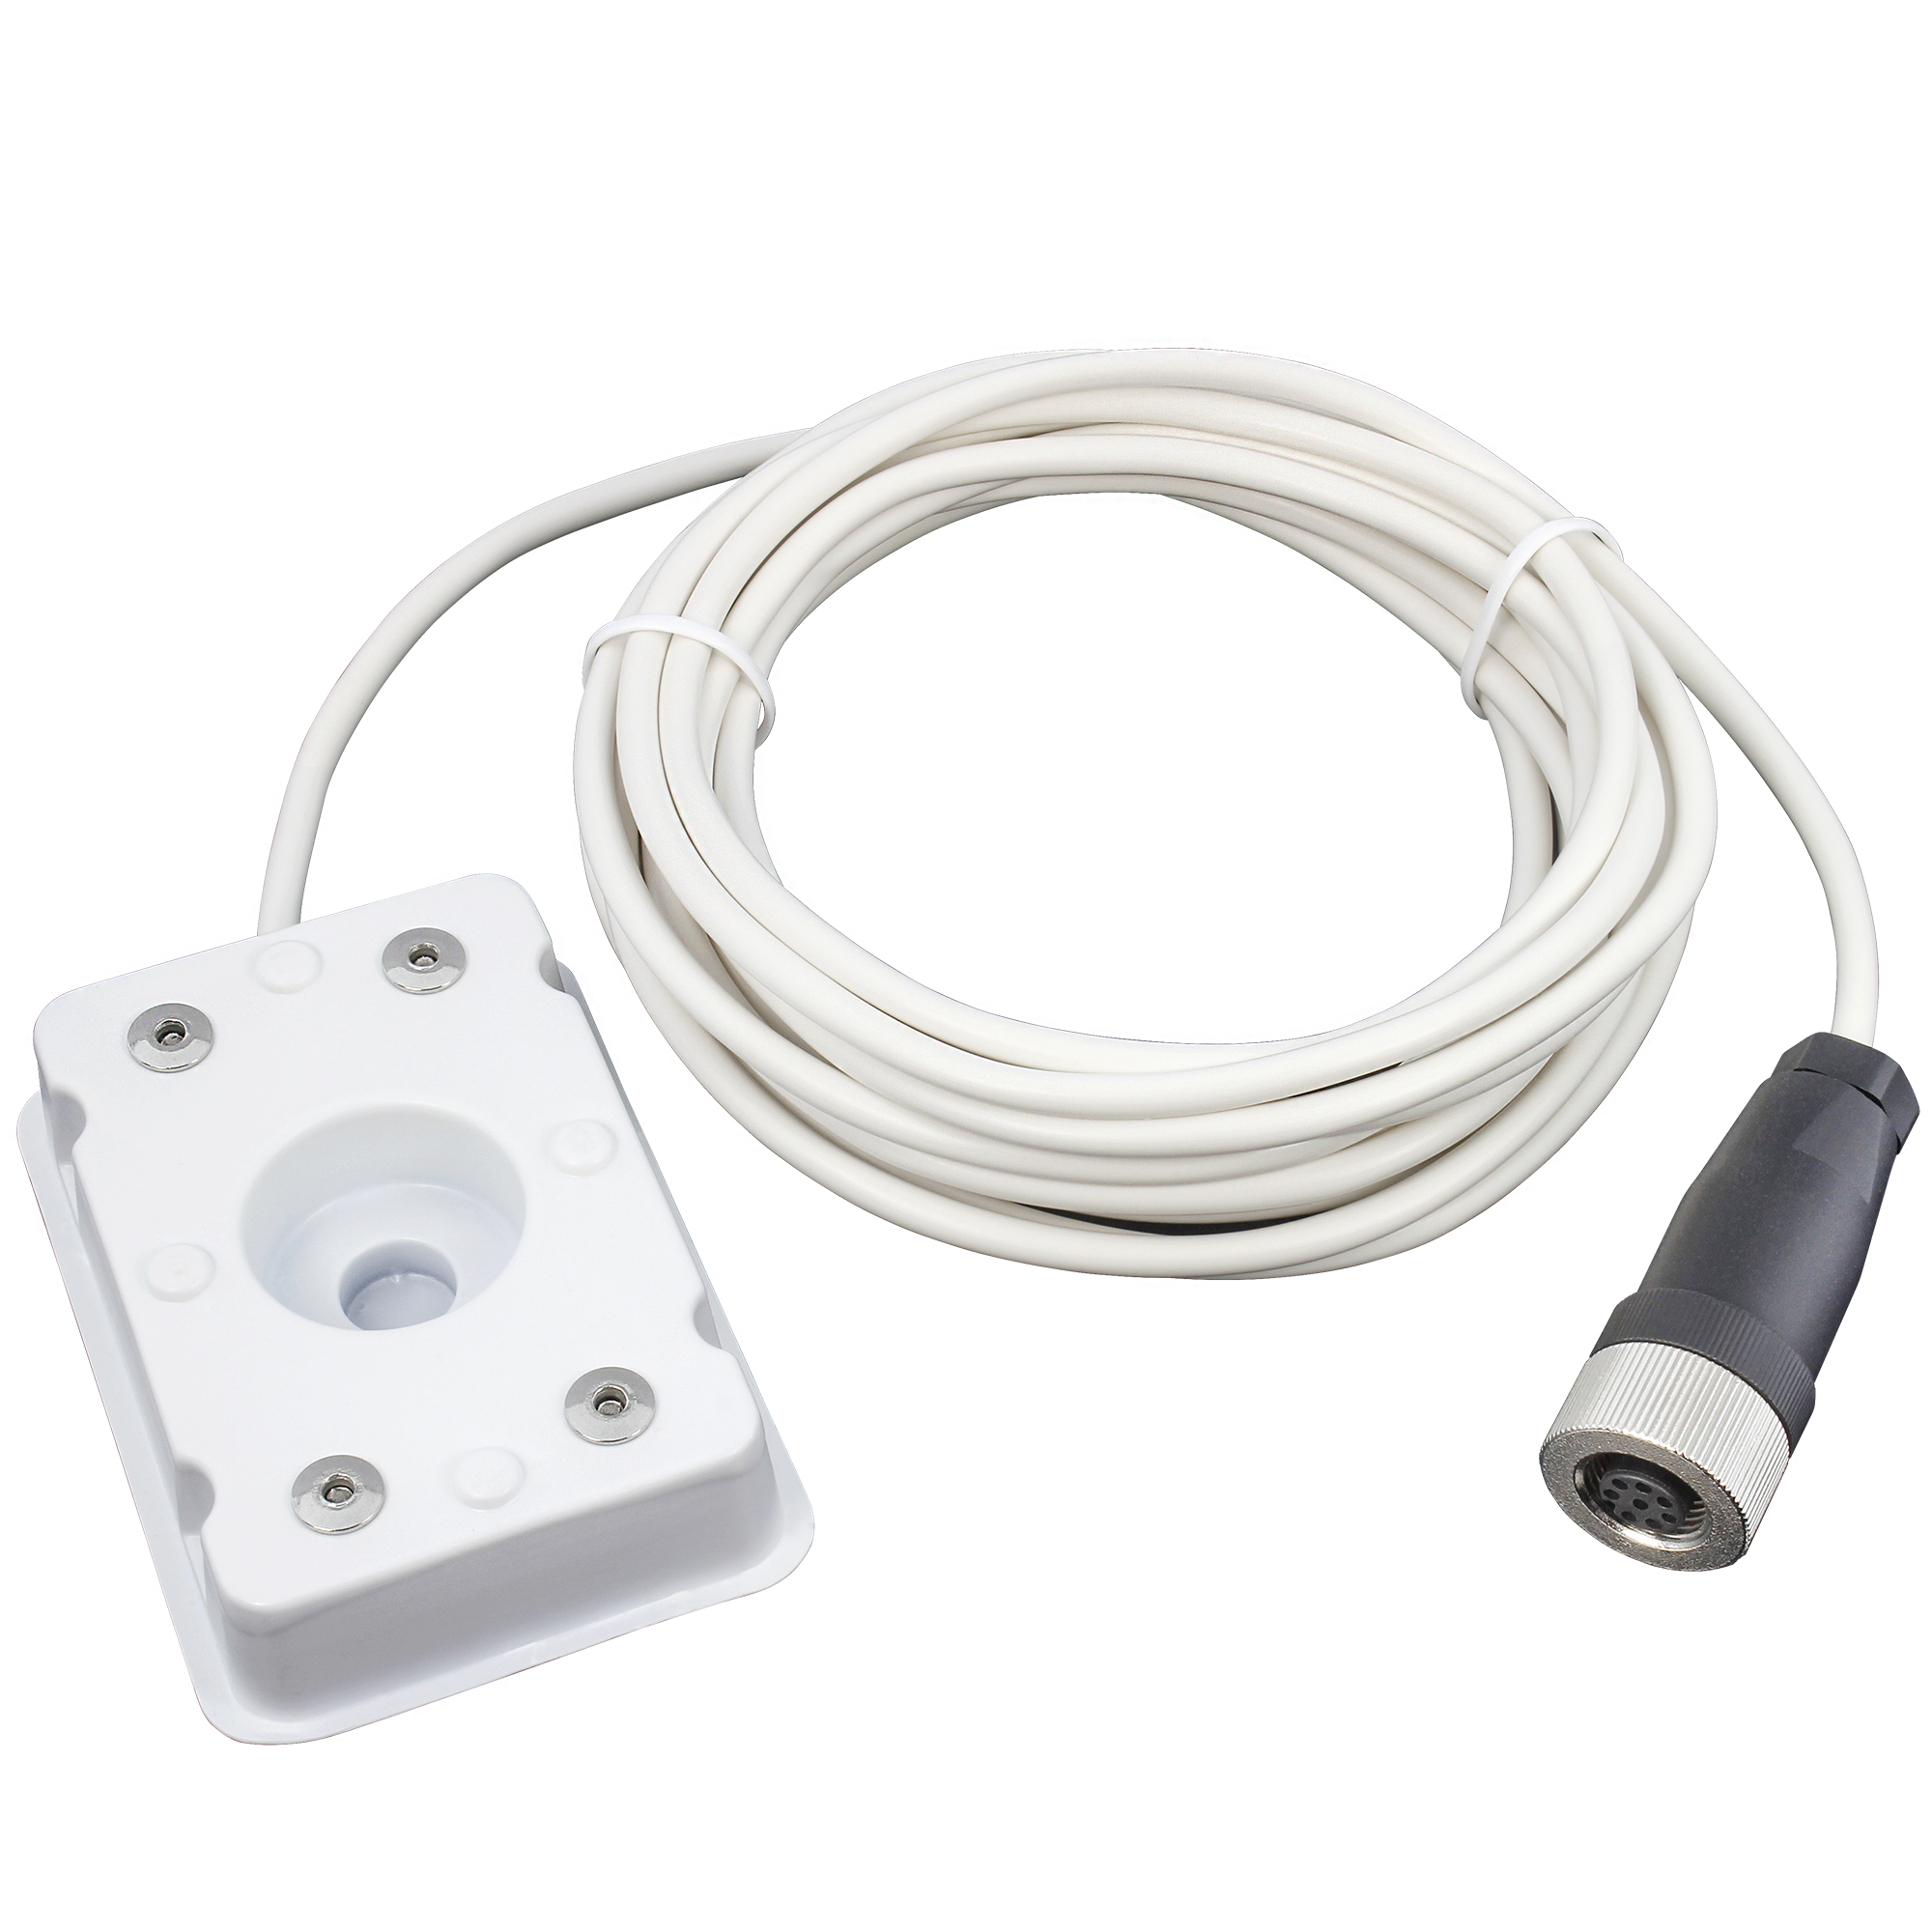
| Puck probe (spot) | A specific low point — a drip pan, floor drain, or the base of a pump or tank | Four stainless-steel contacts on the underside of a small puck; water bridging any two of them completes the circuit and reads as wet |
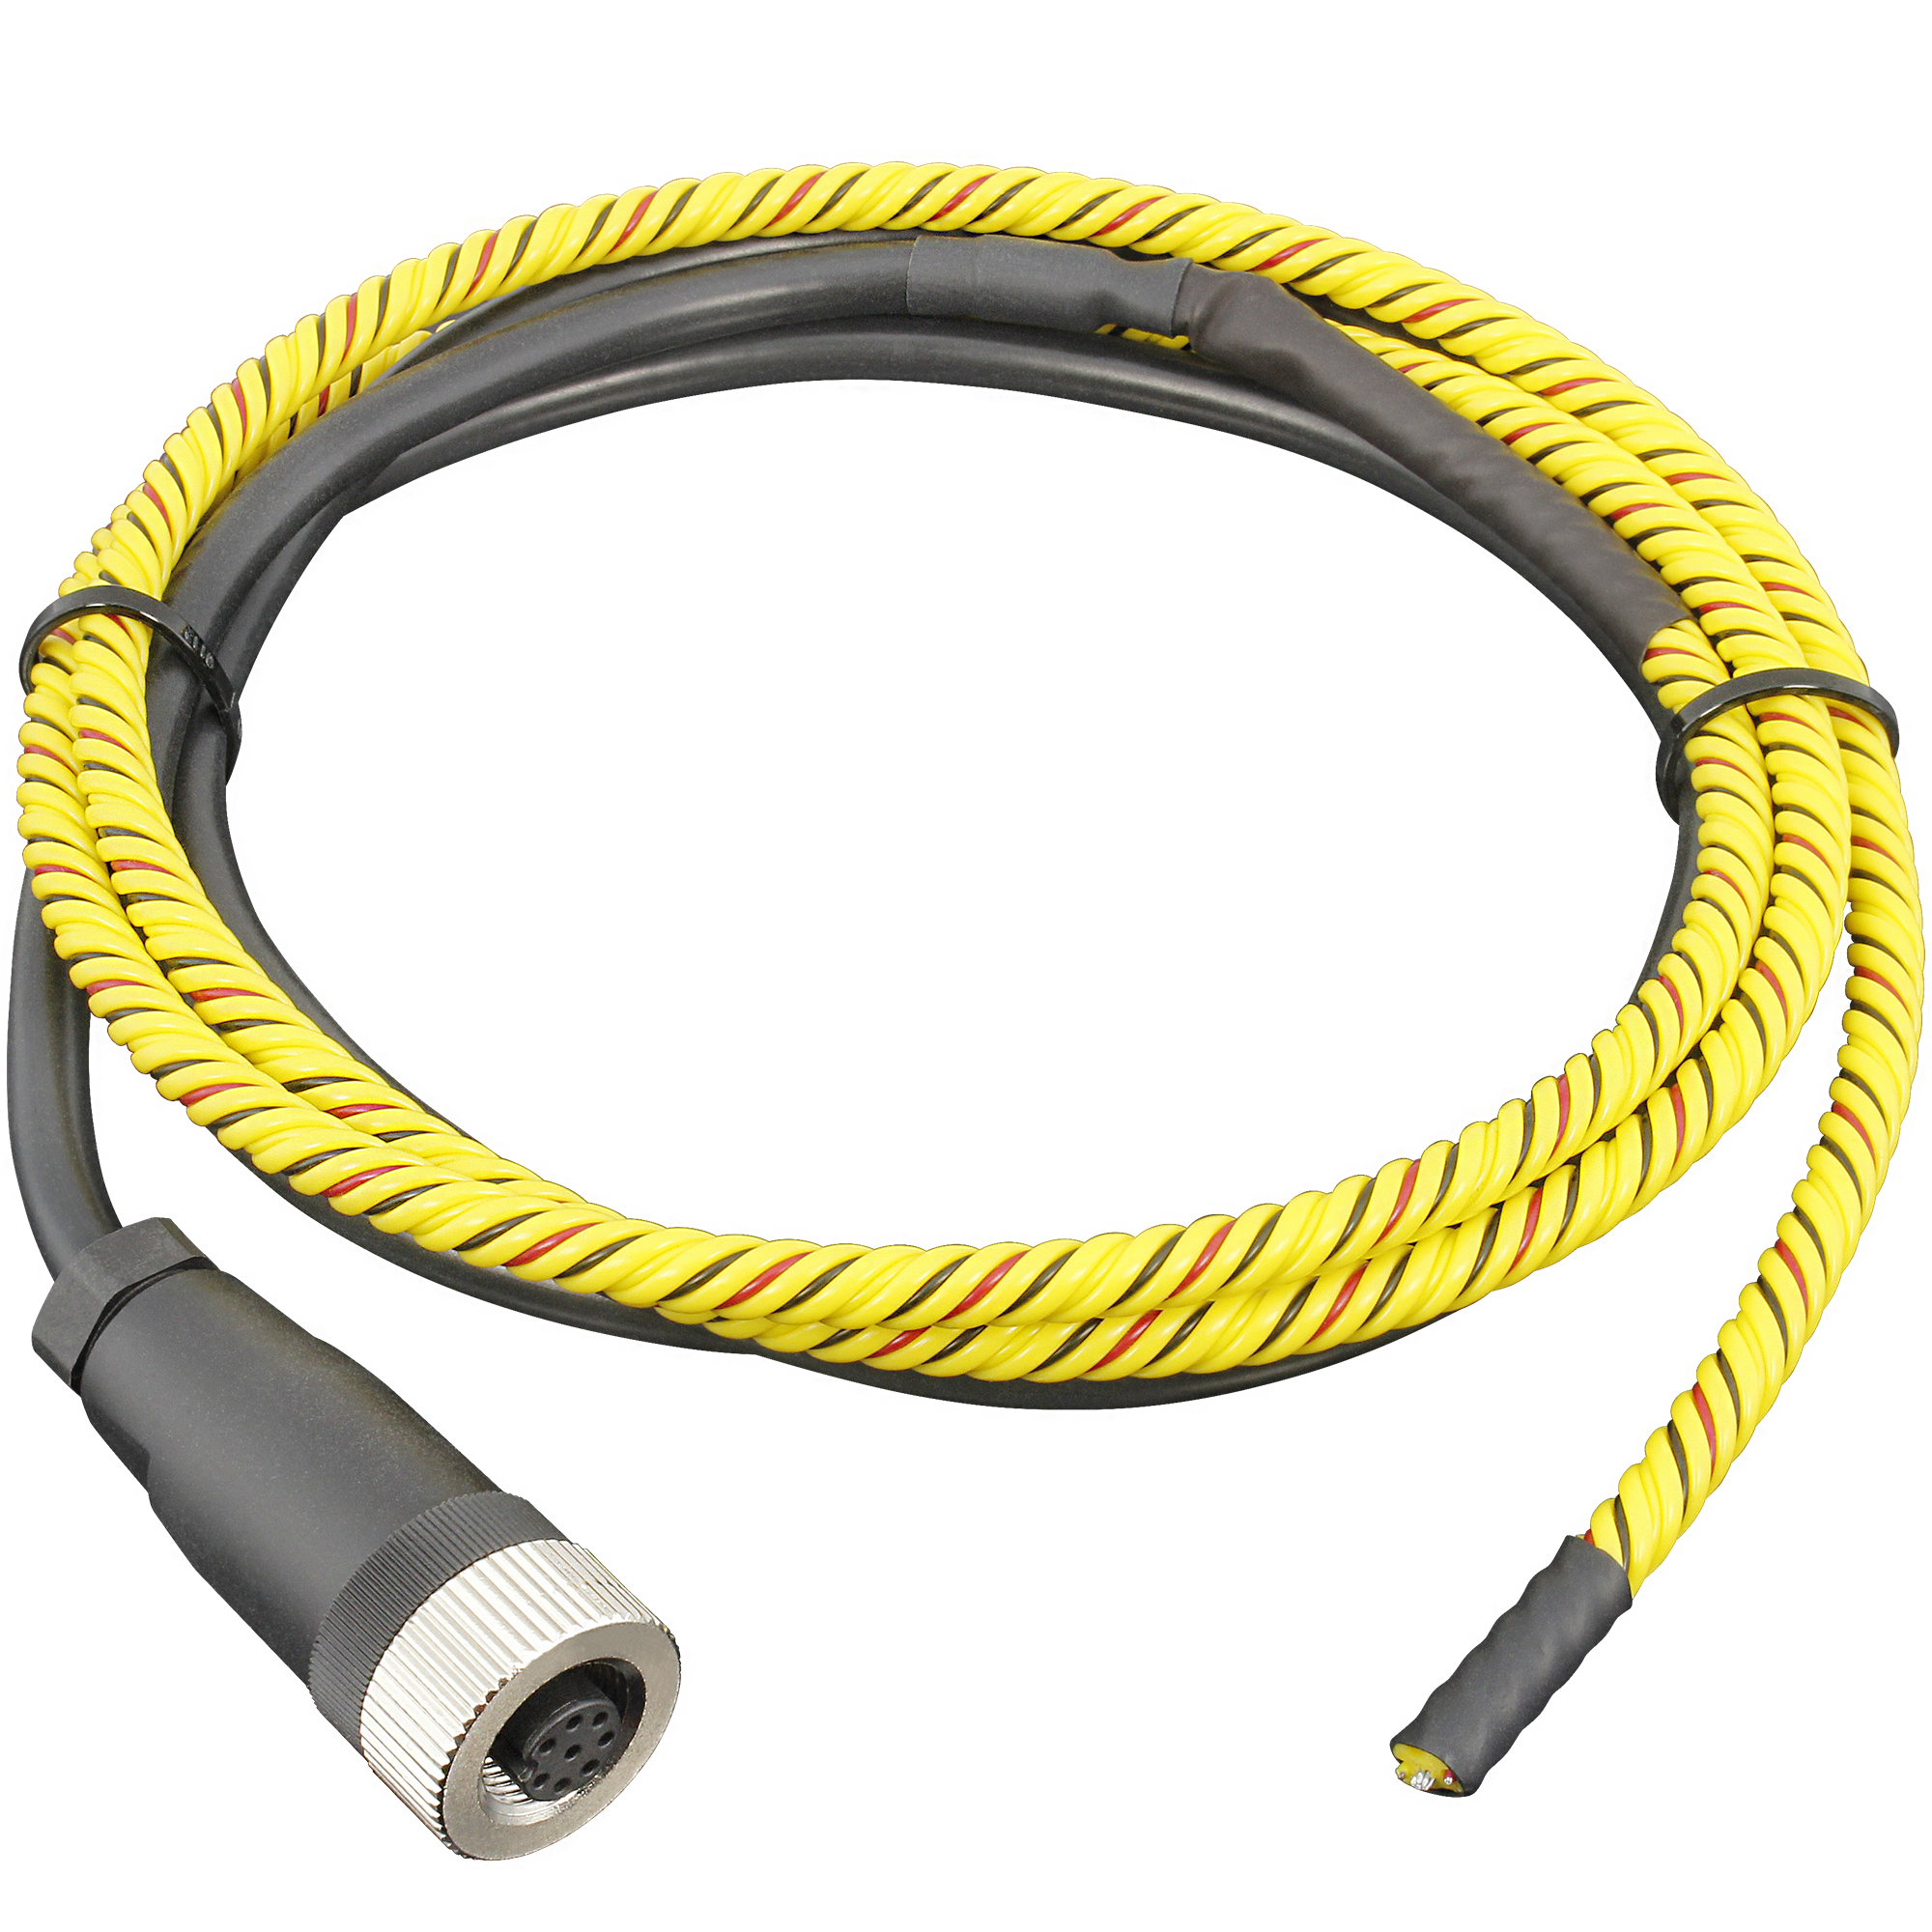
| Water rope probe (linear) | A perimeter or a run of piping — detects water anywhere along the cable, not just at one point | A conductive sensing cable; liquid contacting the cable anywhere along its length reads as wet |
What’s in the Box
- Industrial IoT Wireless Water Detect Sensor — puck or rope, 1- or 2-channel (PR63-22A / 22B / 22C / 22D)
- One water detection probe per channel — puck or water rope per your selection (each on a connecting cable)
- Wireless communication module per your selection (900 MHz, 868 MHz, or 2.4 GHz) with antenna
- D-cell (LR20) lithium battery with integrated supercapacitor (power switch ships in the OFF position)
02Specifications
Full technical specifications for the Water Detect Sensor. Values are drawn from the product datasheet; where the 1- and 2-channel models differ, both are noted.
| Parameter | Specification |
|---|---|
| Detection Method | Conductivity-based — detects water or conductive liquid bridging the probe contacts. Very pure water (distilled / deionized) may not be detected; the probe does not react to condensation or humidity alone. |
| Reported State | Digital wet/dry per channel (1 = water detected, 0 = dry) |
| Detection Channels | 1 channel (PR63-22A/C) or 2 independent channels (PR63-22B/D). Each channel reports a wet/dry state plus a raw conductivity value |
| Probe Options | Puck (spot) probe or water rope (linear) probe — one per channel |
| Probe Connector | 8-pin M12 — Channel 1 on pins 5 & 6, Channel 2 on pins 7 & 8 (2-channel model) |
| Puck Probe Lead | Puck (spot) probe on an approx. 4.5 m (14.8 ft) connecting cable |
| Water Rope Probe Length | 2 m total — 1 m active sensing rope + 1 m non-sensing leader wire (default); longer sensing lengths available |
| Reporting Behavior | Scheduled transmission on a configurable interval (default 15 min), plus an immediate transmission on any change of state — both dry→wet and wet→dry. Each transmission is tagged msg_type: regular (scheduled) or Interrupt (state change) |
| Enclosure / Electronics Operating Temp | −40°C to 85°C |
| Wireless Module | Select 900 MHz (North America), 868 MHz (Europe), or 2.4 GHz (worldwide) at time of order |
| Line-of-Sight Range | Up to ~2 miles line-of-sight; roughly ~1,000 ft in dense indoor environments |
| Antenna | On-board / included antenna |
| Encryption | 128-bit AES |
| Enclosure Rating | IP65 |
| Enclosure Material | Impact-resistant, UV-stabilized polycarbonate |
| Enclosure Dimensions | 4.5″ × 3.5″ × 2.2″ (external); 4.1″ × 3.1″ × 1.9″ (internal) |
| Mounting | 1/4 NPT, 1/4″–28 UNF, or magnet mount |
| Power Supply | D-cell (LR20) lithium battery with integrated supercapacitor, or external power supply. 3-position switch: Battery / Off / External (ships Off) |
| Battery Life | Up to 5 years — varies with configuration. Estimate for your settings with the battery life calculator |
| SKU | PR63-22A (1-Ch Puck) / PR63-22B (2-Ch Puck) / PR63-22C (1-Ch Rope) / PR63-22D (2-Ch Rope) |
03Prerequisites
Before installing this sensor, make sure you have the following in place.
Hardware Required
- NCD Atrium IIoT Gateway — powered on and connected to your local network
- Water Detect Sensor (this unit) with a probe connected to each channel you intend to use
- The external power supply — only if you ordered the external-power option (the sensor ships with its battery installed)
Software / Network
- A current version of Atrium running on your gateway
- A computer or mobile device on the same local network as the gateway
- A modern web browser (Chrome recommended)
04Mounting & Installation
Detection quality depends almost entirely on probe placement. Mount the enclosure somewhere accessible and dry, and route each probe to the point where water will collect first. The electronics stay sealed in the enclosure; only the probe and its cable reach the wet area.
Powering On
The sensor ships with its battery already installed and the power switch in the Off position — there is no battery to insert.
-
1
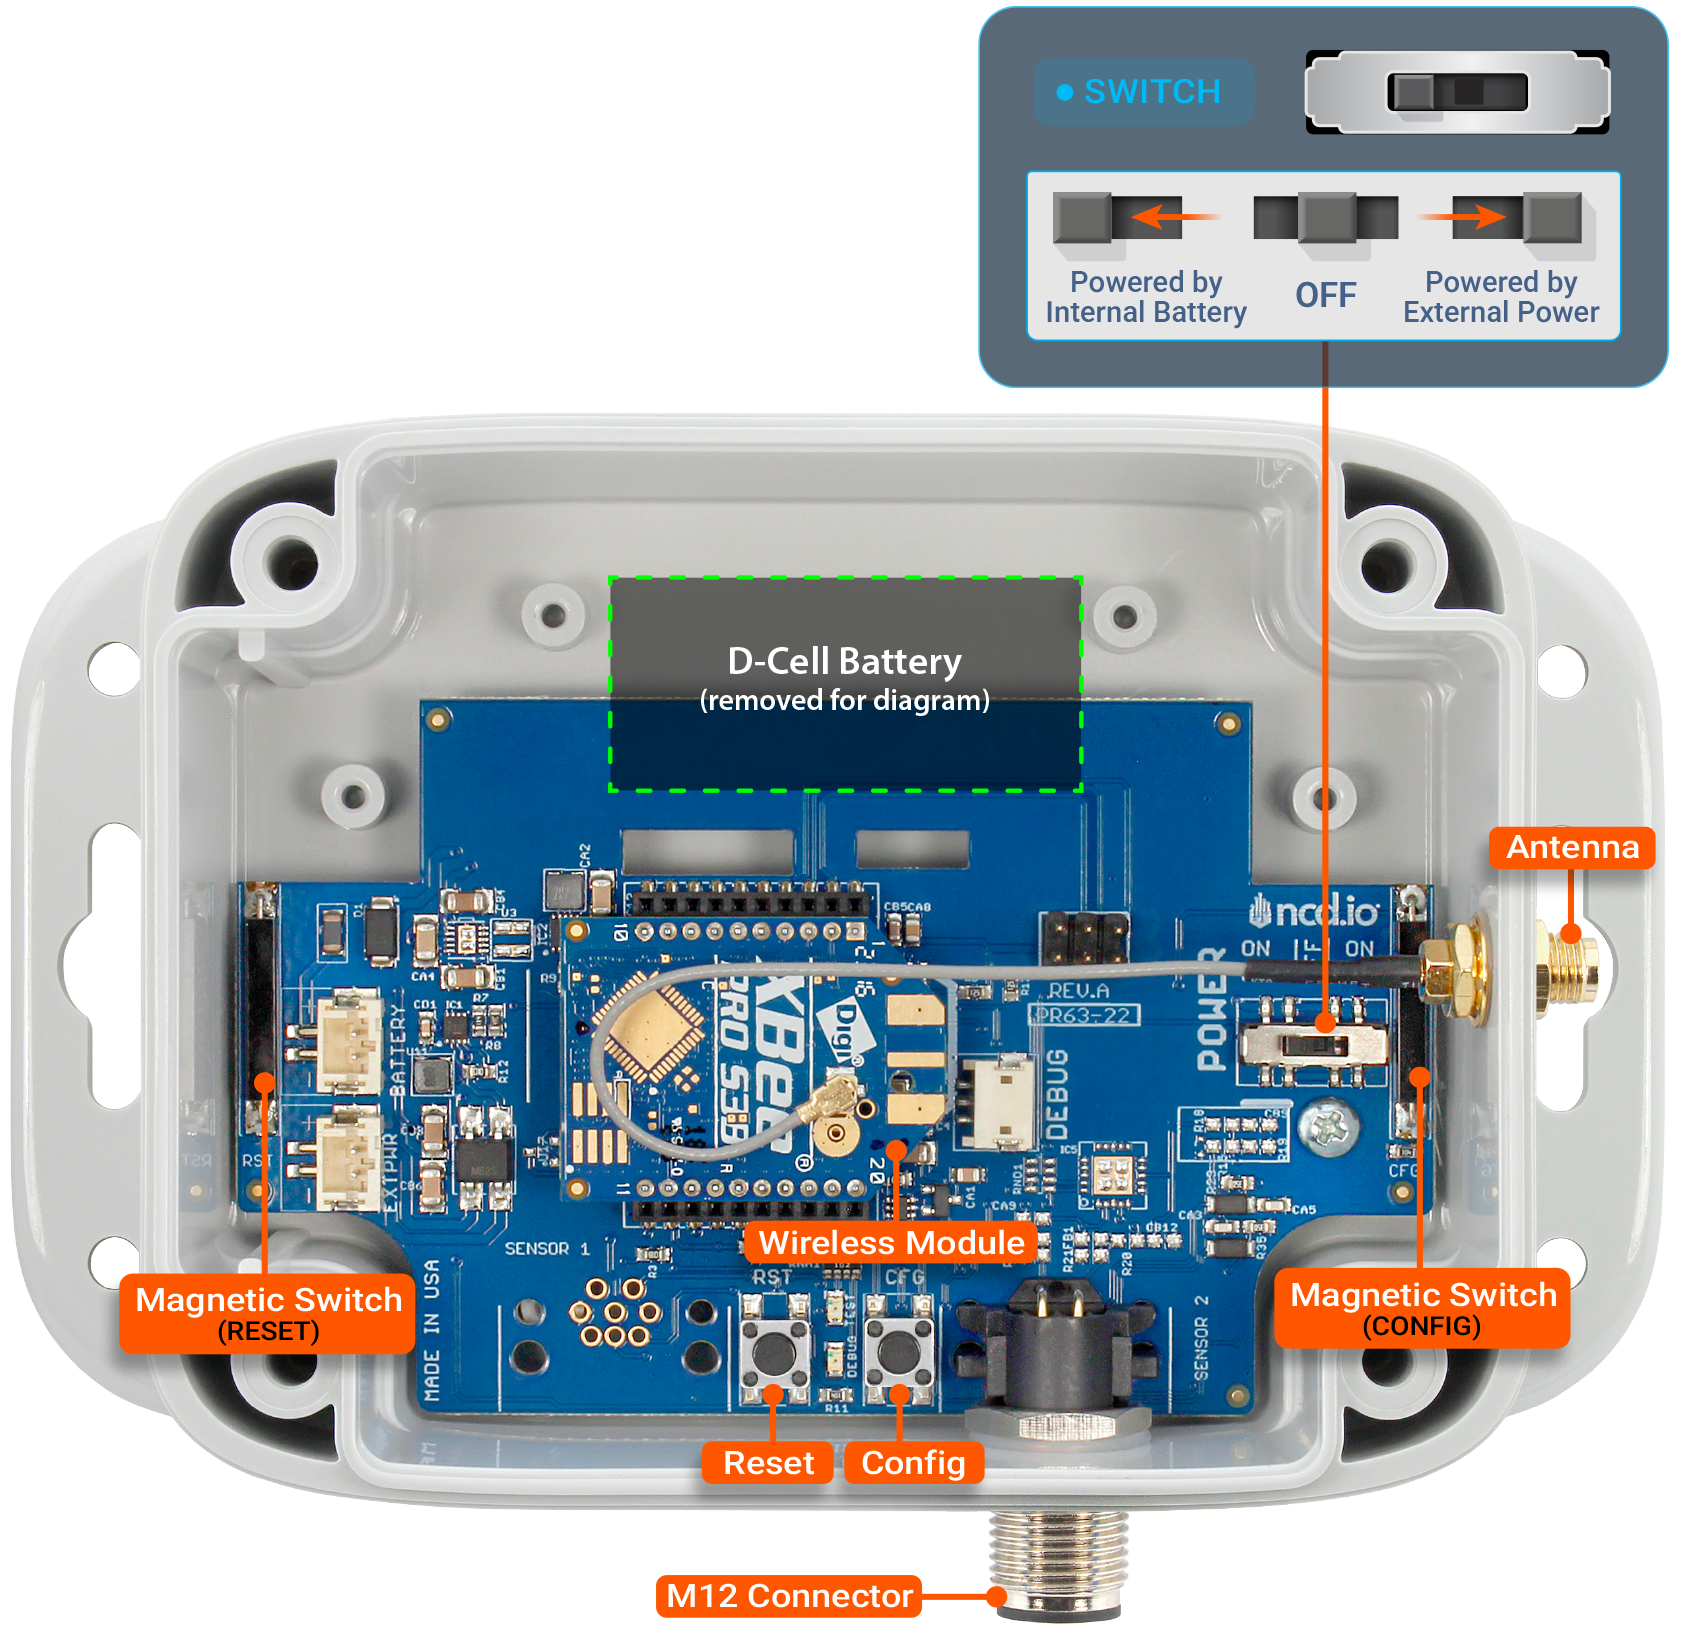
Open the enclosureRemove the screws securing the enclosure lid and lift the cover to reach the 3-position power switch (and the external-power connector, if you are powering the unit externally).
-
2
Set the power switchThe 3-position switch ships in the Off position. Set it to Battery to run on the installed battery, or to External if you are using an external supply (connect the supply to the power connector first).
-
3
Confirm powerActivate the magnetic CFG switch with a magnet, or press and hold the CFG button on the PCB — the TEST LED illuminates while active, confirming the unit is powered. If it does not light, re-check the switch position and, for external power, the supply connection.
-
4
Close and seal the enclosureReplace the lid and tighten all screws evenly to maintain the IP65 seal.
Connecting and Placing the Probes
Probes connect to the sensor through an 8-pin M12 connector. Each channel is a two-wire contact pair: a closed (wet) pair reports that channel as detected. The 1-channel models (PR63-22A/C) use pins 5 & 6 only; the 2-channel models (PR63-22B/D) add pins 7 & 8 for the second channel.
| M12 Pin | Assignment | Applies To |
|---|---|---|
| 5 | Channel 1 probe contact | Both models |
| 6 | Channel 1 probe contact (return) | Both models |
| 7 | Channel 2 probe contact | 2-Channel only |
| 8 | Channel 2 probe contact (return) | 2-Channel only |
Pins 5 & 6 map to ch1_water_detect and pins 7 & 8 to ch2_water_detect in Atrium. The probe leads are non-polarized — the red and black wires can land on either pin of the channel pair (the same applies to the water rope’s leader connection). Confirm the pin assignment against your unit before wiring a custom probe cable.
- Connect each probe to its channel. On a 2-channel unit, the first probe connects to channel 1 (M12 pins 5 & 6) and the second to channel 2 (M12 pins 7 & 8) — reported as
ch1_water_detectandch2_water_detectin Atrium. Route each probe cable out through the cable gland. - Puck probe — place at the low point. Lay the puck flat at the lowest point where liquid will pool first: a drip pan, floor drain, or the base of a pump, tank, or valve, with its labeled side up so all four stainless-steel contacts on the underside sit against the surface. Water bridging any two of the four contacts reads as wet.
- Water rope probe — run the perimeter. The rope is 2 m total: a 1 m active sensing section plus a 1 m non-sensing leader wire that runs back to the sensor. Connect the sensing rope’s black wires to the leader wire, then route the sensing section along the area you want to protect — around the base of equipment, along a wall, or beside a pipe run. It detects water contacting the rope anywhere along its 1 m sensing length. Keep the rope flat on the surface so it makes contact with pooling water.
Mounting the Puck Probe
Lay the puck flat, labeled side up, so all four stainless-steel contacts sit against the surface being monitored at the lowest point where water collects. Water bridging any two of the four contacts triggers detection, so mounting it flat (not on edge) lets even a thin, spreading film of water reach the contacts.
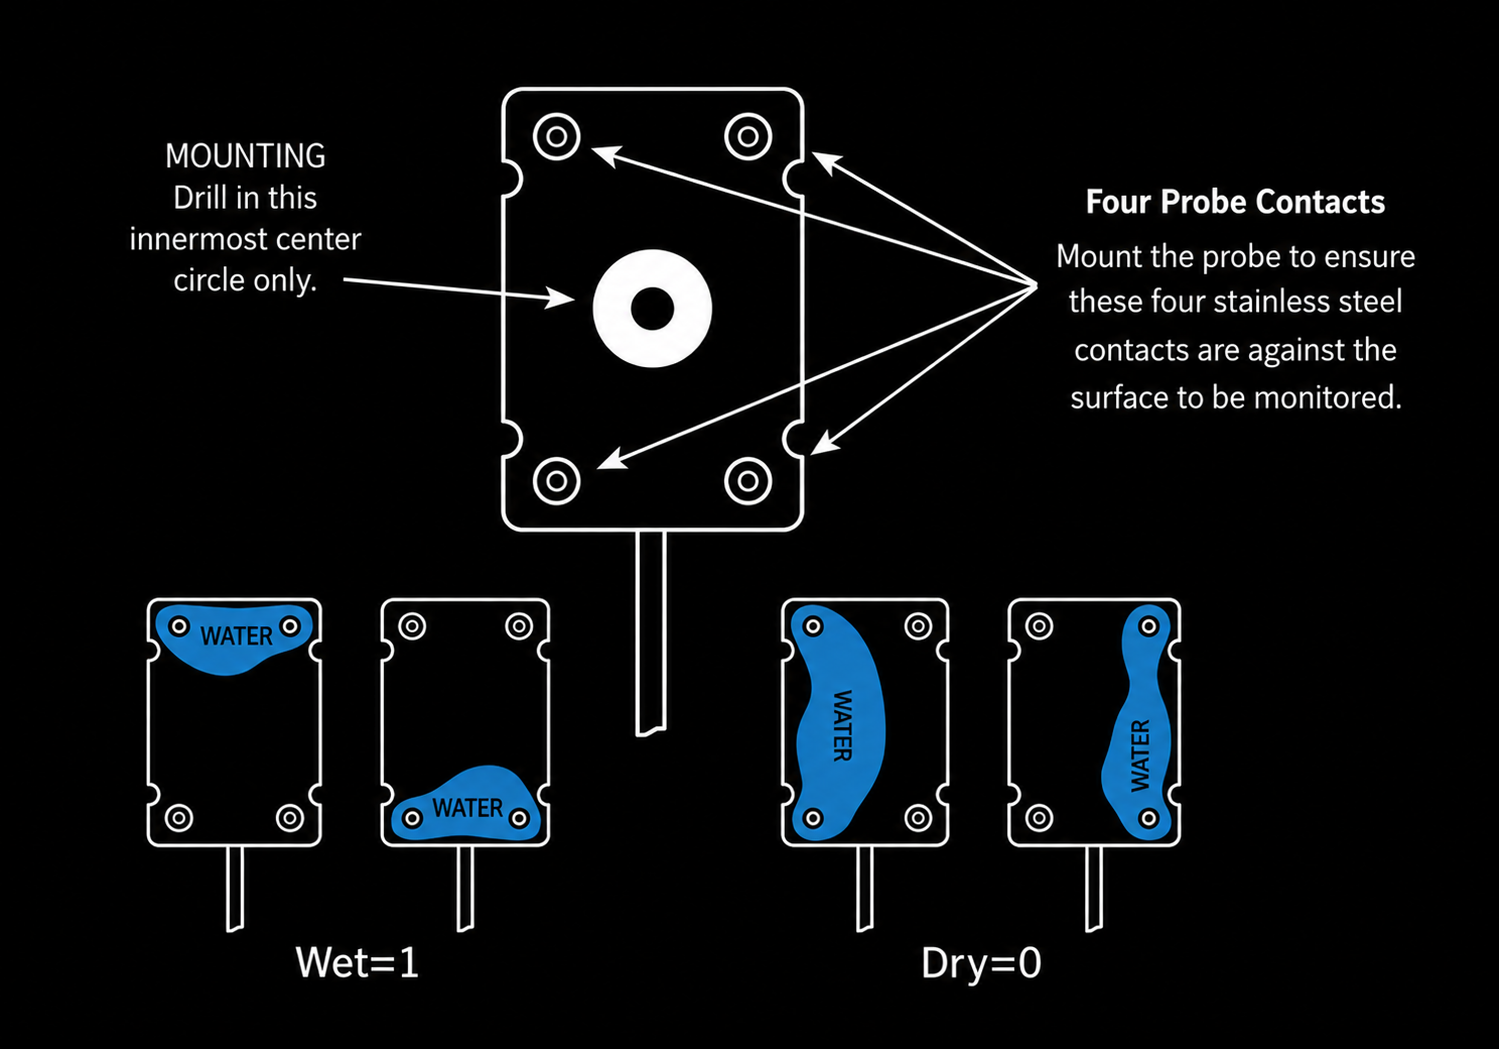
1); with no bridge across the contacts the channel stays dry (0).Mounting the Enclosure
The impact-resistant polycarbonate enclosure measures approximately 4.53 × 3.56 × 2.26 in (115 × 90 × 57 mm) and carries two molded-on mounting flanges with keyhole slots for surface mounting. The removable cover seals against a silicone perimeter gasket (gray or clear-cover option) for an IP65 rating.
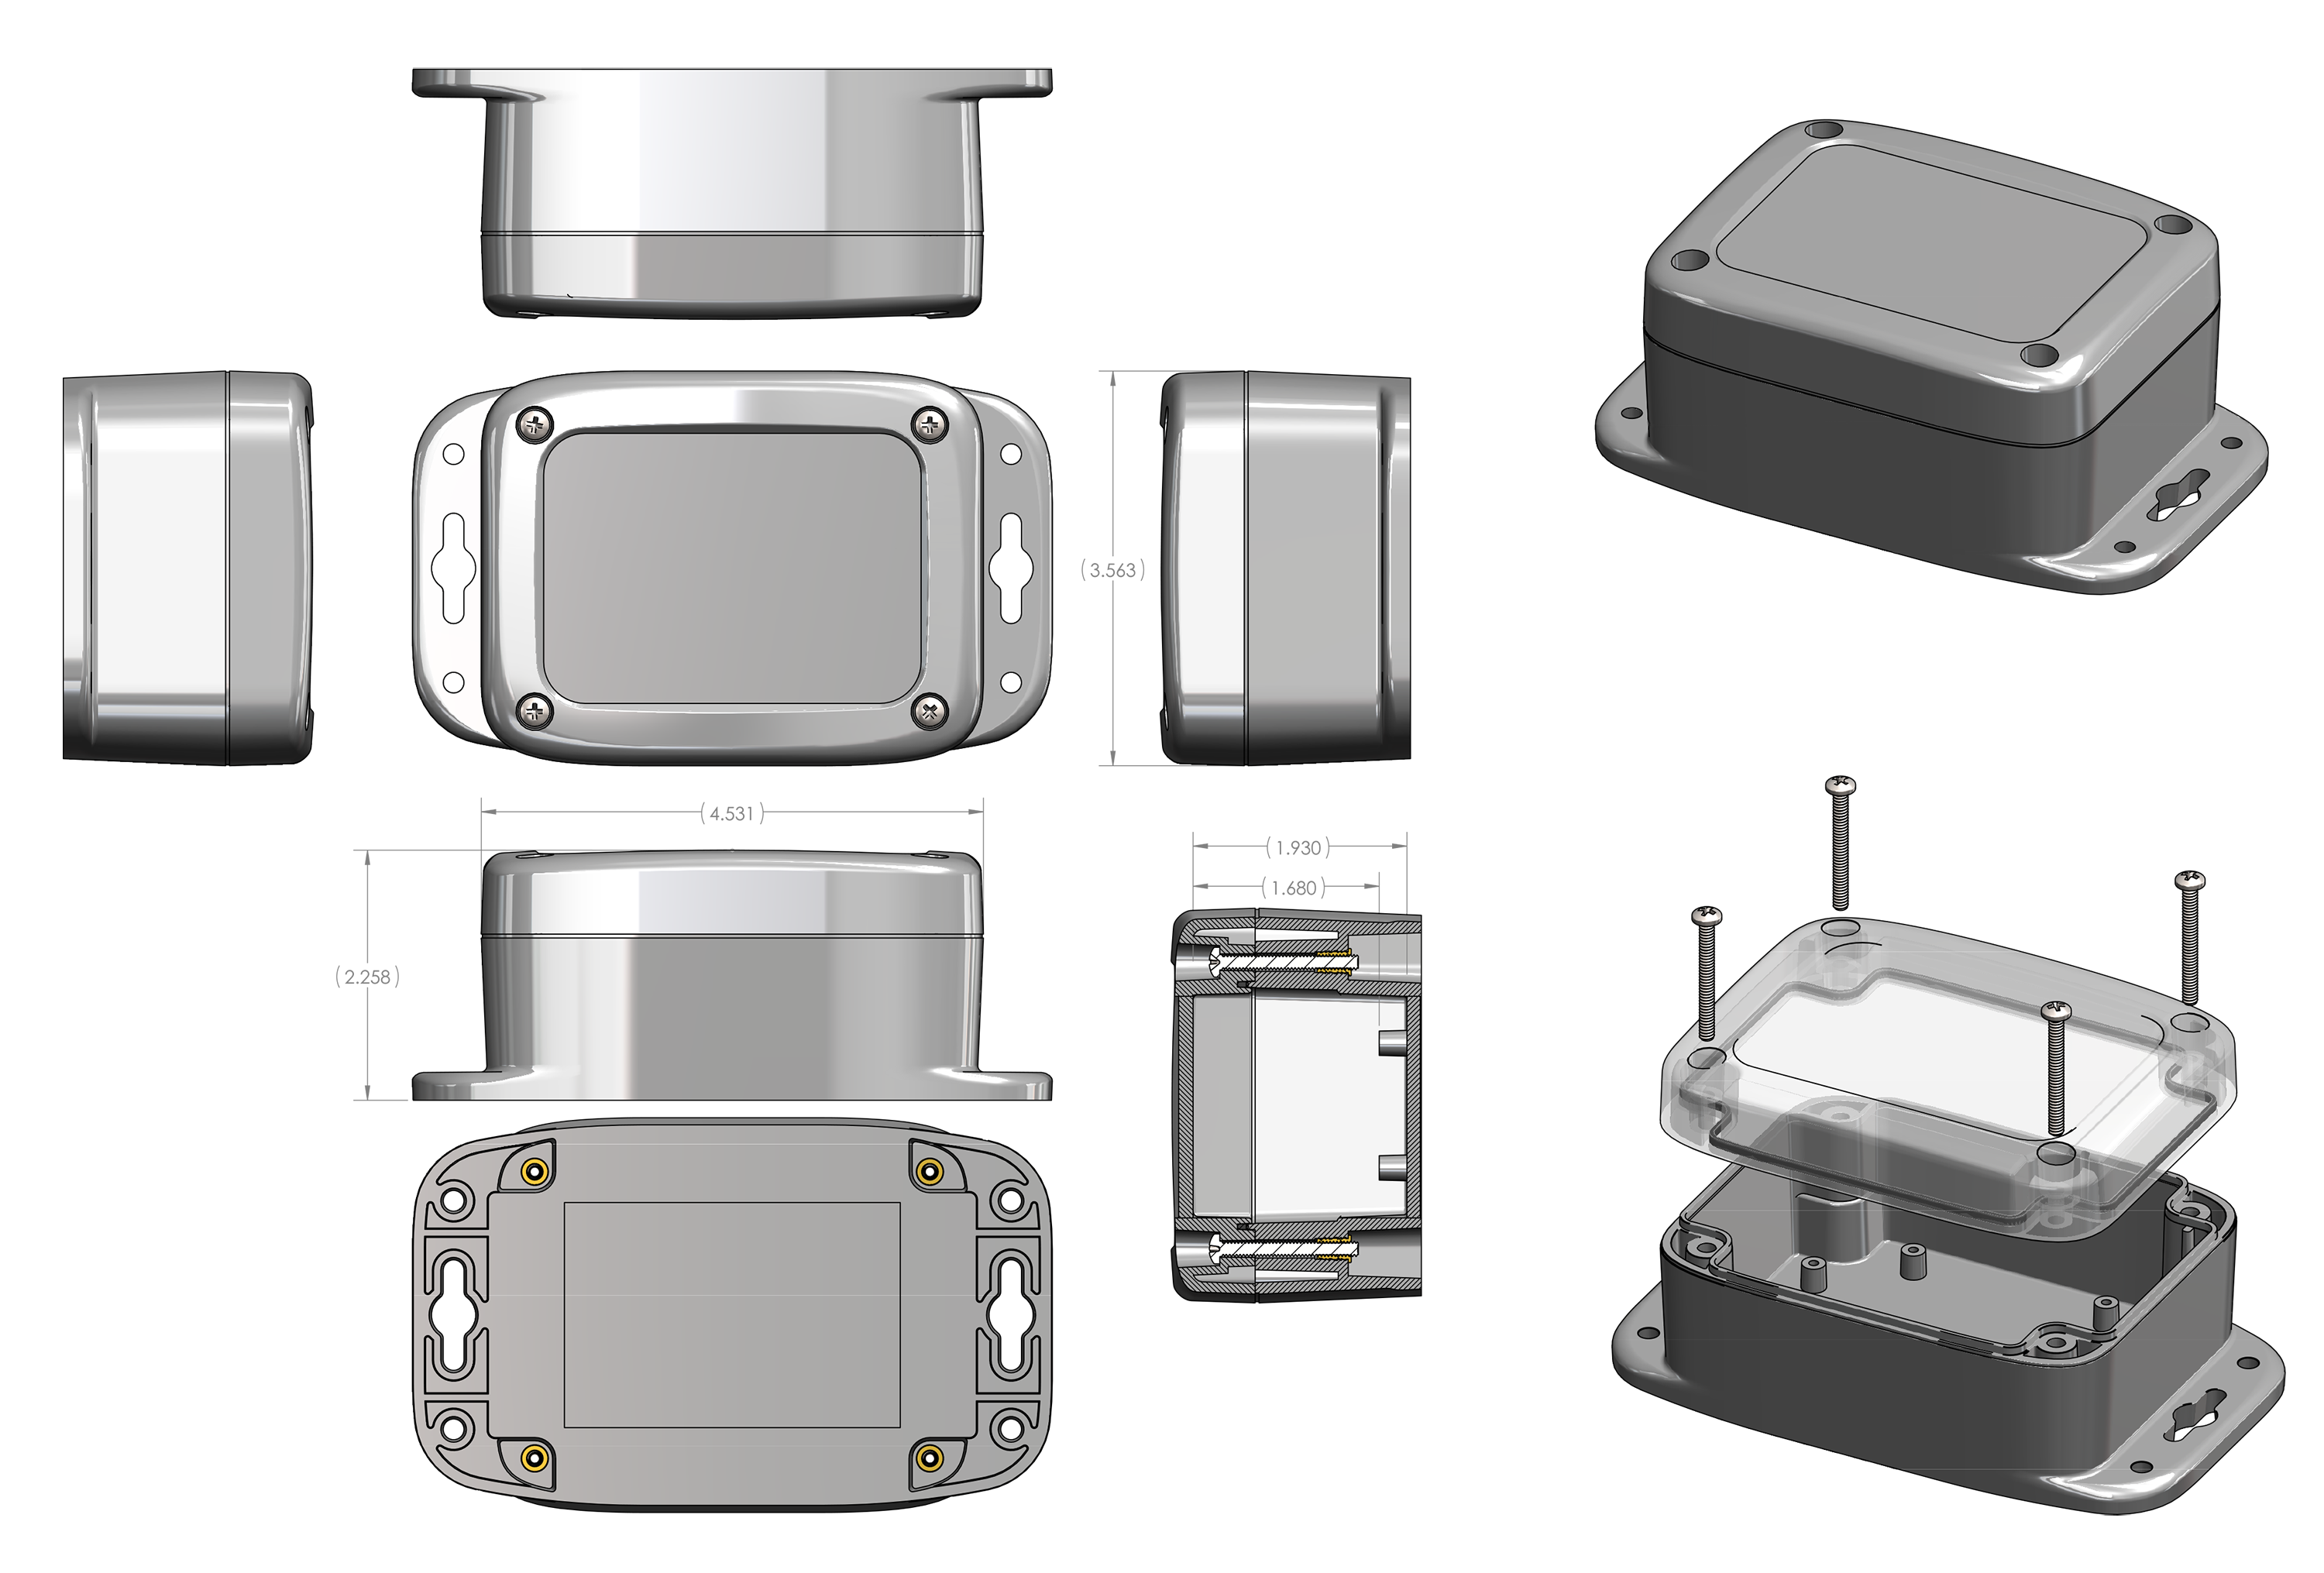
- Surface (flange) mount: fasten through the keyhole slots in the two molded-on flanges to any flat wall, panel, or equipment surface — the standard mounting method.
- Threaded mount: use the 1/4 NPT or 1/4″–28 UNF fitting to mount the enclosure to a compatible bracket or conduit fixture.
- Magnet mount: attach the optional magnetic mounting hardware to any flat ferrous surface — ideal for equipment frames, panels, and skids.
05Pairing with Atrium
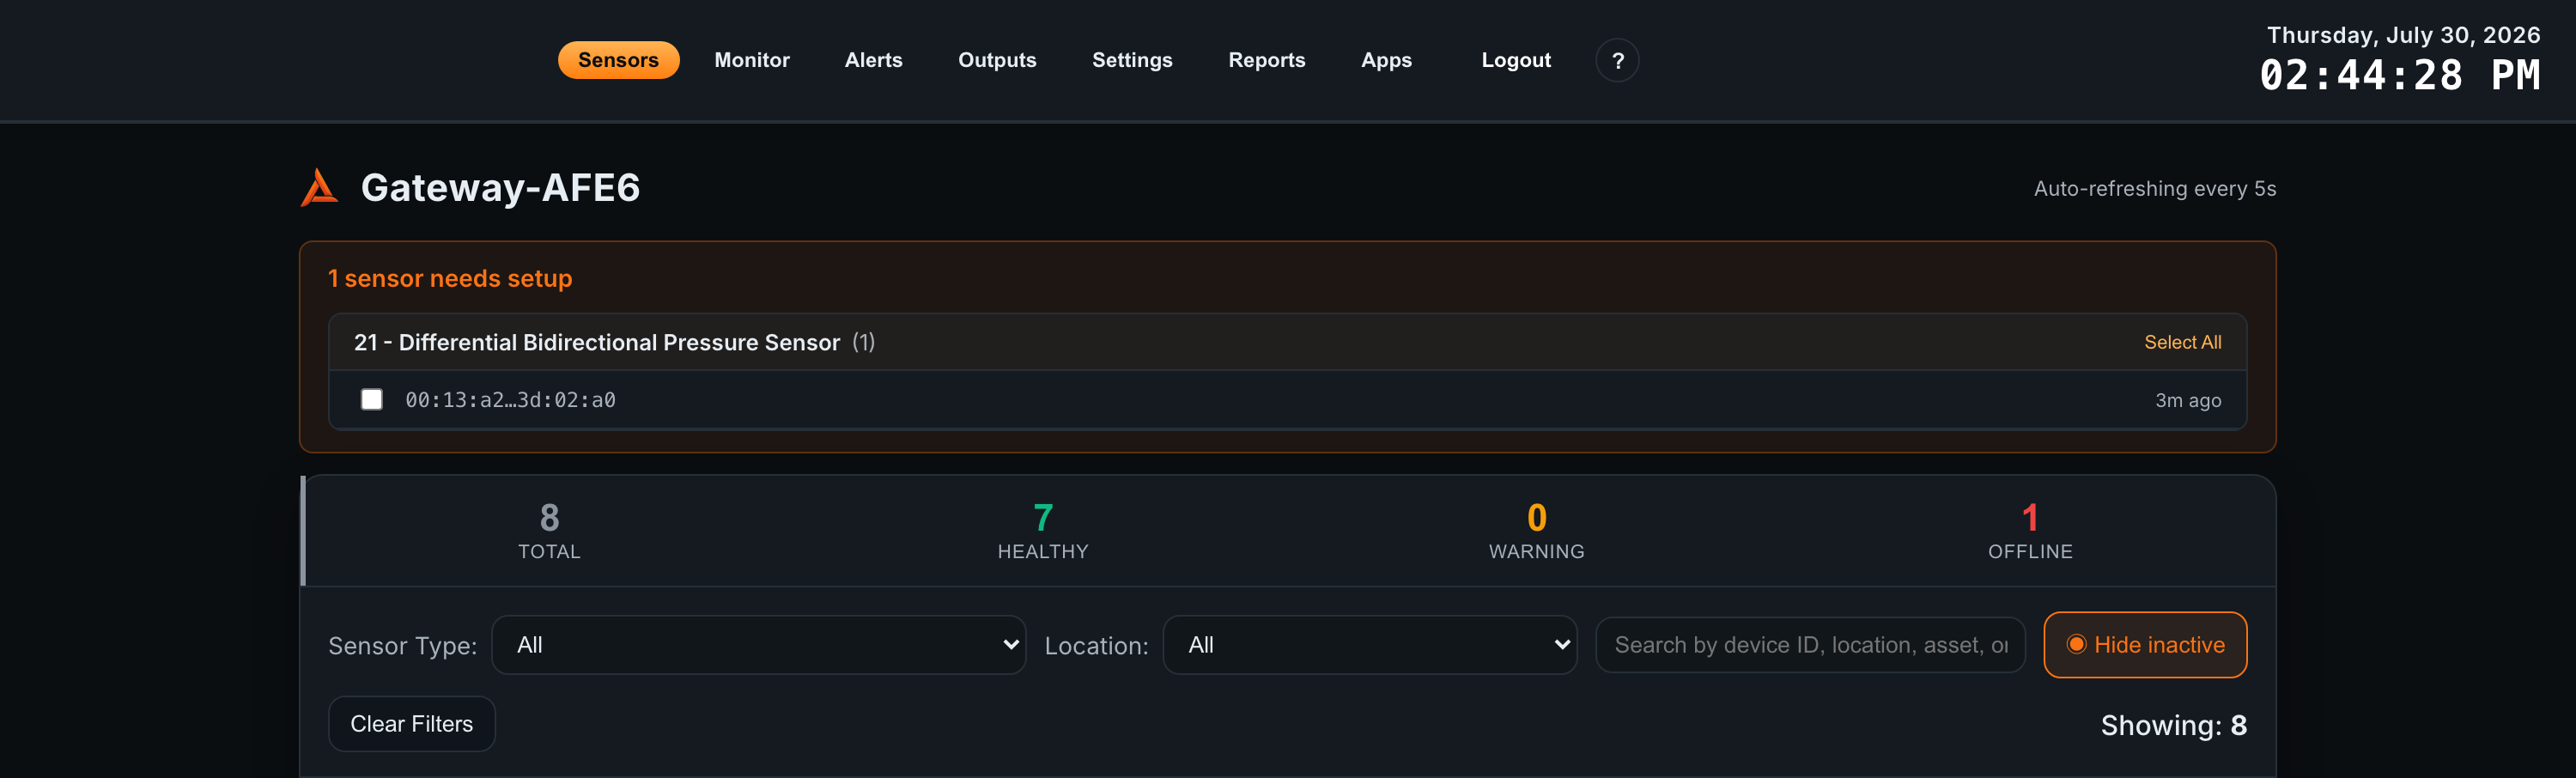
Once powered on, the sensor transmits over its long-range wireless mesh and the gateway begins hearing it. New sensors are held pending (blacklisted) until you whitelist them through the Sensor Details wizard — data is not logged until a sensor is whitelisted. The wizard walks you through naming and whitelisting each detected sensor. No radio pairing or pre-registration is required.
-
1
Power on the sensorSet the power switch to Battery (or External) and close the lid. Within one transmission interval, the gateway will begin receiving its reports. You can force an immediate transmission by briefly bridging a probe’s contacts (or wetting the rope) to trigger a wet/dry change.
-
2
Open Atrium and go to SensorsNavigate to your gateway’s local address (e.g.
http://ncd-[last-4-of-MAC].local) and click Sensors in the top navigation. A banner shows “X sensors need setup” with detected sensors grouped by type. Your unit appears under the Water Detect sensor type. -
3
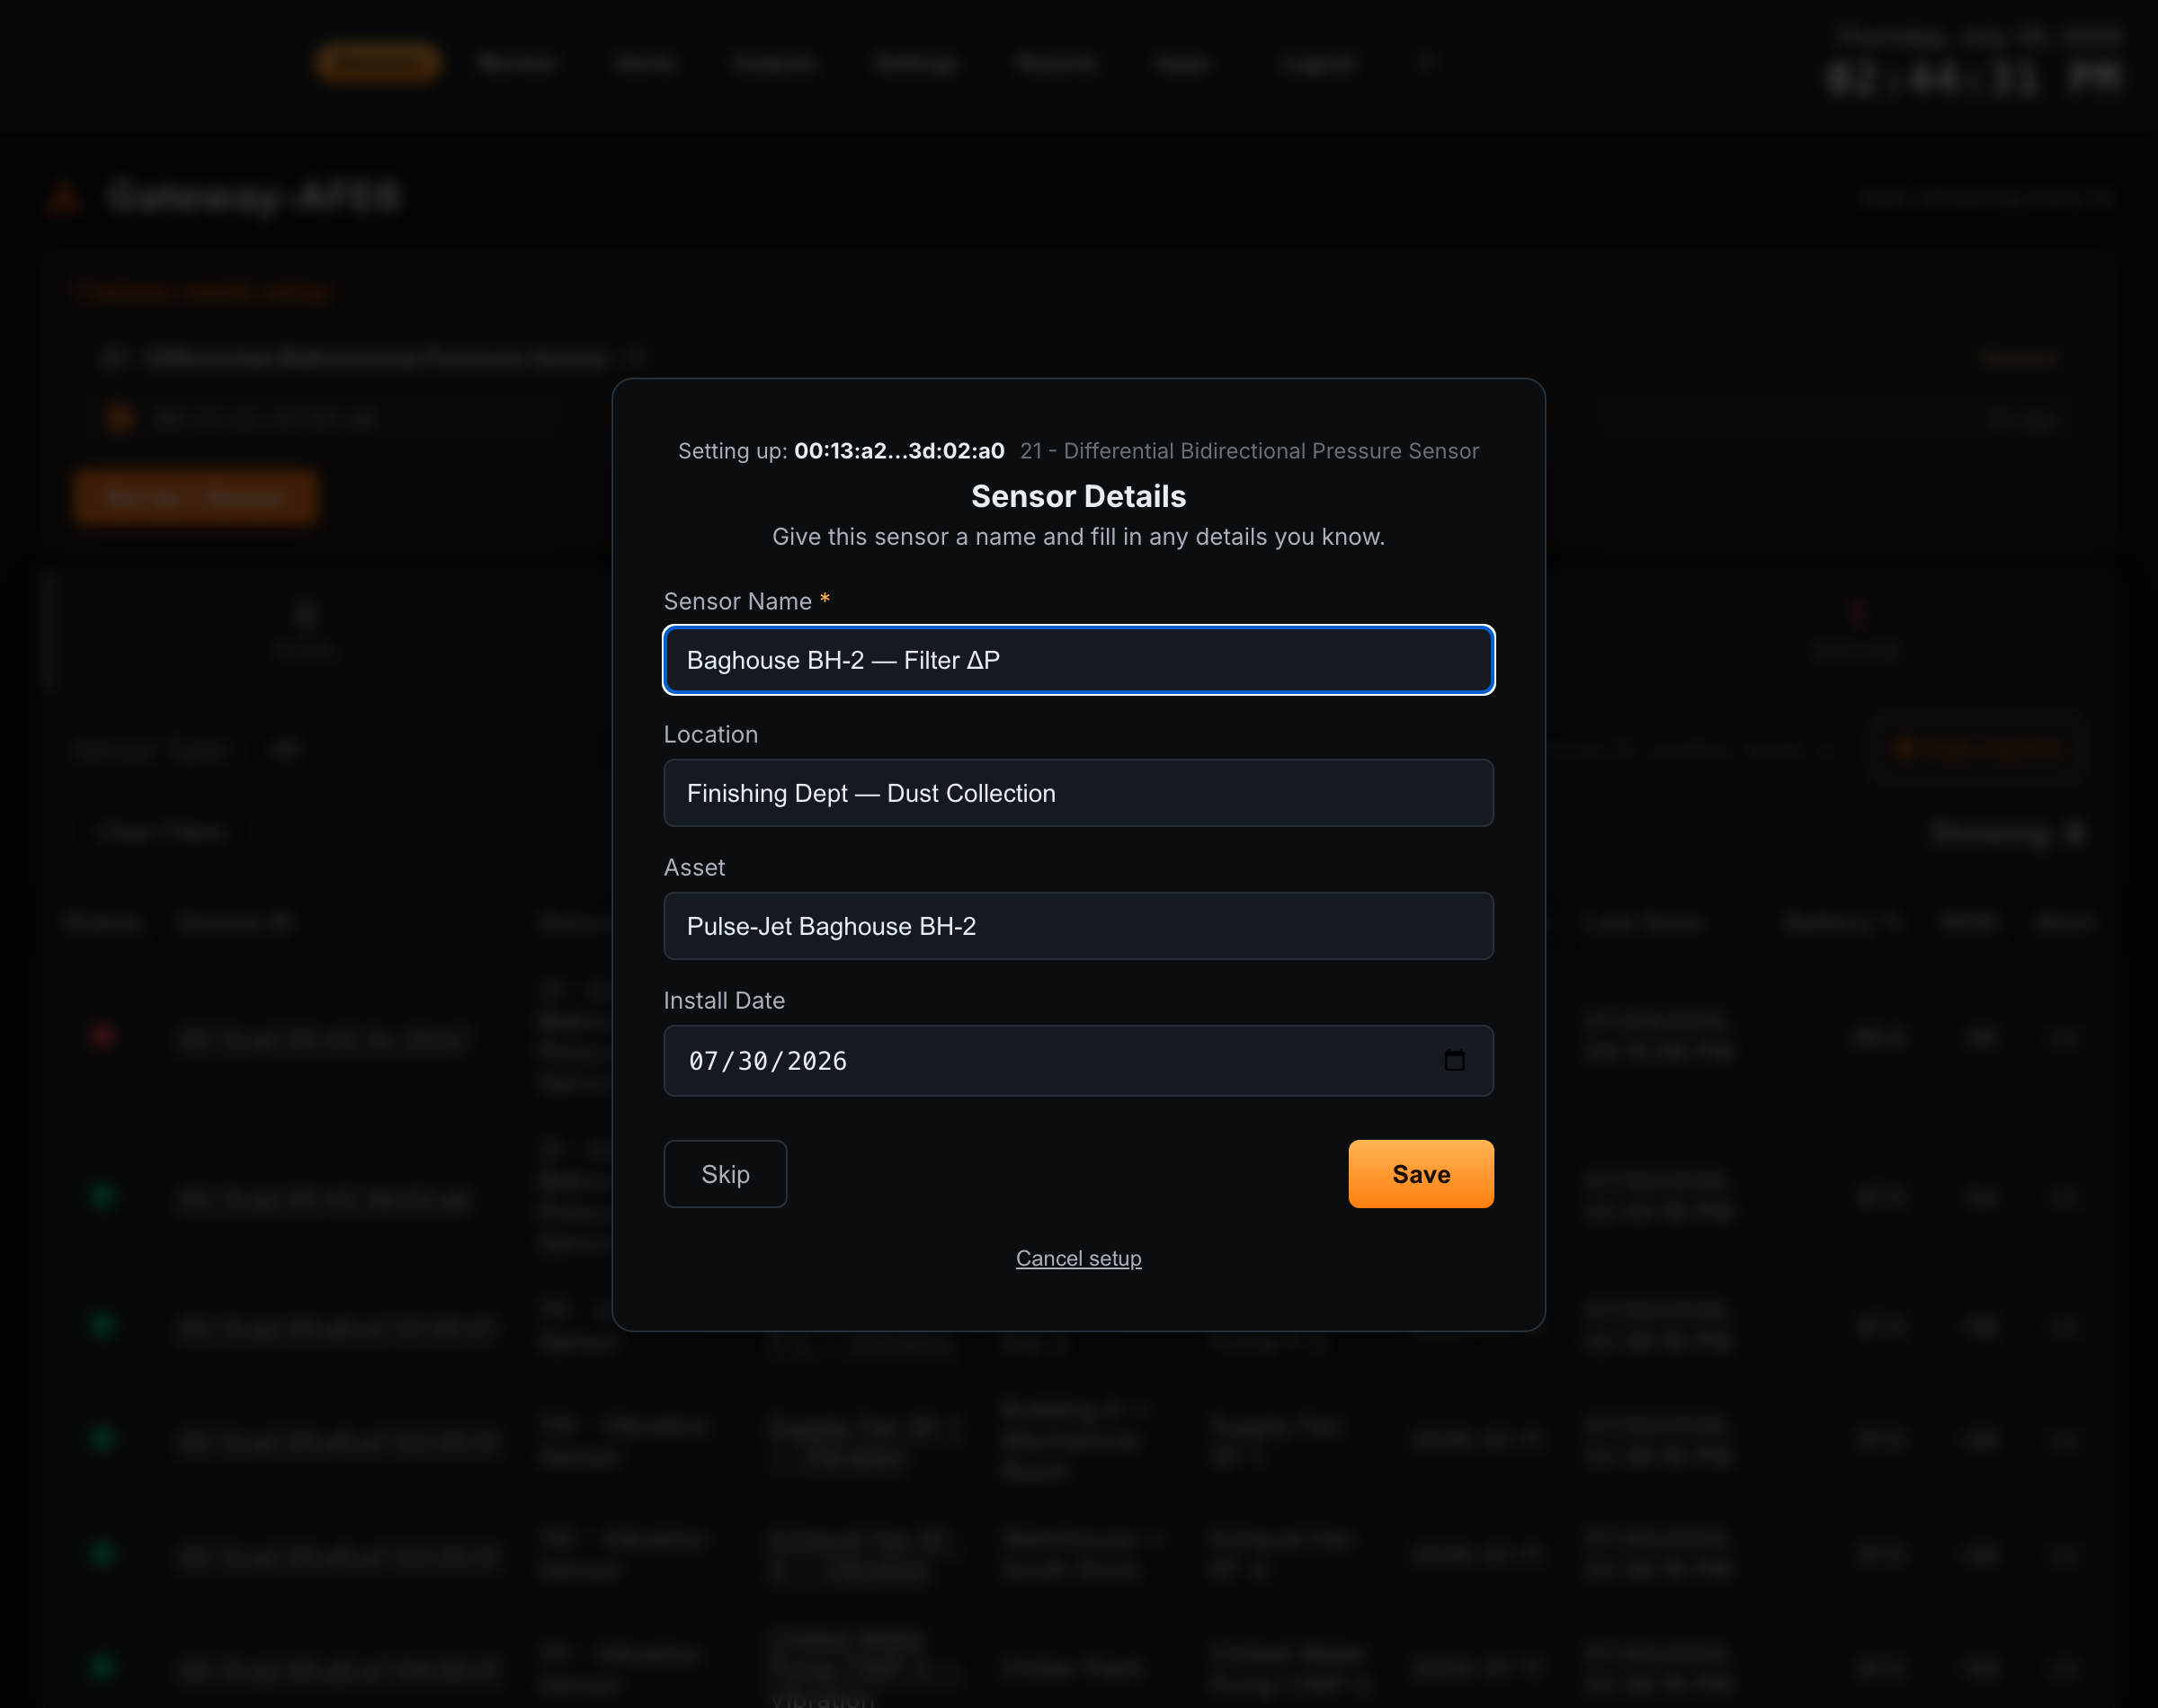
Open the Sensor Details wizardClick the sensor in the banner (or in the Sensors table) to open the Sensor Details wizard. New sensors start pending (blacklisted) — completing the wizard whitelists the sensor so Atrium begins logging its data.
-
4
Enter details and saveGive the sensor a Sensor Name, Asset, and Location (see Section 6). Use Save to whitelist and finish, Save & Next to move to the next pending sensor, or Skip to leave a sensor pending for now.
-
5
Confirm it is reportingThe whitelisted sensor now appears in the Sensors table with a recent Last Heard timestamp. Open its Dashboard to confirm the live wet/dry state for each channel.
06Sensor Meta
The Sensor Meta tab controls how Atrium identifies and tracks this sensor. Access it via Sensors → [your sensor] → Configure → Sensor Meta.
| Field | Description |
|---|---|
| Sensor Status | Whitelisted — data is logged and displayed. Blacklisted — data is ignored. New sensors are blacklisted (pending) until whitelisted via the Sensor Details wizard. |
| Sensor Name | Human-readable label shown throughout the Atrium interface (e.g. “Server Room — Floor Leak”). |
| Asset | The asset or equipment this sensor is monitoring (e.g. “CRAC Unit 2”). |
| Location | Physical location of the sensor (e.g. “Building A — Data Hall”). |
| Report Interval (seconds) | Must match the transmission interval (Delay) configured in Sensor Hardware Settings. Atrium marks the sensor offline if no data is received within 2× this value. |
| Install Date | Optional. Records when the sensor was deployed. |
| Offline Alert | When enabled, Atrium sends an email notification if the sensor stops reporting. Requires email configured in Settings → Gateway Configuration. |
07Metric Configuration
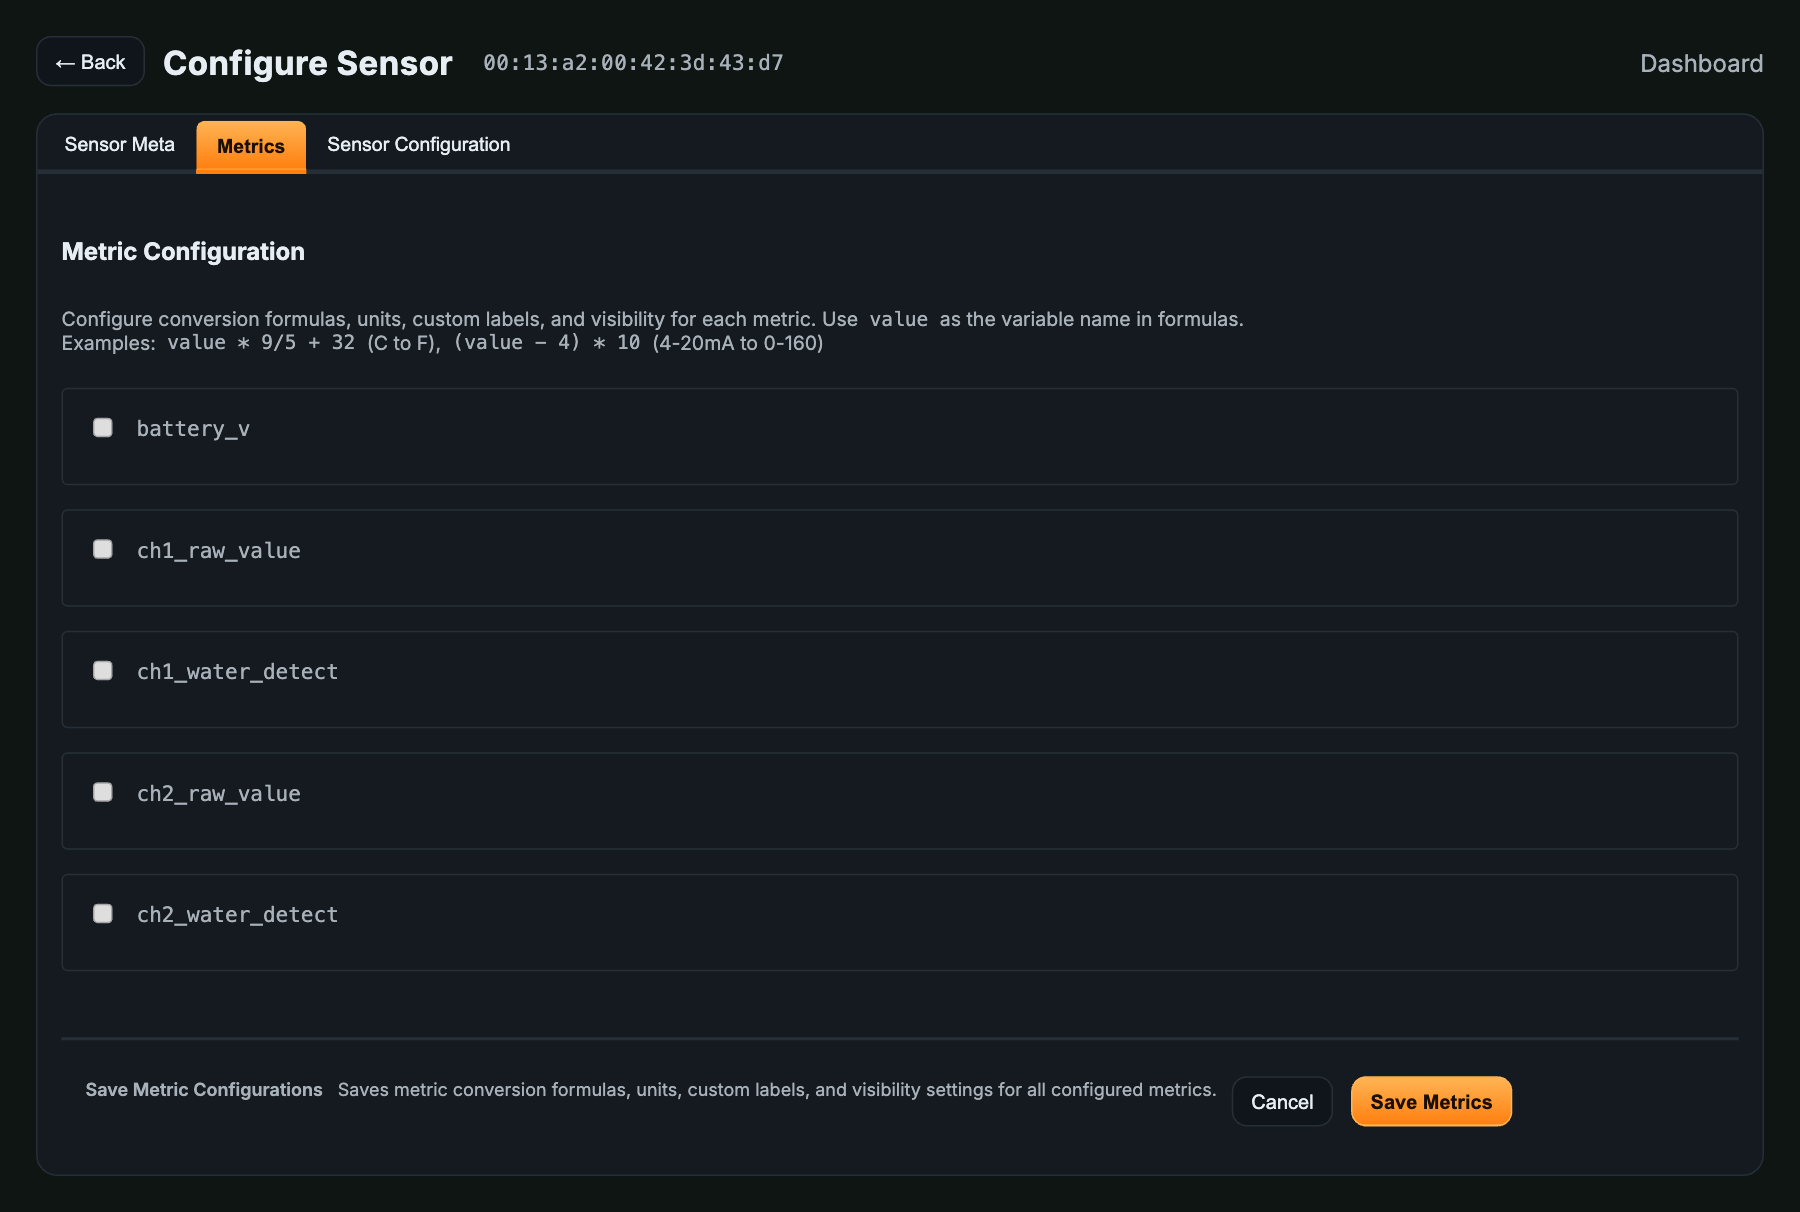
The Metrics tab lets you configure conversion formulas, units, custom labels, and dashboard visibility for each data channel. Access it via Configure → Metrics. This sensor reports a small, discrete set of metrics — the wet/dry state of each channel plus power and packet metadata.
| Metric | Raw Data | Applies To | On Dashboard by Default |
|---|---|---|---|
ch1_water_detect | Channel 1 water state — 1 = water detected (wet), 0 = dry | Both models | Shown |
ch1_raw_value | Channel 1 raw conductivity reading — the analog value the wet/dry state is derived from against a threshold | Both models | Shown |
ch2_water_detect | Channel 2 water state — 1 = water detected (wet), 0 = dry | 2-Channel only | Shown |
ch2_raw_value | Channel 2 raw conductivity reading (as above) | 2-Channel only | Shown |
battery_pct | Estimated remaining battery capacity (%) | Both models | Shown |
battery_v | Battery voltage (V) — separate field from battery_pct (~3.28 V nominal) | Both models | Hidden |
rssi | Received signal strength (dBm), positive magnitude — higher = weaker signal | Both models | Shown |
counter | Transmission counter (0–255, then rolls over); useful for detecting missed packets | Both models | Shown |
msg_type | Message type — regular for a scheduled transmission (on the configured interval) or Interrupt for an event transmission sent immediately when a channel changes state (dry→wet or wet→dry) | Both models | Shown |
Custom Conversion Formulas
Each metric supports a custom conversion formula using value as the variable name. Leave the formula as value or blank to display raw data. The water inputs are discrete states, so most deployments leave them unconverted; a formula is only useful if you want to rescale the 1/0 for a particular gauge style. Examples:
value                  // Pass the raw 1/0 water state through unchanged
value * 100 // Scale 0/1 to 0/100 for a percentage-style gaugeCustom Labels & Visibility
Each metric can be assigned a Custom Label that replaces the default metric name throughout Atrium. Unchecking Visible on Dashboard hides that metric’s card and chart without deleting data — useful for hiding the channel-2 metrics on a 2-channel unit when you are only using one probe, or hiding the raw-value channels to keep the dashboard to just the wet/dry states.
08Hardware Settings
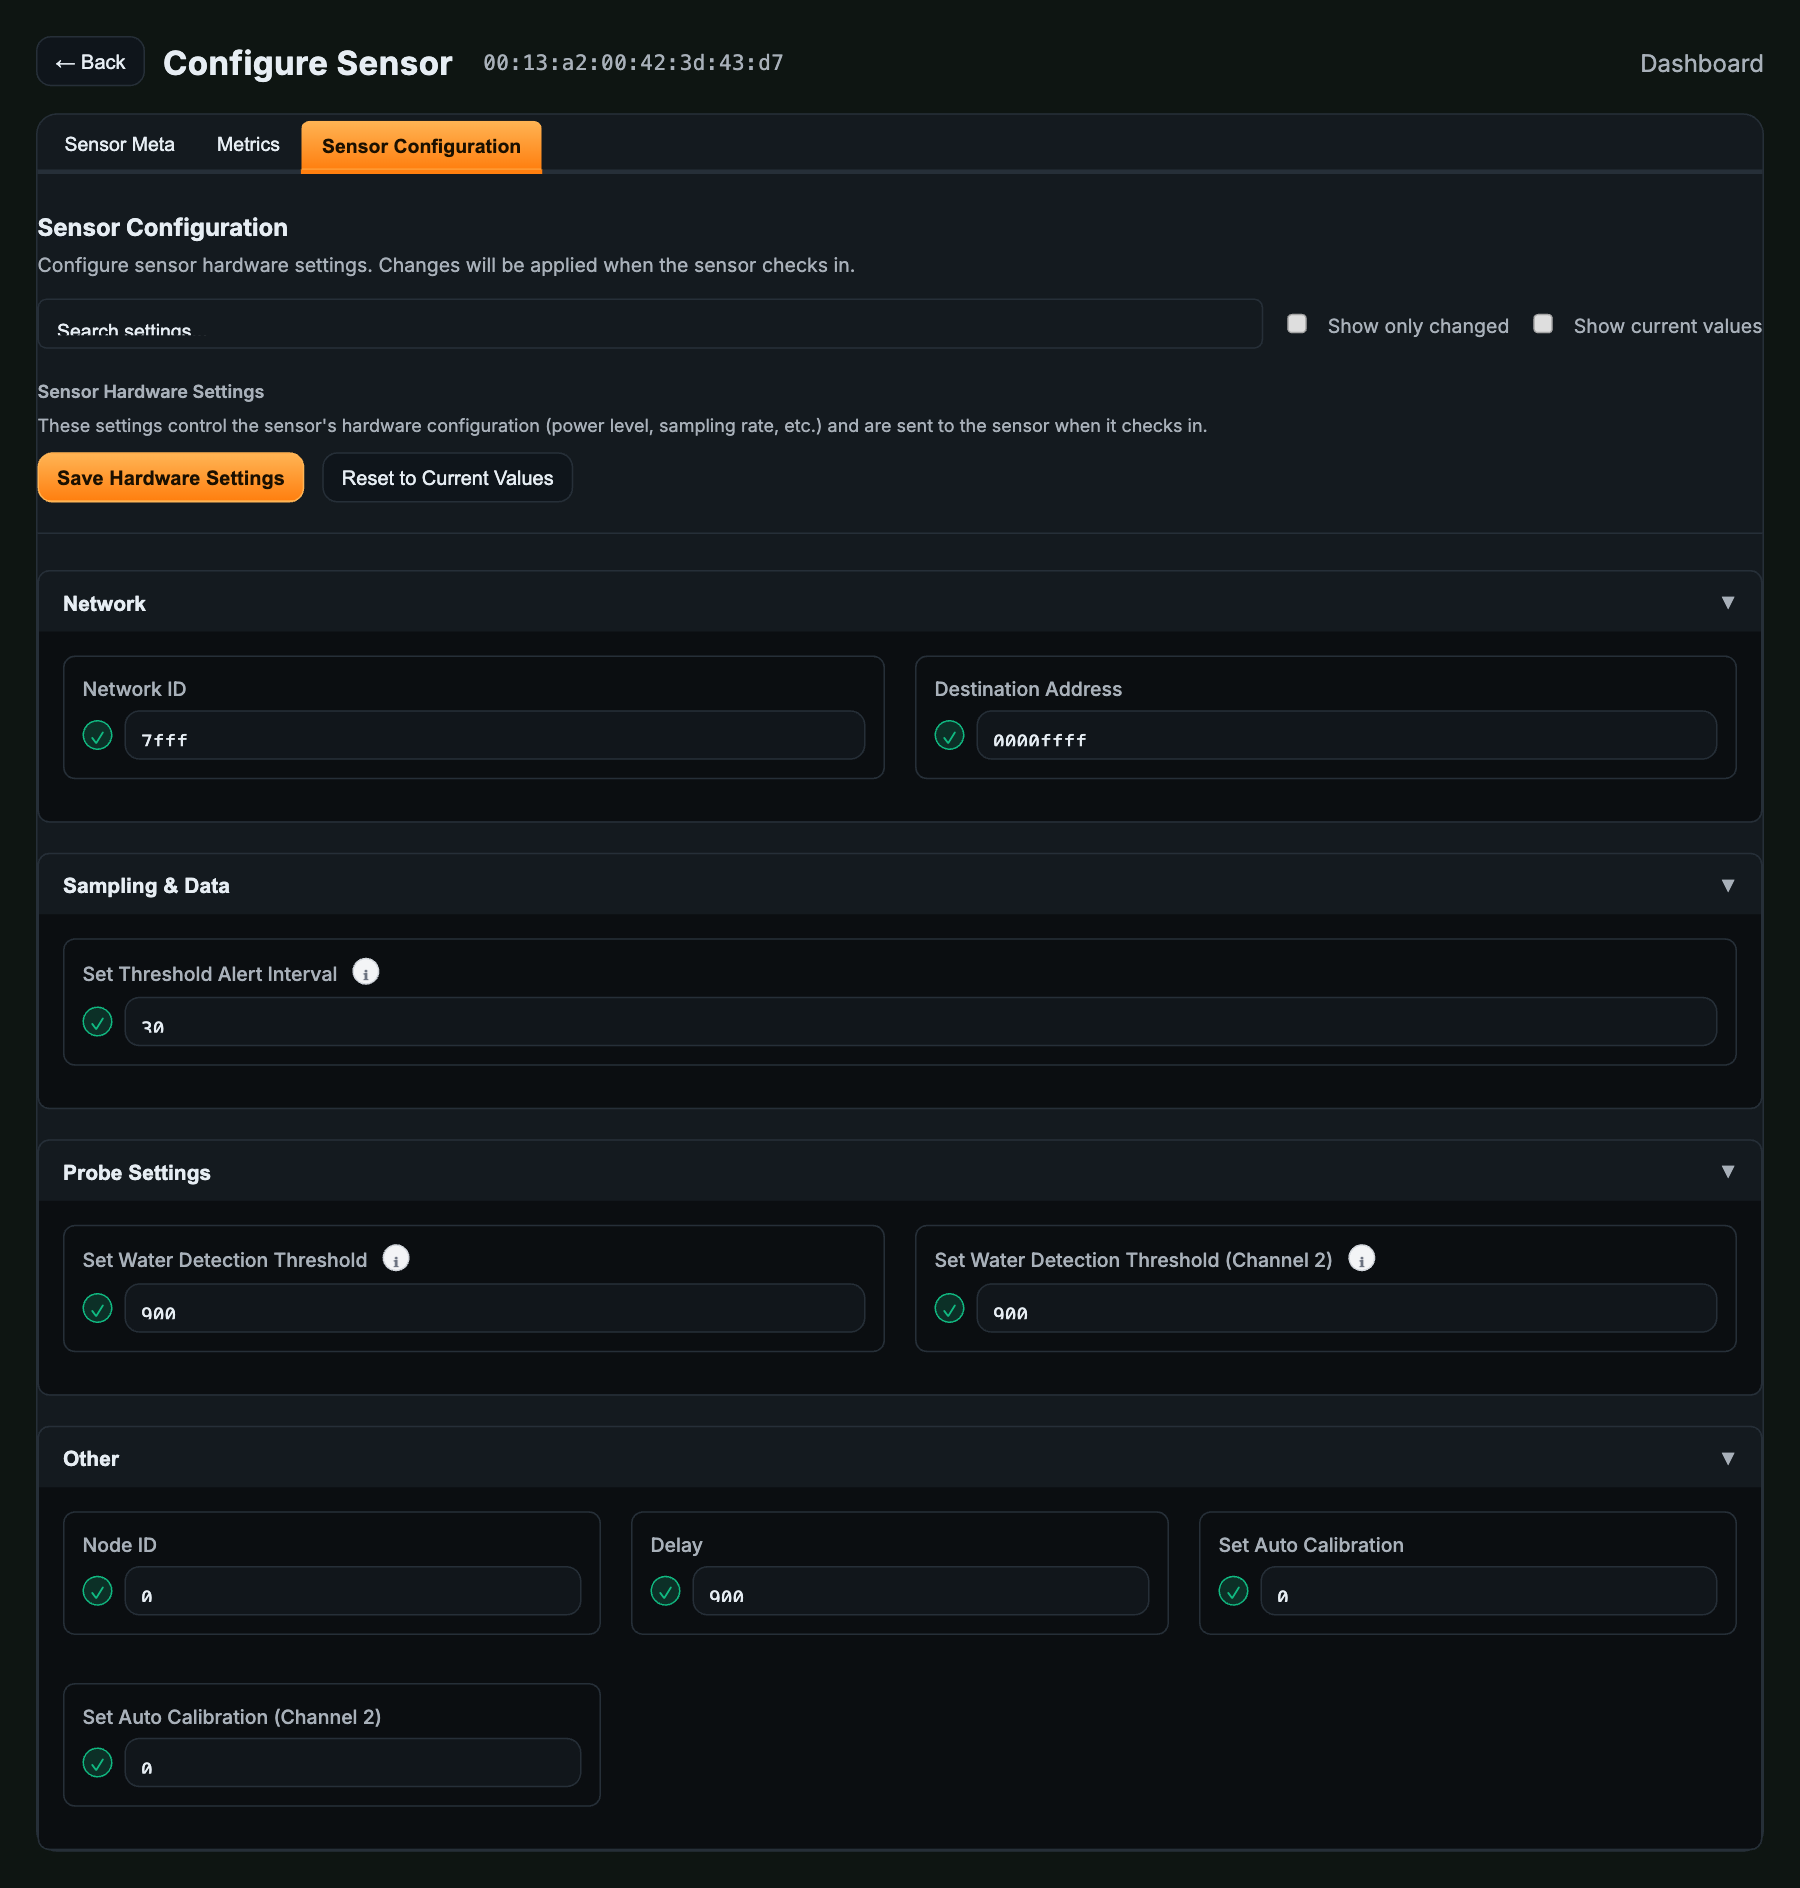
Hardware settings control the sensor’s on-board configuration — scheduled transmission interval, network addressing, and node identity. Changes are staged in Atrium and pushed to the sensor on its next check-in. Access via Configure → Sensor Configuration.
| Setting | Group | Default | Description |
|---|---|---|---|
| Network ID | Network | 7fff | The wireless network ID. Must match the gateway’s network ID for the sensor to communicate. |
| Destination Address | Network | 0000ffff | The broadcast address the sensor transmits to. Typically left at default unless using a custom mesh topology. |
| Set Threshold Alert Interval | Sampling & Data | 30 | How often the sensor evaluates and reports on the water-detection threshold between scheduled transmissions. |
| Set Water Detection Threshold | Probe Settings | 900 | Channel 1 sensitivity: the raw conductivity level the reading must cross for the channel to report wet (ch1_water_detect = 1). Raise it to require more water/conductivity before triggering; lower it for higher sensitivity. |
| Set Water Detection Threshold (Channel 2) | Probe Settings | 900 | Channel 2 detection threshold (2-channel model), as above for ch2_water_detect. |
| Node ID | Other | 0 | Optional human-readable node identifier within the mesh network. |
| Delay | Other | 900 sec (15 min) | Scheduled transmission interval in seconds. The sensor also transmits immediately on any wet/dry change, independent of this value. Lower values report status more often at the cost of battery life. |
| Set Auto Calibration | Other | 0 | Channel 1 auto-calibration of the dry baseline. Leave at default unless the probe environment needs re-baselining. |
| Set Auto Calibration (Channel 2) | Other | 0 | Channel 2 auto-calibration (2-channel model). |
Adjusting the Transmission Interval
-
1
Go to Sensor ConfigurationNavigate to Sensors → [your sensor] → Configure → Sensor Configuration.
-
2
Update the Delay valueEnter your desired scheduled-report interval in seconds. Because a leak is reported immediately regardless of this setting, a longer Delay is usually fine for water monitoring and greatly extends battery life.
-
3
Click Save Hardware SettingsThe new value is staged and pushed to the sensor on its next check-in (shown as Pending until confirmed).
-
4
Update the Report Interval in Sensor MetaUpdate the Report Interval on the Sensor Meta tab to match your new Delay so offline detection stays accurate.
Battery Life
The sensor delivers up to 5 years of battery life. Actual life depends on your configuration — the scheduled transmission interval (Delay), how often leaks occur, environment, and temperature all affect it. A longer Delay greatly extends battery life, and because leaks are reported immediately regardless of the Delay, a long interval is usually fine for water monitoring. To estimate battery life for your exact settings, use NCD’s battery life calculator. For continuous operation, run the sensor on the external power supply option.
09Temperature Units
Atrium provides a global Temperature Display Unit setting in Gateway Settings that controls how temperature readings appear across the entire interface. This sensor does not report a temperature metric — it reports digital wet/dry states — so this setting has no effect on its dashboard. It is documented here for completeness, as it applies to any temperature-reporting sensors sharing the same gateway.
-
1
Open Gateway SettingsClick Settings in the top navigation to open Gateway Configuration.
-
2
Select Temperature Display UnitUnder Temperature Display Unit, toggle between °C and °F. This applies immediately to all temperature readings across Atrium — it does not change anything on this water detect sensor’s dashboard.
-
3
Save ConfigurationClick Save Configuration at the bottom of the page to apply the change.

10Sensor Dashboard
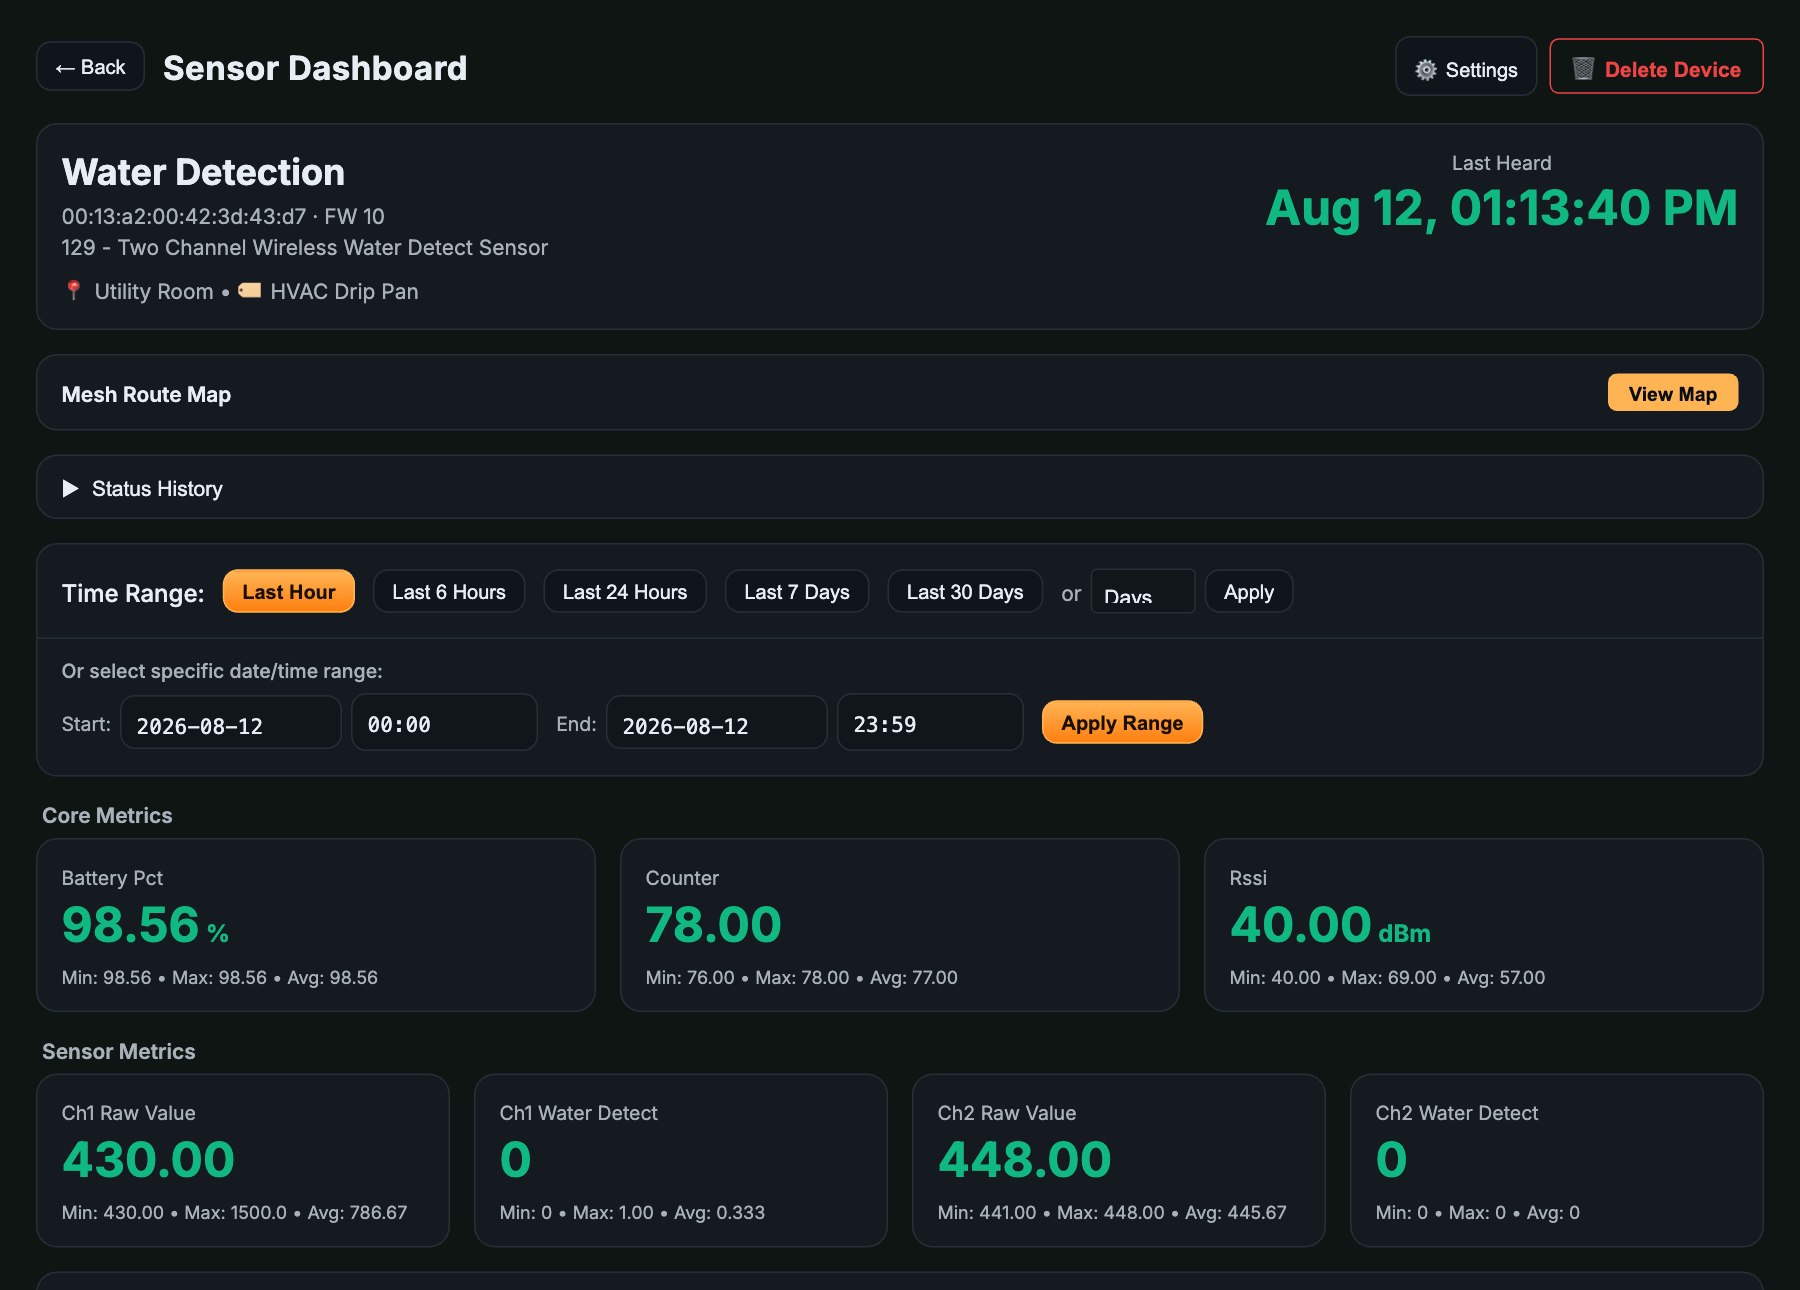
The Sensor Dashboard provides a real-time and historical view of all data from this sensor. Access it by clicking the sensor in the Sensors list and selecting Dashboard.
Live Metrics
| Metric | Unit | Description |
|---|---|---|
Ch1 Water Detect (ch1_water_detect) | 1 / 0 | Channel 1 water state — 1 = water detected (wet), 0 = dry |
Ch1 Raw Value (ch1_raw_value) | — | Channel 1 raw conductivity reading behind the wet/dry decision |
Ch2 Water Detect (ch2_water_detect) | 1 / 0 | Channel 2 water state (2-channel model) — 1 = water detected (wet), 0 = dry |
Ch2 Raw Value (ch2_raw_value) | — | Channel 2 raw conductivity reading (2-channel model) |
| Battery Pct | % | Estimated remaining battery capacity |
| RSSI | dBm | Signal strength as a positive magnitude — higher values mean a weaker signal |
| Counter | — | Packet counter that increments with each transmission; useful for detecting missed packets |
Message Type (msg_type) | — | regular = scheduled interval transmission; Interrupt = event-driven, sent immediately on a wet/dry state change |
Time Range & Charts
Use the time range selector to view historical data for the last hour, 6 hours, 24 hours, 7 days, or 30 days. A custom date/time range is also available. Each channel’s Water Detect metric plots as a step chart — flat at 0 (dry) with a step up to 1 for the duration of each detected event — making it easy to see exactly when water was present and when it cleared. The Raw Value chart shows the underlying conductivity reading. Drag to zoom into a time window, double-click to reset.
Mesh Route Map
Click View Map in the Mesh Route Map panel to visualize how this sensor’s data routes through the wireless mesh to reach the gateway. Useful for diagnosing signal path issues in multi-sensor deployments.
Interactive Preview
The panel below simulates the Atrium Sensor Dashboard for this Water Detect sensor (2-channel shown). Data updates every 5 seconds to demonstrate the live monitoring experience.
11Setting Alerts
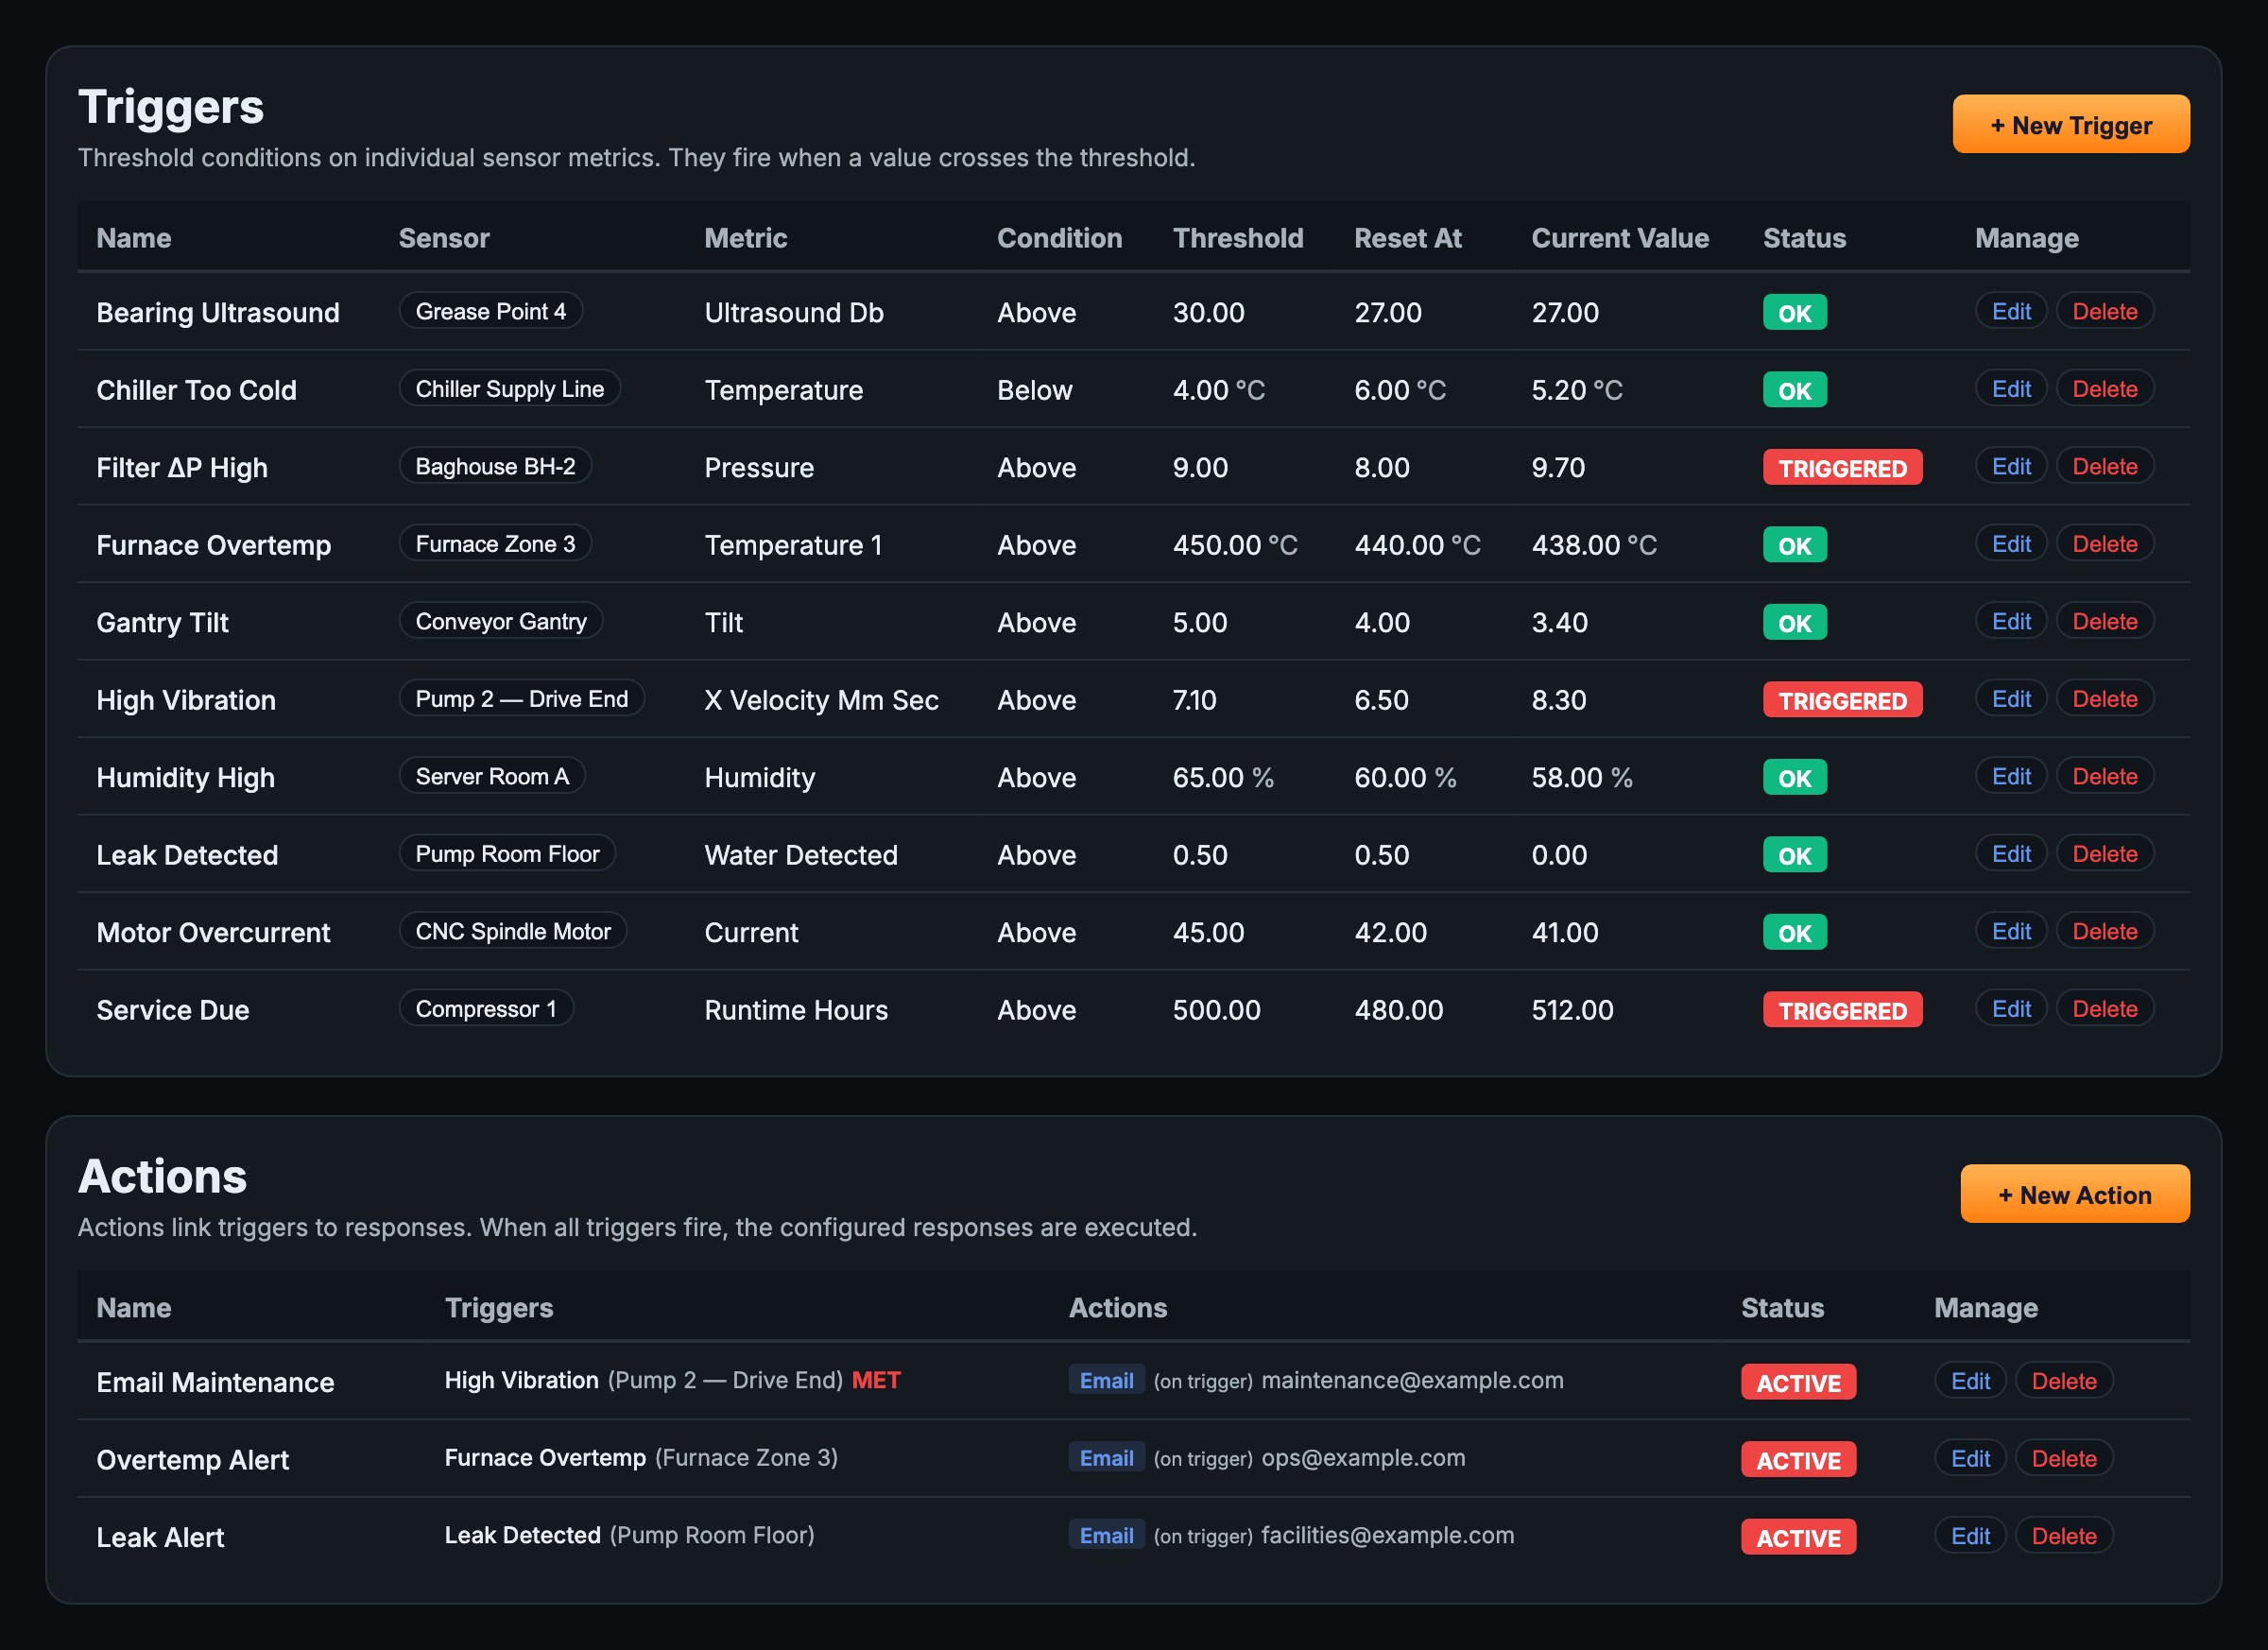
Atrium uses a Triggers & Actions model for alerting. A Trigger defines the threshold condition on a metric. An Action defines what happens when all assigned triggers fire. Navigate to Alerts in the top navigation (the page is titled Alerts & Actions) to configure. For a water detect sensor, the essential alert is simply “notify me when a channel goes wet.”
Creating a Trigger
-
1
Go to Alerts → TriggersClick + New Trigger to open the Create Trigger form.
-
2
Configure the triggerSelect the Device, the Metric (
ch1_water_detectorch2_water_detect), Condition Above, and Threshold0— so the trigger fires as soon as the channel reports1(wet). The Reset At column sets the value the metric must return to before the trigger can fire again; set it to0so the alert re-arms once the channel is dry. Click Create Trigger.
Creating an Action
-
1
Go to Alerts → ActionsClick + New Action. Actions link one or more triggers to a response — when all assigned triggers fire, the action executes.
-
2
Assign triggers and configure the responseSelect the trigger(s) to watch and configure the response. Atrium supports email notifications and relay output actions (to drive an external relay — for example, sound a local alarm or close a solenoid valve on a leak). Email must be configured in Settings → Gateway Configuration for email actions to work.
12Exporting Data
All sensor data can be exported to CSV directly from the Sensor Dashboard for use in spreadsheets, reporting tools, or maintenance records.
-
1
Open the Sensor DashboardNavigate to the sensor and click Dashboard.
-
2
Select a time rangeChoose the time range you want to export using the selector at the top of the dashboard.
-
3
Click “CSV” on the desired metricEach metric chart has a CSV download button. Click it to download a timestamped CSV of that channel’s wet/dry history for the selected time range — useful for documenting when and how long water was present.
13Product Notes
Reference information for ordering and accessories.
| Item | Detail |
|---|---|
| SKU | PR63-22A (1-Ch Puck, type 128) / PR63-22B (2-Ch Puck, type 129) / PR63-22C (1-Ch Rope, type 128) / PR63-22D (2-Ch Rope, type 129) |
| Wireless Module | Select 900 MHz (North America), 868 MHz (Europe), or 2.4 GHz (worldwide) at time of order |
| Battery | D-cell (LR20) lithium with integrated supercapacitor — field-replaceable; external power supply also supported |
| Probes | Puck (spot) probe or water rope (linear) probe — one per channel; additional probes available separately |
| Receiver Options | Atrium IIoT Gateway, Enterprise IIoT Gateway / Lite, or NCD Wireless-to-USB / Wireless-to-Ethernet modem |
| Mounting | 1/4 NPT, 1/4″–28 UNF, or optional magnetic mounting hardware |
Resources & Downloads
- Enterprise Line Industrial IoT Sensors FAQ
- Long Range IoT Wireless Sensor FAQ
- Wireless Communication Module Recovery Files — firmware recovery
- Python NCD Enterprise Library — API / integration
- NCD Alpha Station Software — configuration utility
14Troubleshooting
Common issues and their solutions.
Sensor not appearing in Atrium
- Confirm the sensor is powered — activate the magnetic CFG switch with a magnet (or press and hold the CFG button) and check that the TEST LED illuminates.
- Verify the sensor’s wireless frequency (900/868 MHz or 2.4 GHz) matches the gateway’s radio.
- Verify the sensor’s Network ID matches the gateway’s Network ID.
- Move the sensor closer to the gateway to rule out range issues — test within 10 feet first.
- Trigger a transmission by briefly bridging a probe’s contacts (or wetting the rope) so the sensor reports right away instead of waiting for the next scheduled interval.
- Check that the Atrium gateway is powered on and connected to your network.
Sensor showing as Offline in Atrium
- Verify the Report Interval in Sensor Meta matches the sensor’s scheduled transmission interval (Delay) in Hardware Settings. Remember that wet/dry event transmissions do not count toward offline detection — base Report Interval on the scheduled Delay.
- Check the
battery_pcton the last received reading — replace the battery if low. - Check the RSSI value — remember higher numbers mean a weaker signal. Readings consistently above 75 dBm indicate marginal signal; reposition the sensor or gateway, or add a repeater node.
A channel reads wet (or dry) when it shouldn’t
- Stuck reading wet: check for residual water, condensation, or conductive residue bridging the probe contacts. Dry and clean the probe; mineral scale or an oil film can hold a false wet reading or, conversely, insulate the contacts.
- Never reads wet during a known leak: confirm the probe is flat on the surface at the true low point (puck) or that the rope actually contacts the pooling water along its run. Verify the probe is connected to the expected channel terminal.
- Wrong channel: on a 2-channel unit, confirm which probe is on channel 1 (
ch1_water_detect) vs channel 2 (ch2_water_detect) and that the Custom Labels match the physical placement.
Hardware settings not updating on sensor
- Settings are staged and applied on the sensor’s next check-in — wait up to one transmission interval (Delay) after saving; the change shows as Pending until then.
- To apply changes immediately, wake the sensor with the magnetic RESET switch (or the PCB RESET button), or by triggering a wet/dry change on a probe.
- Confirm the sensor is actively transmitting by checking the Last Heard timestamp on the dashboard.
15Factory Reset
A factory reset restores the sensor’s wireless module to default settings — useful if the sensor is not being detected by a gateway, or if you are redeploying it to a new network. The unit has both external magnetic RESET/CFG switches (operated with a magnet, no disassembly) and physical RESET/CFG buttons on the PCB. Either method works; the magnetic switches are quicker since they need no tools. In both cases, holding CFG for more than about 15 seconds after a RESET triggers the factory reset — a shorter hold may only enter configuration mode.
Option A — Magnetic Switches (no disassembly)
- 1Trigger the RESET switchHold a magnet near the magnetic RESET switch, then move it away.
- 2Wait ~1 secondAllow approximately 1 second before proceeding.
- 3Hold the CFG switch for ~15–20 secondsHold the magnet near the magnetic CFG switch for at least ~15 seconds (a shorter hold does not fully reset), then move it away. This restores factory defaults.
- 4Wait 3–5 secondsAllow 3–5 seconds for the reset to complete.
- 5Trigger RESET againHold the magnet near the RESET switch once more, then move it away. This returns the sensor to normal Run Mode. Re-pair it in Atrium (Section 5) and confirm the Network ID matches your gateway.
Option B — Physical Buttons (open enclosure)
- 1Open the enclosureRemove the lid screws and lift the cover to expose the PCB RESET and CFG buttons.
- 2Press and release RESETPress and release the RESET button on the PCB.
- 3Hold CFG for ~15 secondsWithin about 1 second of the reset, press and hold the CFG button for approximately 15 seconds, then release. This restores factory defaults.
- 4Wait 3–5 secondsAllow 3–5 seconds for the reset to complete.
- 5Press RESET, close, and re-pairPress and release RESET once more to return to normal operation, re-seal the enclosure, then re-pair the sensor in Atrium (Section 5). Confirm the Network ID matches your gateway.