

Atrium IIoT Gateway User Guide
Everything you need to unbox, power up, and operate your Atrium IIoT Gateway — a complete local platform for monitoring and managing your entire fleet of NCD wireless sensors, no cloud required.
01Introduction
The Atrium IIoT Gateway is an industrial edge device that receives data from your NCD wireless sensors over a long-range wireless mesh network and turns it into a live, browser-based monitoring platform called Atrium.
What is Atrium?
Atrium is a local web dashboard for monitoring wireless sensor networks. It runs entirely on the gateway — data ingestion, the local database, the API, and the web interface all live on the device. There is no cloud connection required; the internet is only needed if you choose to enable Remote Access, push data to an external MQTT broker, or send email alerts.
Open a browser on any device on the same network as the gateway, sign in, and you get real-time visibility into every connected sensor: current readings, health status, historical charts, alerts, automations, scheduled reports, and a suite of industrial apps for productivity, OEE, energy, and environmental monitoring.
Offline & router capabilities
Atrium is built to run without an internet connection. Because data ingestion, storage, dashboards, alerts, and automations all execute on the gateway itself, your sensor network keeps collecting and recording data even when the site is fully offline — the internet is only used for optional cloud features (Remote Access, MQTT push, and email alerts), which resume automatically when connectivity returns.
The gateway also doubles as an industrial network router, so it can provide connectivity in the field rather than depend on existing infrastructure: dual Ethernet (WAN/LAN), dual-band Wi-Fi (access point or client), and optional cellular with automatic SIM detection for backhaul or failover, plus configurable firewalls and VPN for secure remote access. A single gateway can receive your wireless sensors, host Atrium, and route the local network at the same time.
02Hardware & What’s in the Box
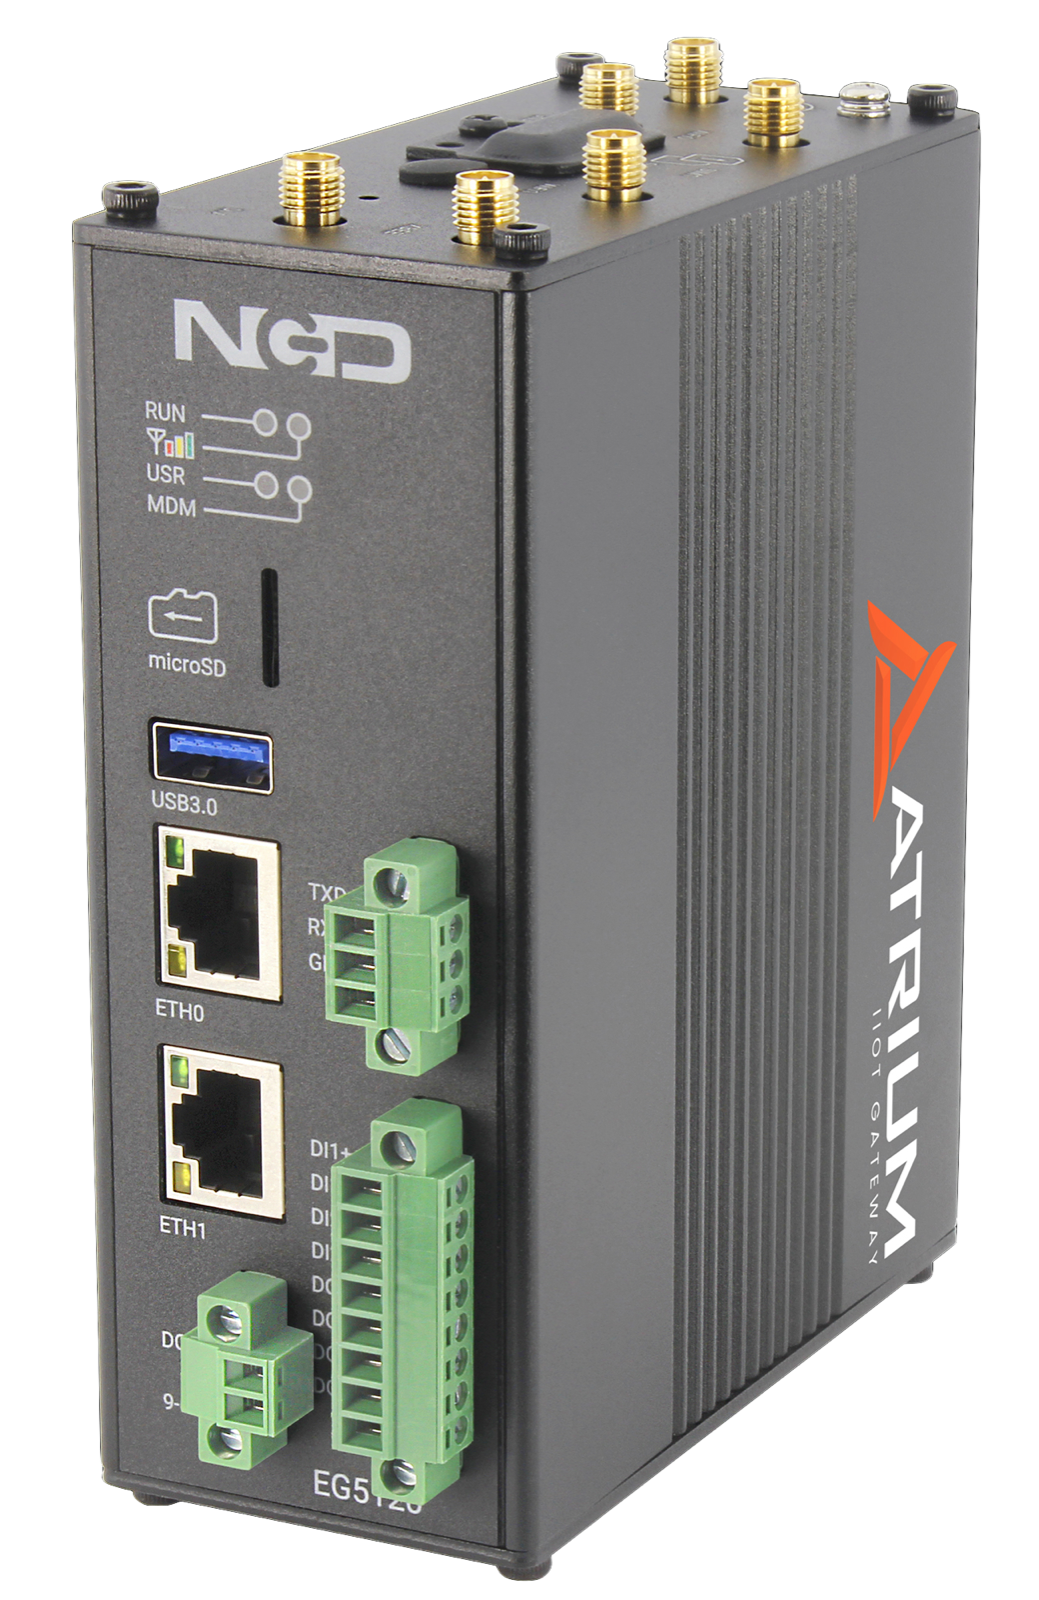
Your gateway is built on the EG5120 industrial edge platform. Everything you need to get on the air is included in the box.
In the box
- Atrium IIoT Gateway unit (pre-loaded with the Atrium software platform)
- Long-range wireless radio module for your selected frequency
- Frequency-specific XBee antenna (868–900 MHz or 2.4 GHz dipole)
- Two WiFi antennas (2.4 GHz)
- Two cellular antennas with 1 metre cables
- 12 VDC power supply with international AC outlet adapters
Ports & connectors
| Connector | Purpose |
|---|---|
| ETH0 (Ethernet) | Uplink / client port (default). Connect this to your existing LAN or router — it is the port you use to reach the Atrium dashboard and to give the gateway internet access. |
| ETH1 (Ethernet) | Downstream port (default). Creates its own isolated network (with its own DHCP) for other devices. Both ports are configurable and have customizable firewalls. |
| Power | 9–60 VDC input. A 12 VDC supply with international AC outlet adapters is included. |
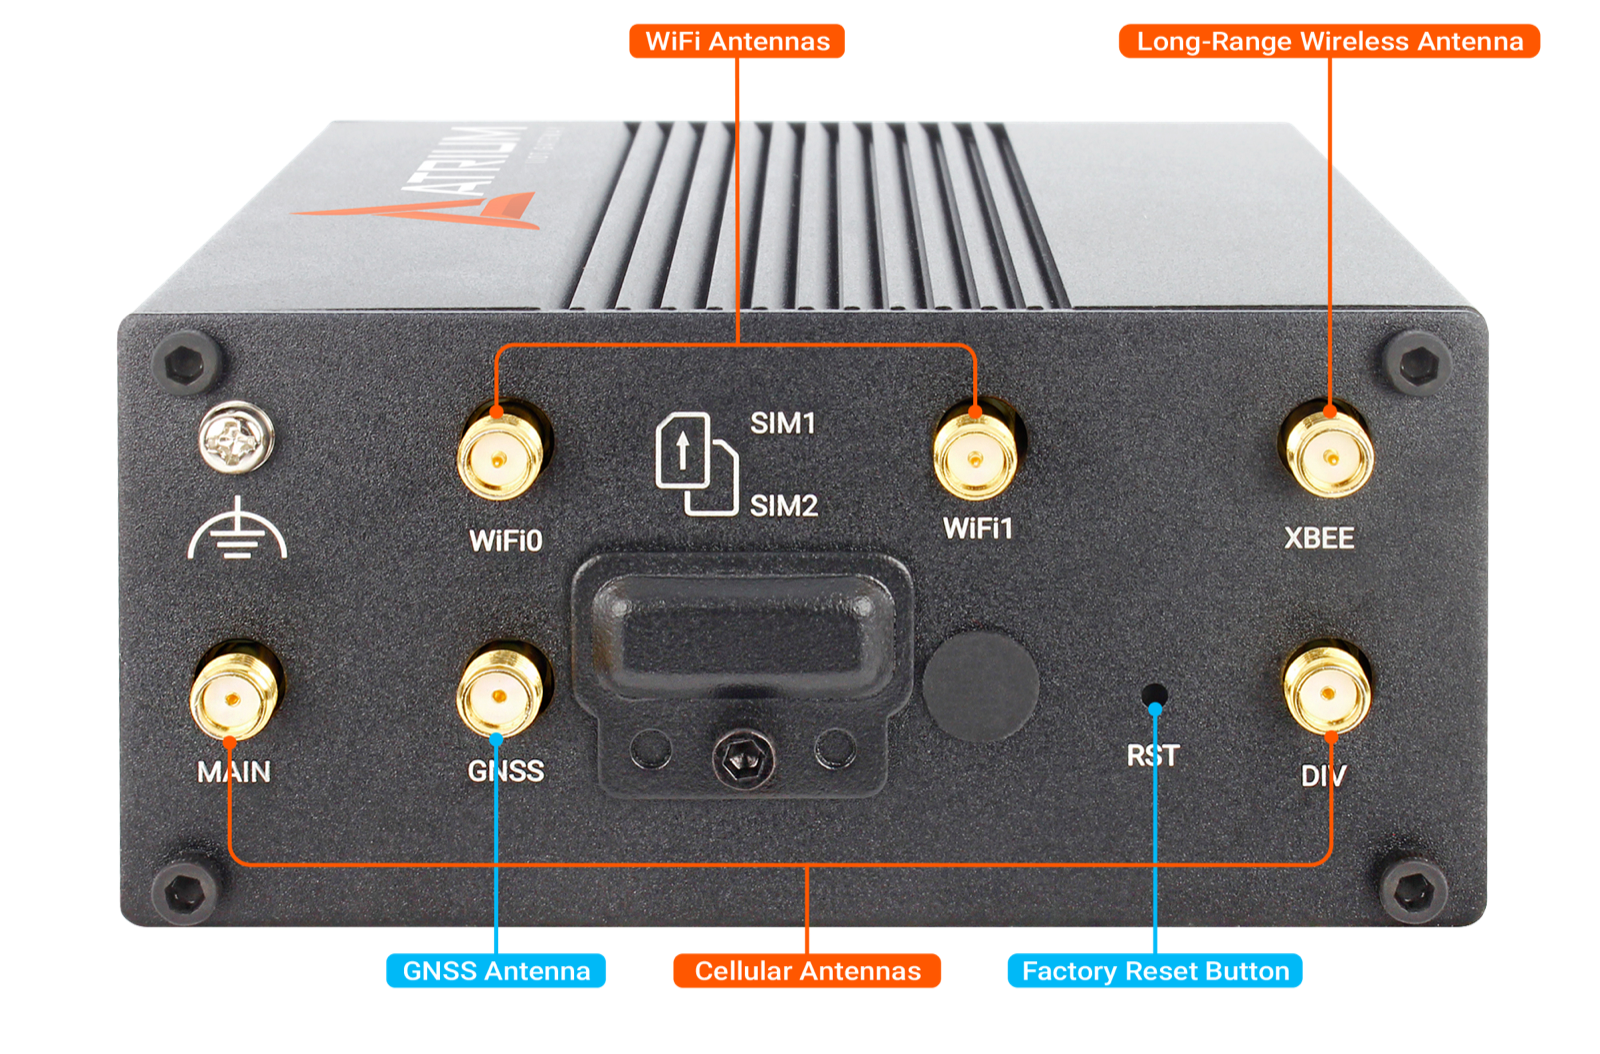
| XBee (RP-SMA) | The long-range radio that talks to your NCD sensors. Connect the included frequency-specific antenna here. |
| Cellular (RP-SMA) × 2 | Two connectors, labelled Main and Div (diversity). Connect both included cellular antennas for the best signal. |
| GPS (RP-SMA) | GNSS antenna connector, for gateways using location services. |
| WiFi (RP-SMA) × 2 | Connect the two included 2.4 GHz WiFi antennas. |
| SIM slot | Optional cellular connectivity with automatic SIM detection. |
Antenna connections
The gateway has multiple antenna connectors. Attach each included antenna to its matching connector as shown below — the long-range wireless (sensor radio) antenna, plus Wi-Fi and cellular antennas if those radios are used.
Wireless frequency options
The gateway is ordered with one long-range wireless radio to match the frequency of your NCD sensors and your region. Sensors and gateway must be on the same frequency to communicate.
| Frequency | Region |
|---|---|
| 900 MHz | North & South America |
| 868 MHz | Europe |
| 2.4 GHz | Worldwide |
Full gateway capabilities
Because it is the Enterprise IIoT Gateway underneath, your Atrium gateway is a full-featured industrial edge device even before you open Atrium. All of the standard gateway capabilities are available to you:
03Physical Setup & First Access
Get the gateway powered, on your network, and logged in for the first time.
Watch: Gateway & Sensor Hardware Setup
Connect the hardware
-
1
Attach the antennaConnect the included antenna to the XBee RP-SMA connector. Position it vertically and away from large metal surfaces for best range. If your gateway uses WiFi, cellular or GPS, attach those antennas to their own labelled connectors at the same time.
-
2
Connect to your networkConnecting ETH0 to your LAN or router gives the gateway internet access, but it is not required to reach the dashboard. You can also reach Atrium over the gateway’s own WiFi access point, over your local WiFi network once the gateway has joined it, or by plugging a computer directly into ETH1.
-
3
Apply powerConnect the included power supply (9–60 VDC input). The gateway boots and the Atrium software starts automatically — allow a minute or two for services to come up.
Open Atrium in a browser
On any device connected to the same network, open a web browser and navigate to the gateway’s address. Atrium is served on the standard web port, so no port number is needed:
http://<gateway-hostname>
# example
http://ncd-d8fc.local
If .local hostname resolution isn’t available on your network, use the
gateway’s LAN IP address instead (you can find it from your router’s device list, or
later on the Settings page under Gateway Info).
Log in
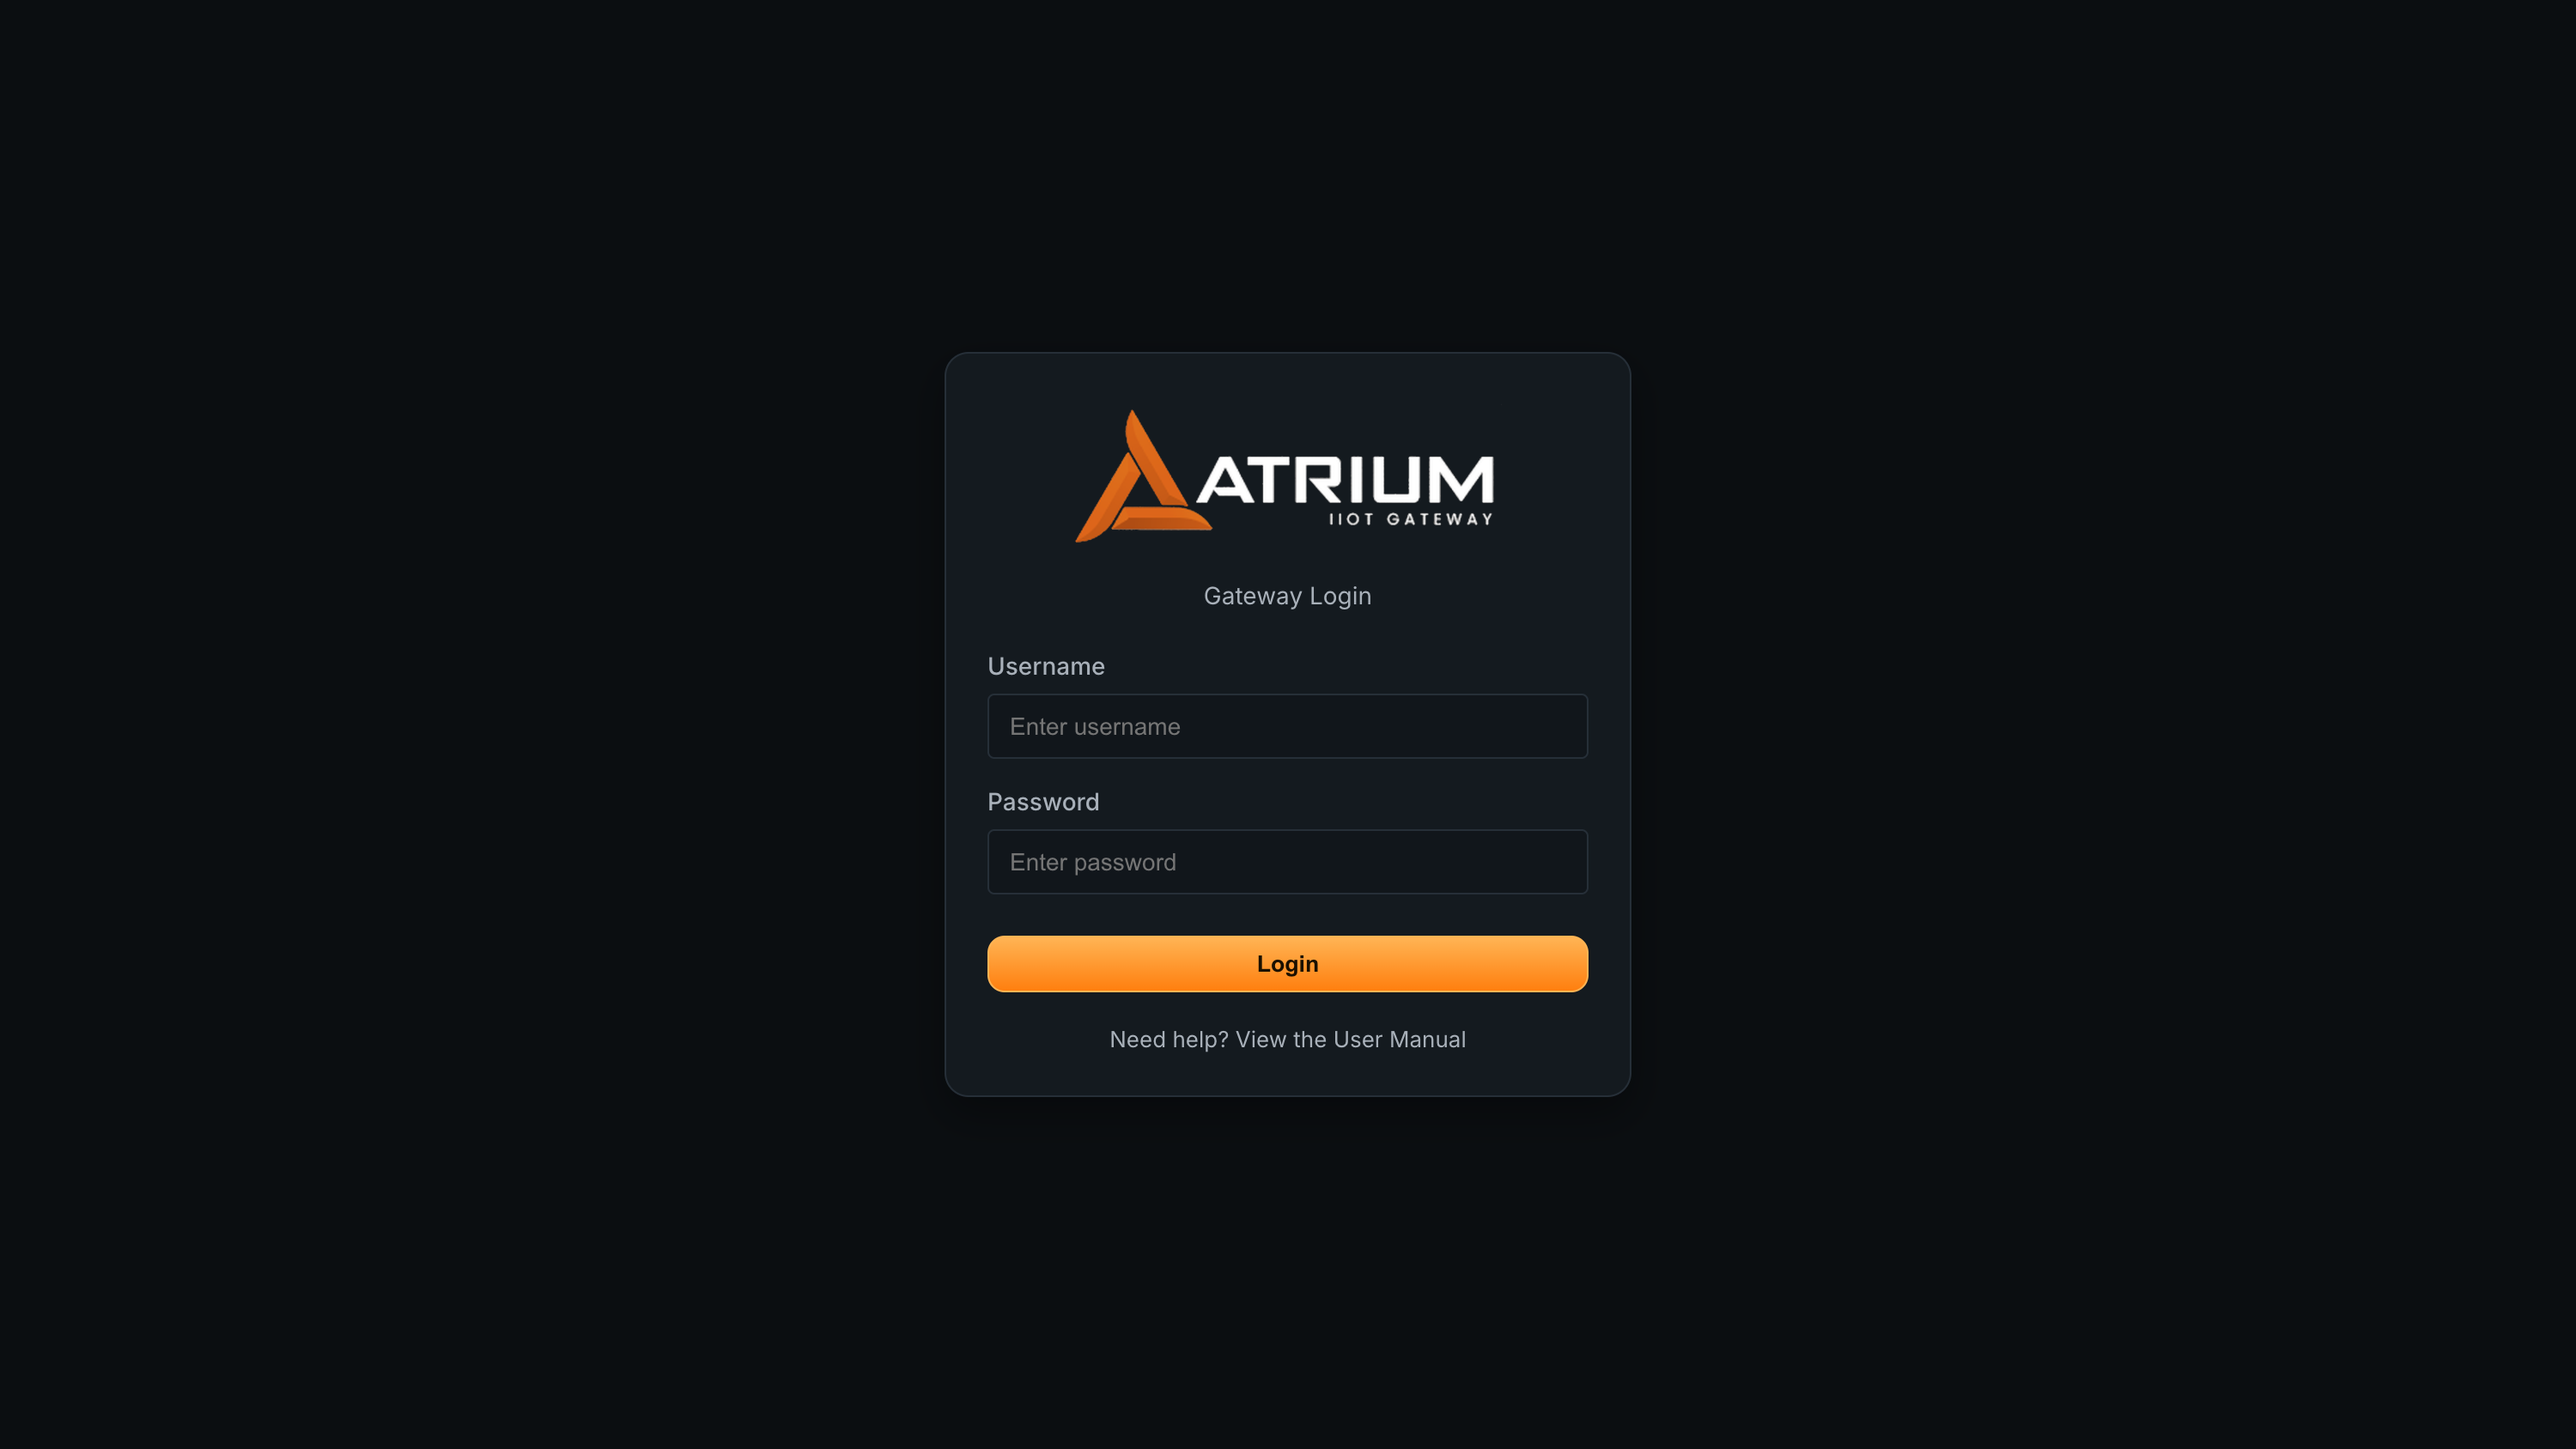
You’ll be presented with a login screen. Sign in with the default credentials shipped with your gateway:
| Field | Default |
|---|---|
| Username | ncdio |
| Password | ncdB3ast |
04First-Time Setup Wizard
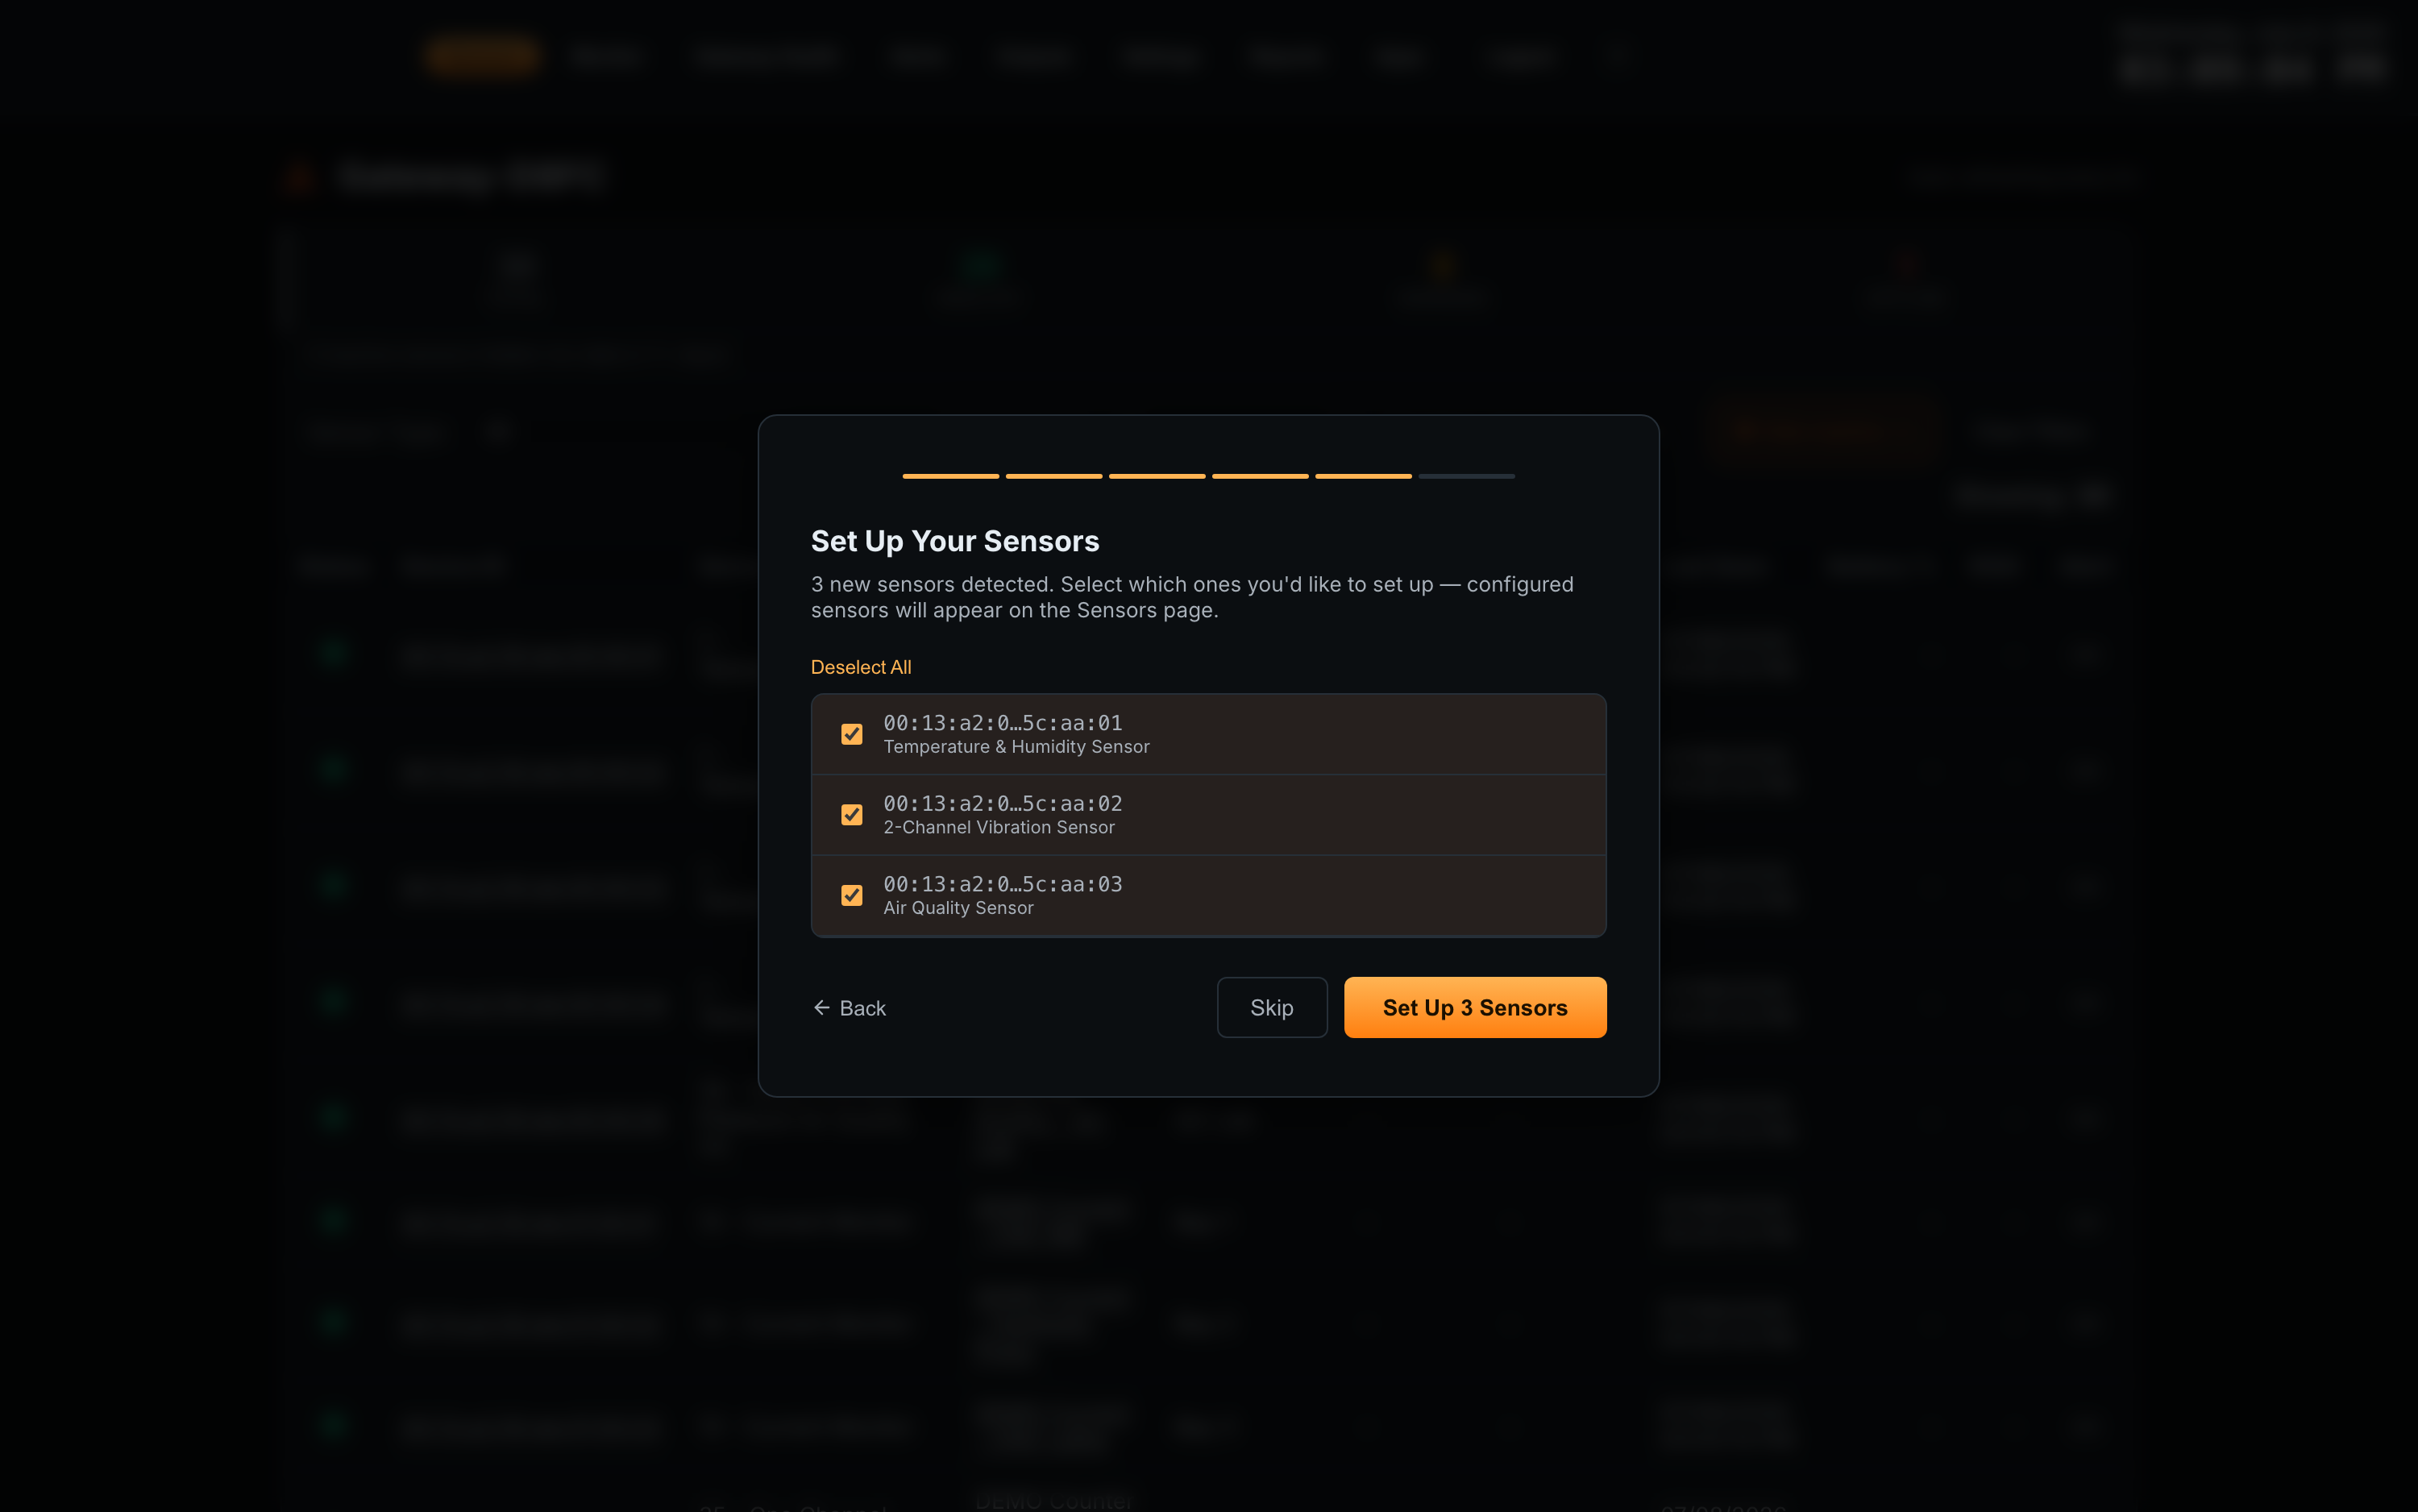
The first time you log in to a new gateway, a guided Setup Wizard walks you through initial configuration in about two minutes. A progress bar tracks six phases: Welcome, Email, Security, Access, Sensors, and Done.
Watch: Atrium Setup — Onboarding Sensors
Every step is optional — you can skip any individual step or the entire wizard, and change everything later from the Settings page. The wizard covers:
The six phases
| Phase | What you configure |
|---|---|
| Welcome | Introduction. Click Get Started, or skip setup entirely. |
| SMTP server, port, username, password, and From address so Atrium can send alerts. A Send Test Email button verifies credentials before saving. | |
| Security | Change the default username and password (new password must be at least 6 characters). You’ll be logged out to sign back in with the new credentials. |
| Access | Optionally enable Remote Access via a secure Cloudflare tunnel. A warning appears if you haven’t changed the default credentials yet. |
| Sensors | Name and describe any detected-but-unconfigured sensors — one at a time — with a friendly name, location, asset, and install date. |
| Done | A summary of what was configured. Click Go to Sensors to enter the main interface. |
05Navigating Atrium
After logging in, a top navigation bar gives you access to every area of Atrium. The gateway name, platform version, and current date/time show at the top of every page.
The navigation bar
| Tab | What it’s for |
|---|---|
| Sensors | The home page — a list of every device with status, filtering, and sorting. |
| Monitor | A customizable, widget-based dashboard for at-a-glance monitoring. |
| Alerts | Alerts & Actions — alert templates, triggers, actions, and action history. |
| Automations | The event bus — wire gateway and app events to actions across installed apps. |
| Settings | Gateway configuration: status, network, proxy, notifications, MQTT, devices, updates, users, and more. |
| Reports | Configure automated reports delivered by email. |
| Apps | Install and manage optional add-on apps from the App Center. |
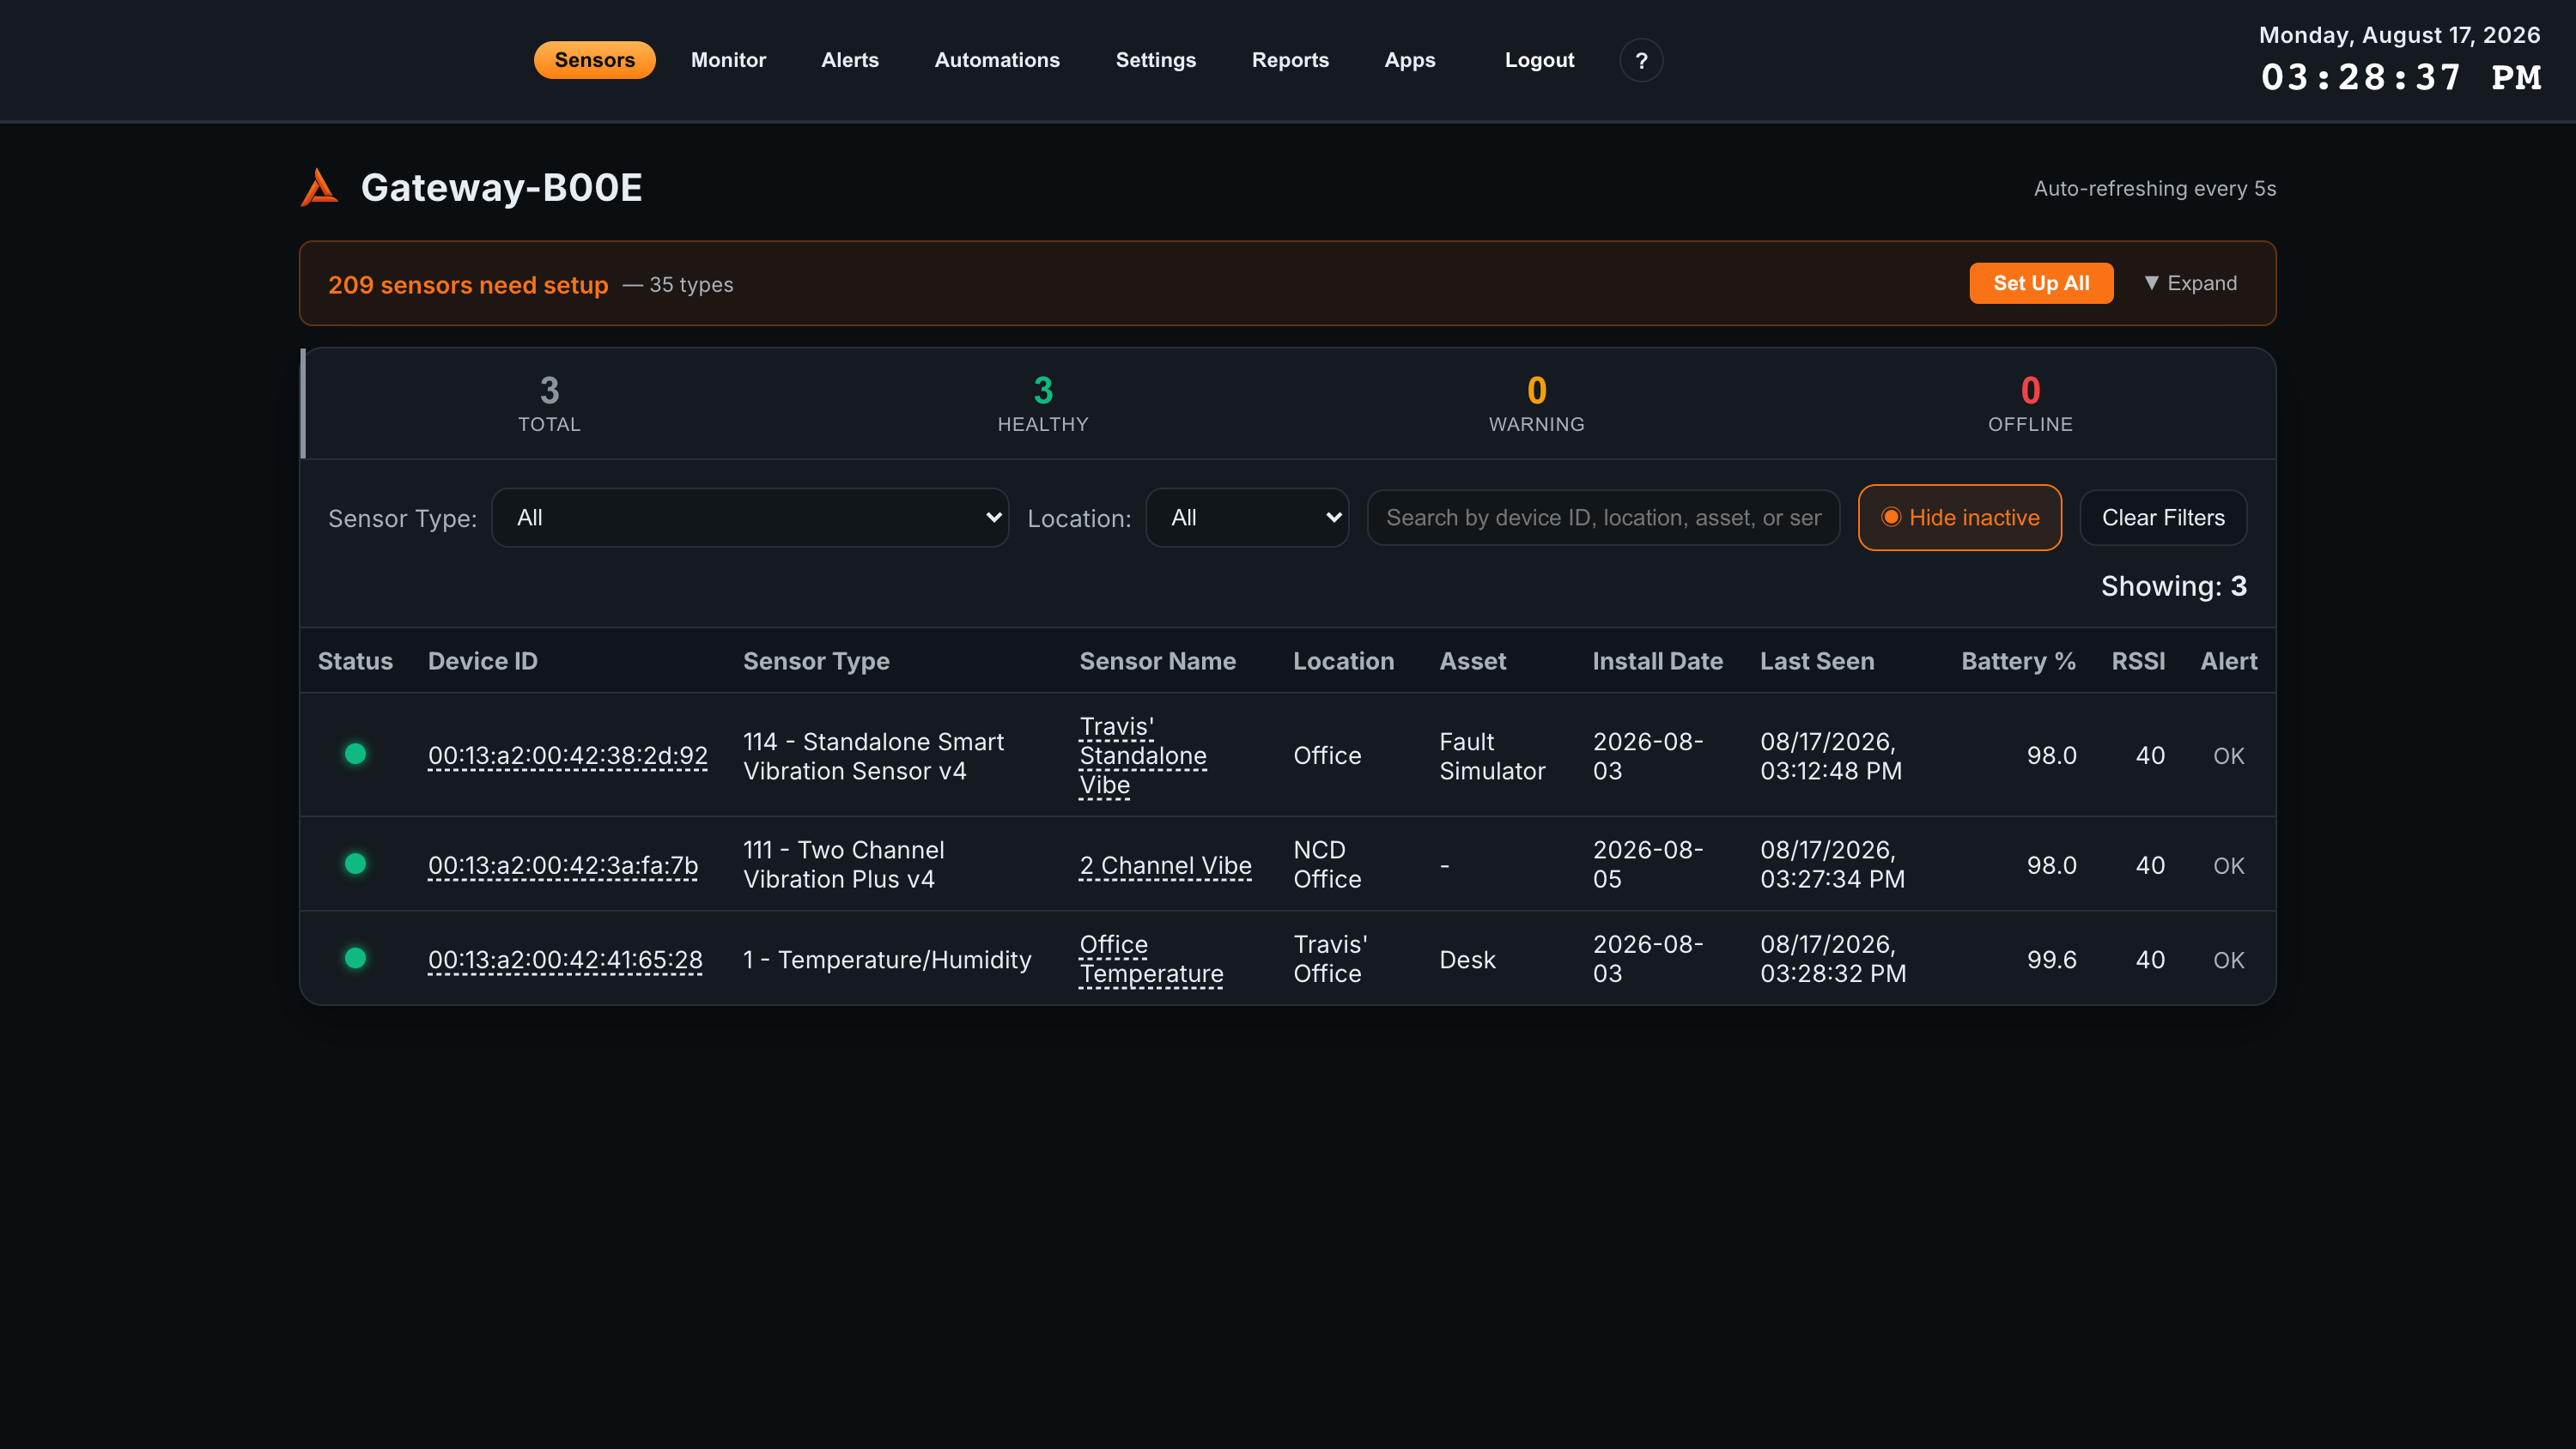
The Sensor List (home page)
The Sensor List shows every device registered with the gateway. At the top, a Fleet Health Summary bar shows a live count of devices in each state — each badge is clickable to filter the list:
- Healthy — communicating normally, no issues
- Warning — a sensor error, low battery, or weak signal
- Offline — the device has stopped reporting
Use the toolbar to filter by sensor type, location, or status, or free-text search across device ID, location, asset, and name. Click any column header to sort. All filter and sort states are saved in the URL, so you can bookmark or share a filtered view — and when you open a sensor and press Back, your view is restored.
06Sensor Dashboards
Click any device in the Sensor List to open its dashboard — detailed, real-time information for a single sensor.
What’s on the dashboard
- Device header — name, device ID (MAC), sensor type, firmware version, location/asset, and a color-coded Last Heard timestamp.
- Status banners — amber warnings (sensor error, low battery, weak signal) or a red offline banner when applicable.
- Status History — a collapsible, chronological log of every health transition, useful for post-incident review.
- Time-series charts — one per metric, with selectable ranges (1h, 6h, 24h, 7d, 30d, or custom). Drag to zoom; drag charts to reorder.
- Thresholds — draw an alert reference line on any chart with a condition, value, and swing (hysteresis).
Vibration sensors add an FFT View for frequency-domain analysis and a one-shot Raw FFT Data capture. Sensors on the wireless mesh network show a Mesh Route Map with hop count and a link to the full network topology.
Configuring a sensor
The Configure link opens a tabbed editor where you set the sensor’s location, asset, friendly name, install date, report interval, and offline-alert preference; customize how each metric is displayed (formula, unit, label, visibility); and adjust sensor-specific parameters.
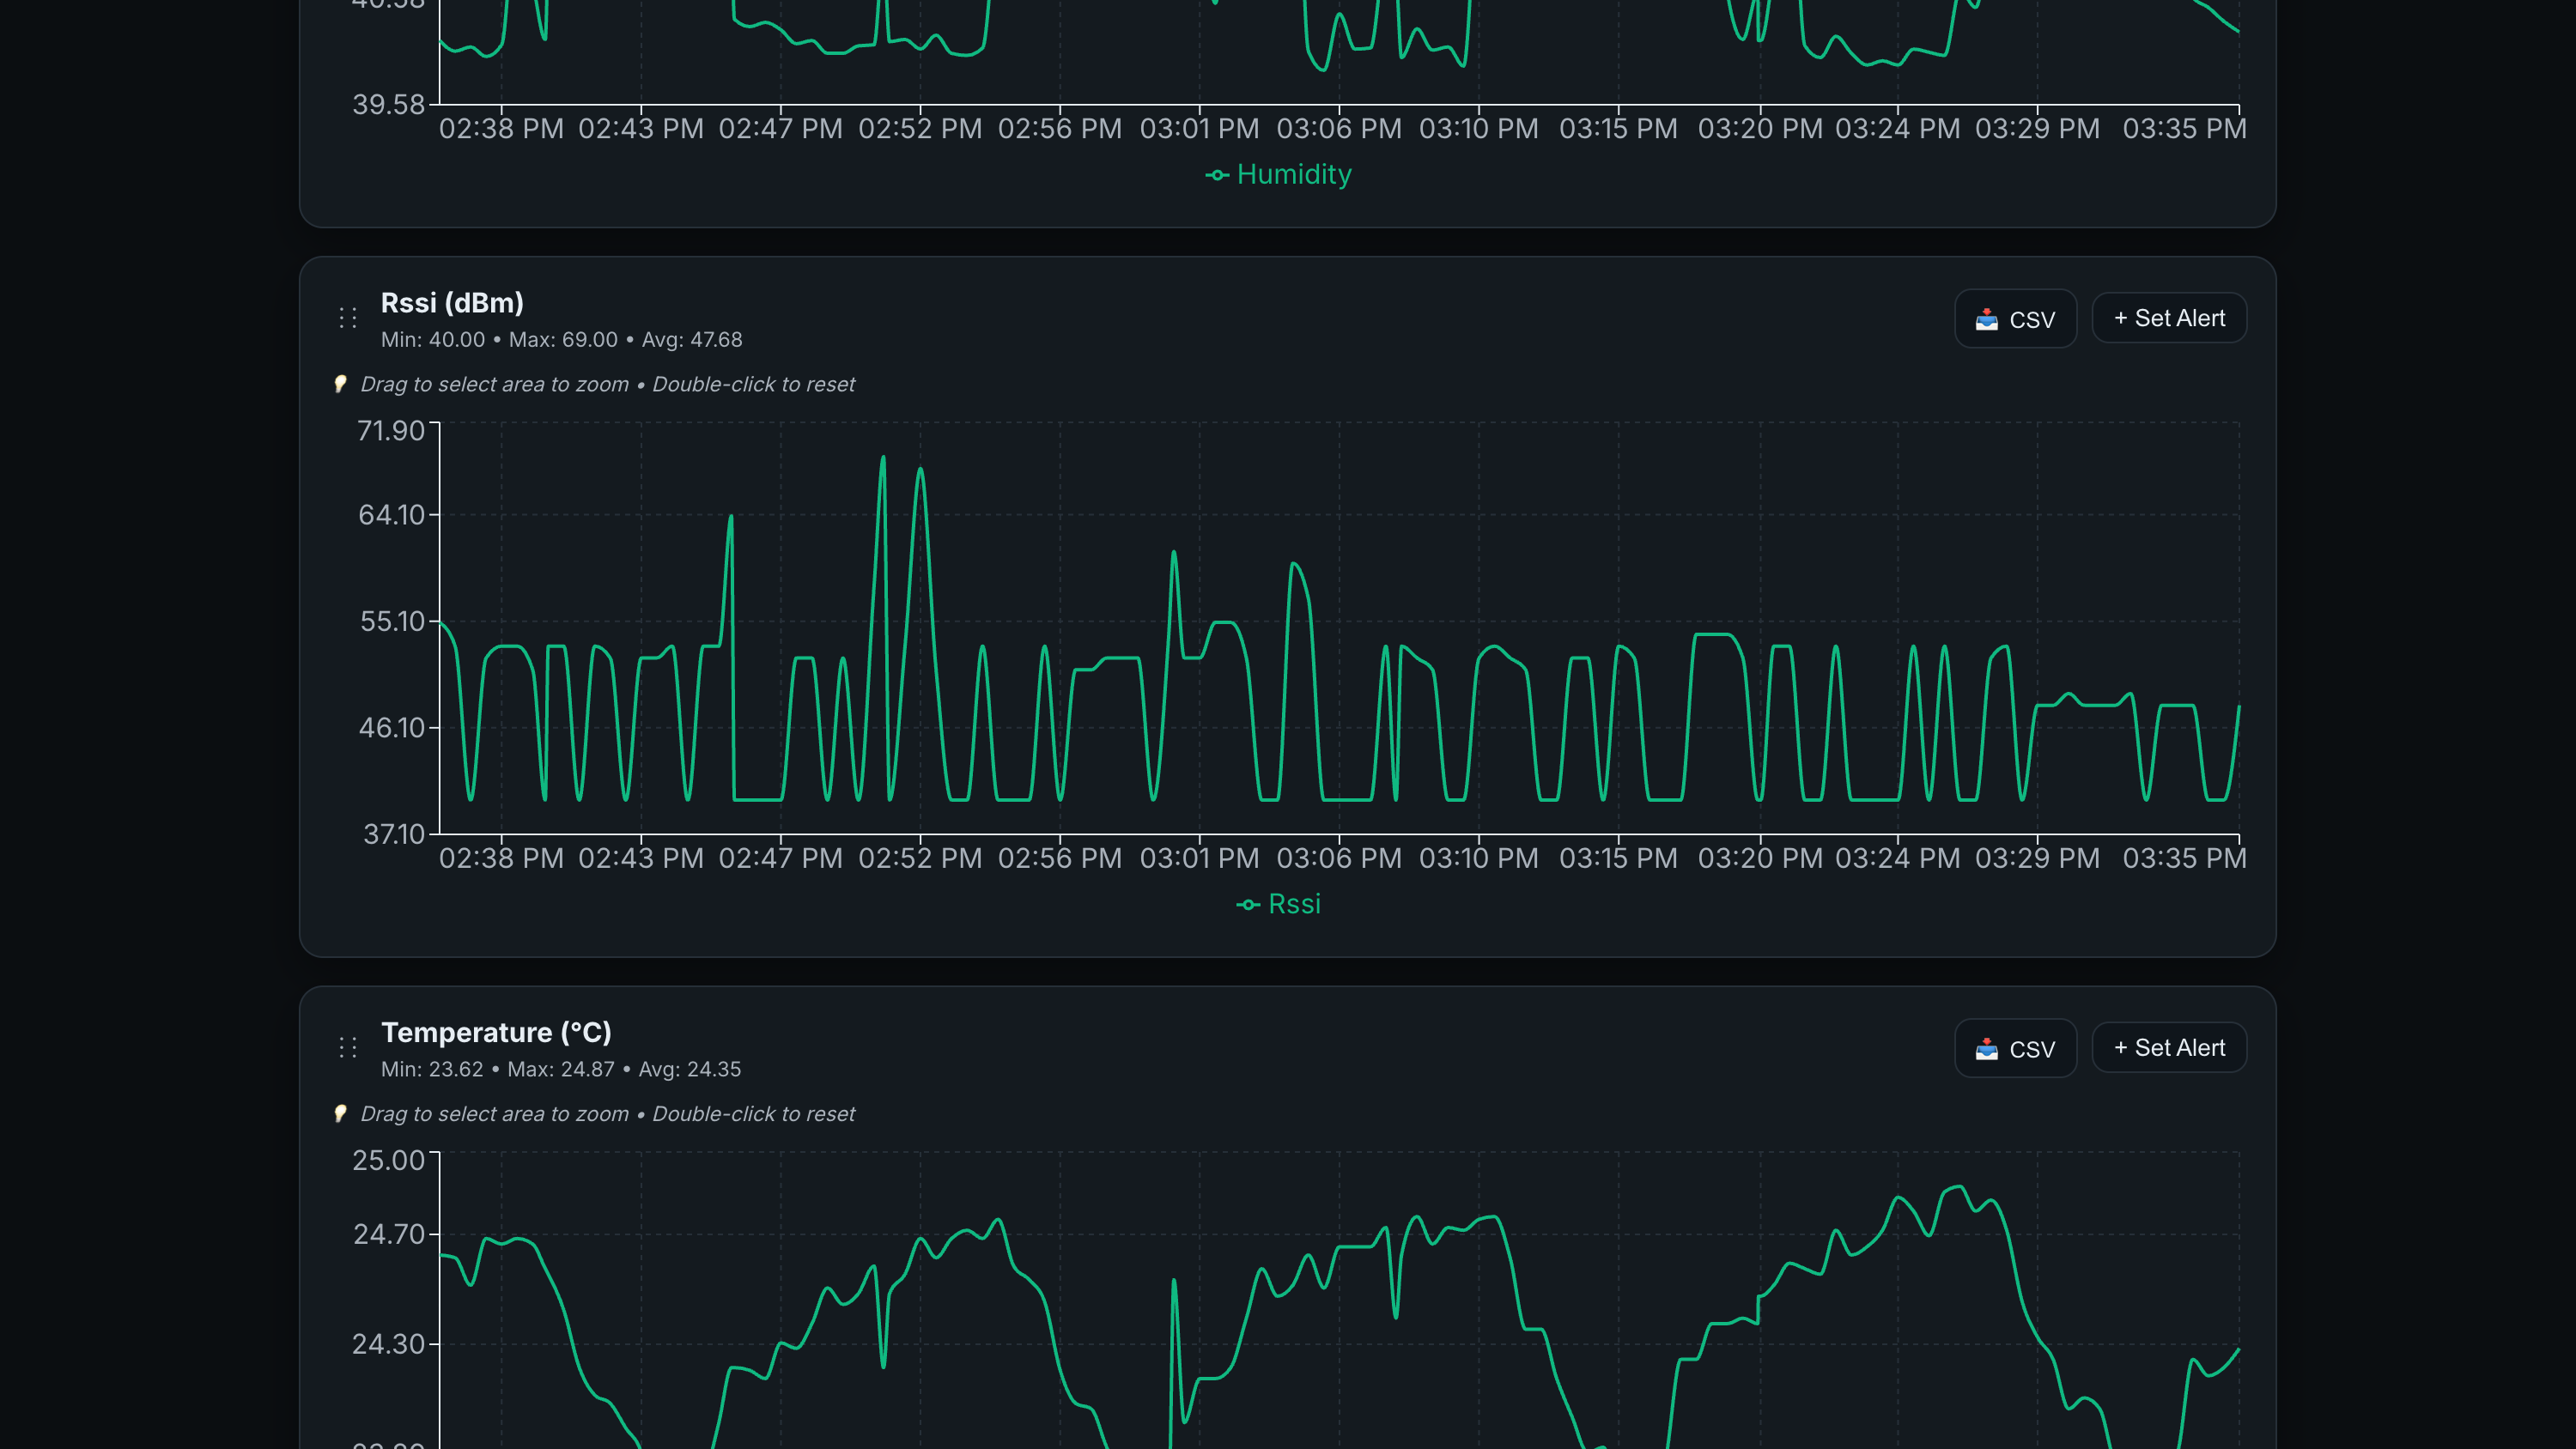
Interactive Preview
The panel below simulates the Atrium Sensor Dashboard for this Vibration / Temperature sensor. Data updates every 5 seconds to demonstrate the live monitoring experience.
07Custom Dashboards (Monitor)
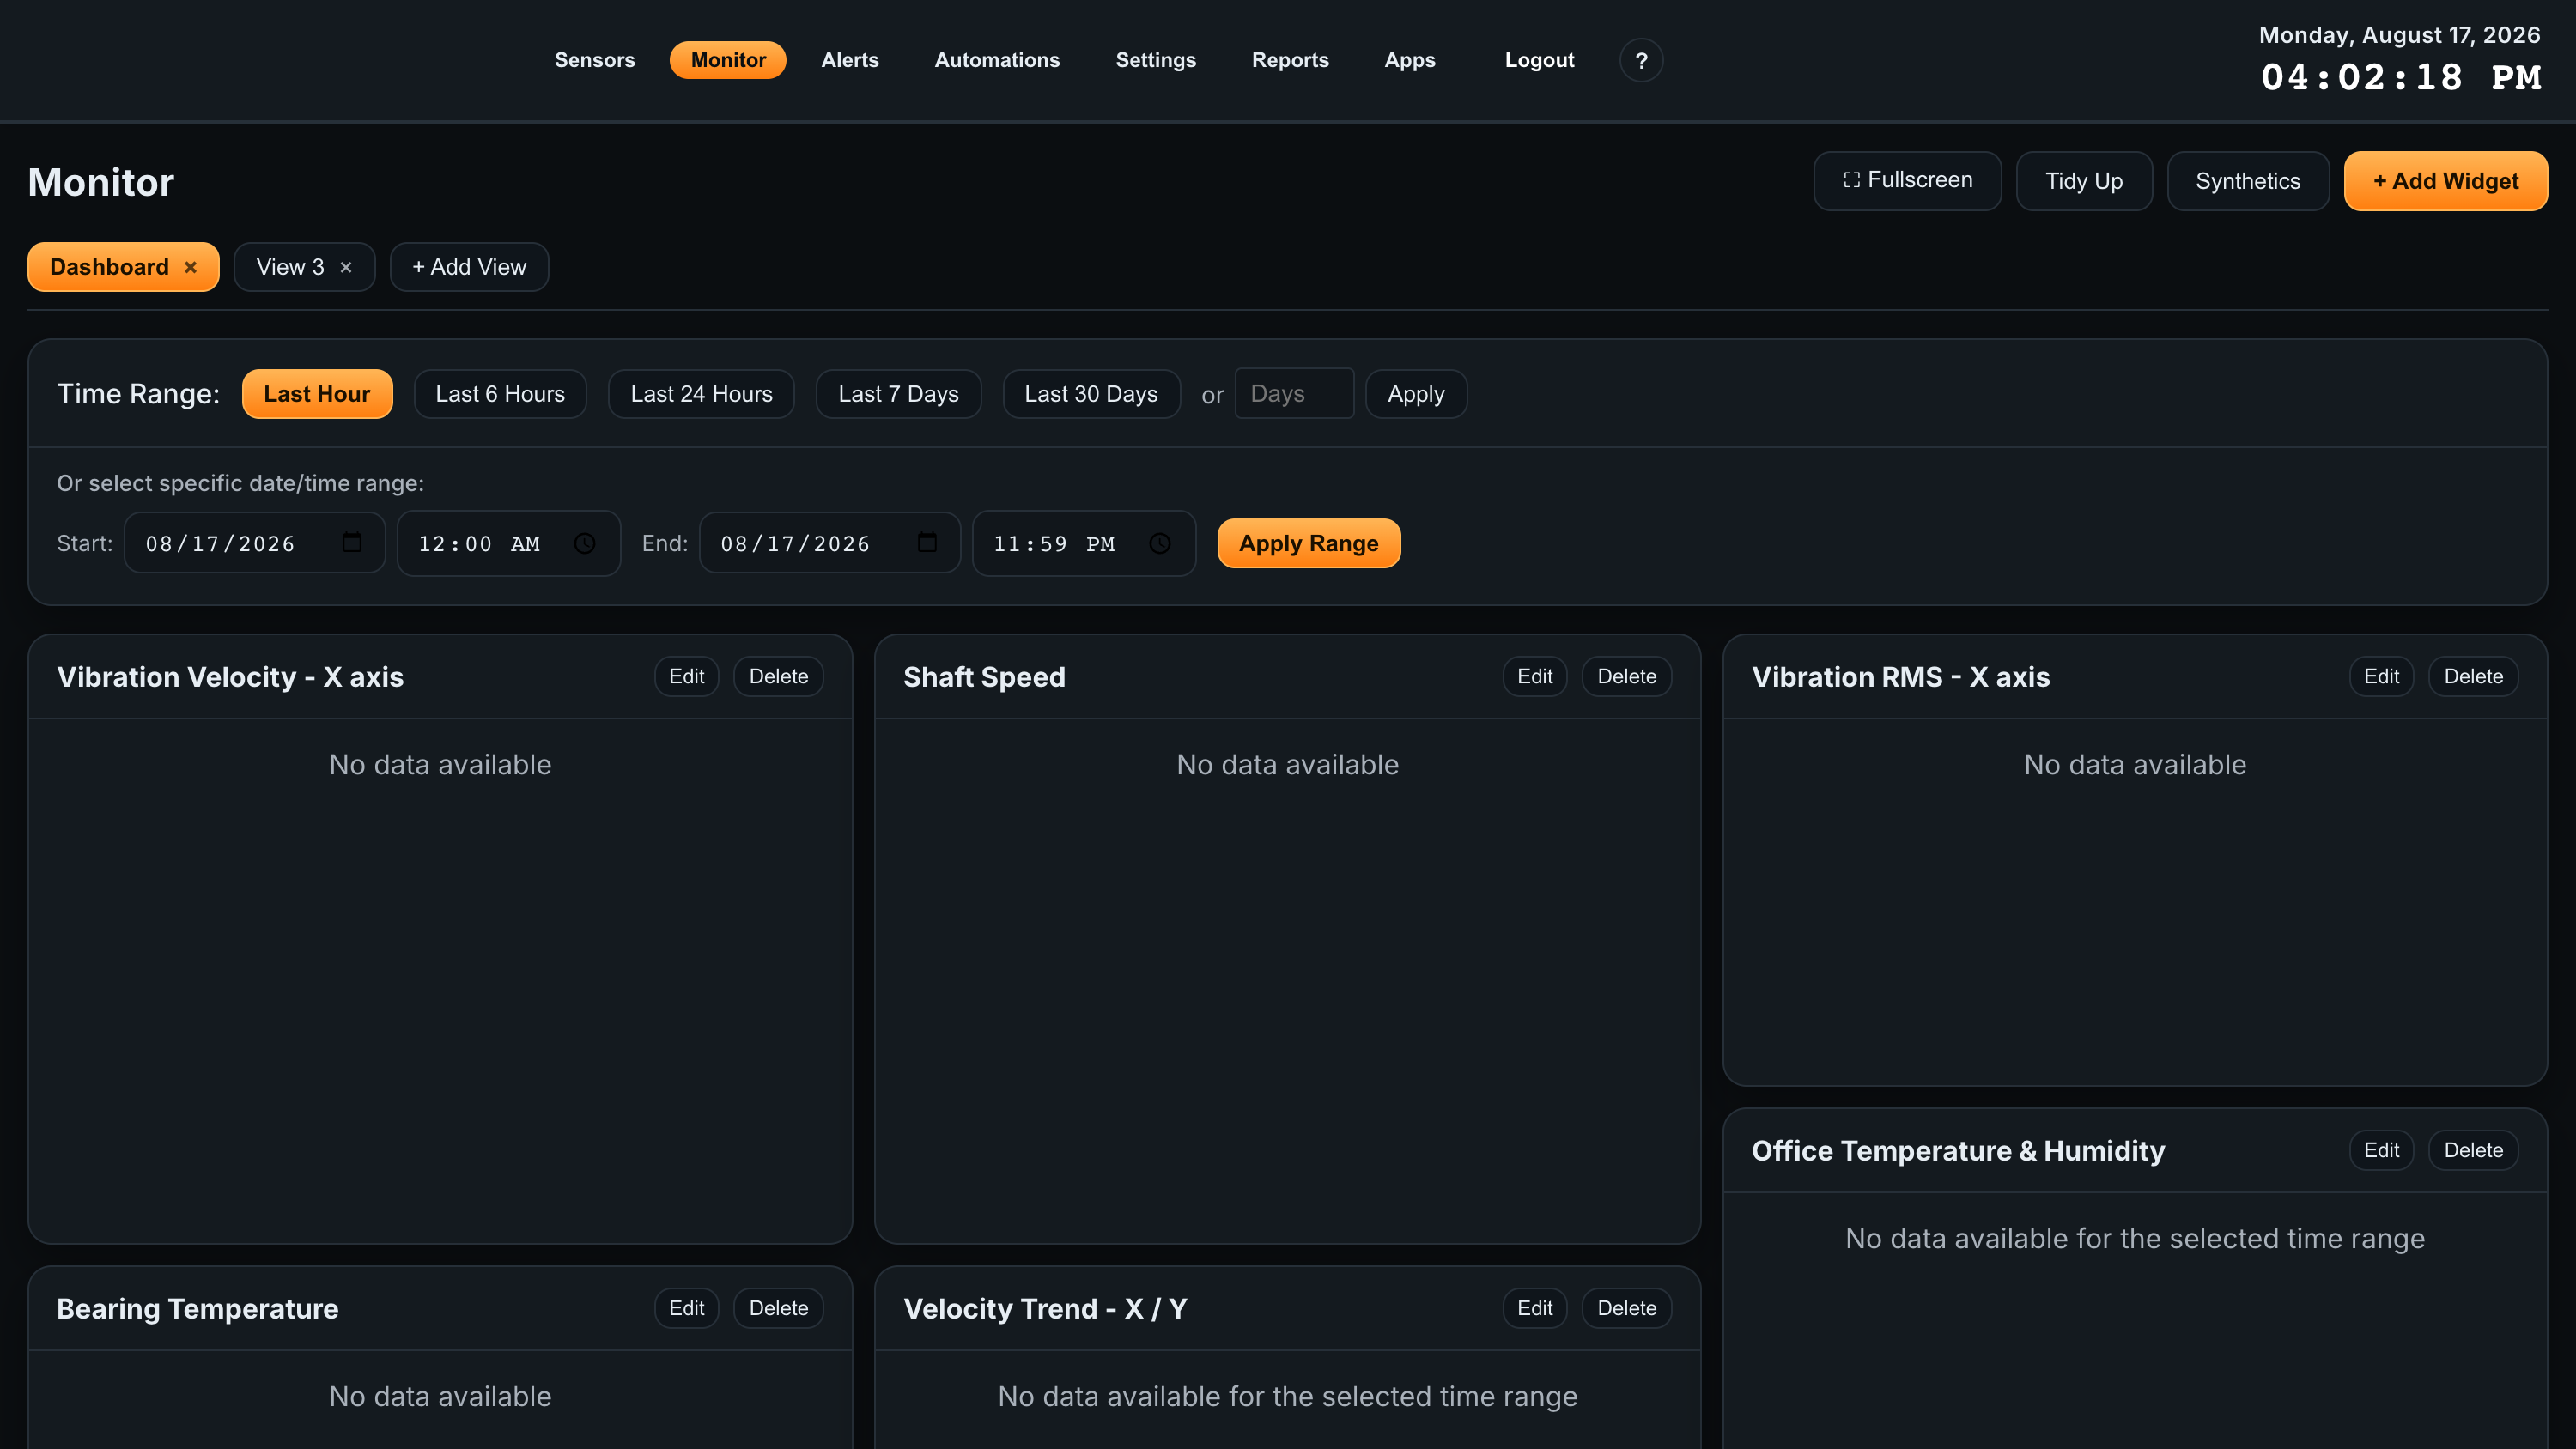
The Monitor page is a customizable, widget-based view for watching multiple sensors at a glance — ideal for a wall-mounted display or a dedicated monitoring station.
Views
A Monitor page can hold several views, shown as tabs above the dashboard. Each view is its own independent set of widgets and its own layout, so you can keep a production display on one and diagnostics on another rather than crowding everything together.
- + Add View creates another view and switches to it.
- Click a view’s tab to switch to it; the widgets and layout are remembered per view.
- The × on a tab deletes that view and the widgets on it.
Widgets
Click + Add Widget, choose a type, then add one or more sensor metrics with the Add Metric wizard. Available widgets include Line / Area / Bar charts, Gauge, Tank Level, Stat Card, Sparkline, Metric Card, and Table.
- Thresholds — Metric Card, Gauge, and Tank Level widgets support color-coded value bands. Use Auto-fill Zones to generate red/orange/green ranges.
- 4-20 mA scaling — for analog inputs, a built-in workflow maps 4 mA and 20 mA to real-world units (feet, PSI, gallons, and more).
- Synthetic Variables — computed metrics that combine readings from one or more sensors using a formula, available to any widget.
Drag widgets to rearrange them, resize by the corner handle, and click Tidy Up to auto-arrange. Layouts save automatically. A global time range panel controls chart-based widgets, and a Fullscreen button expands the page for shop-floor displays.
08Alerts
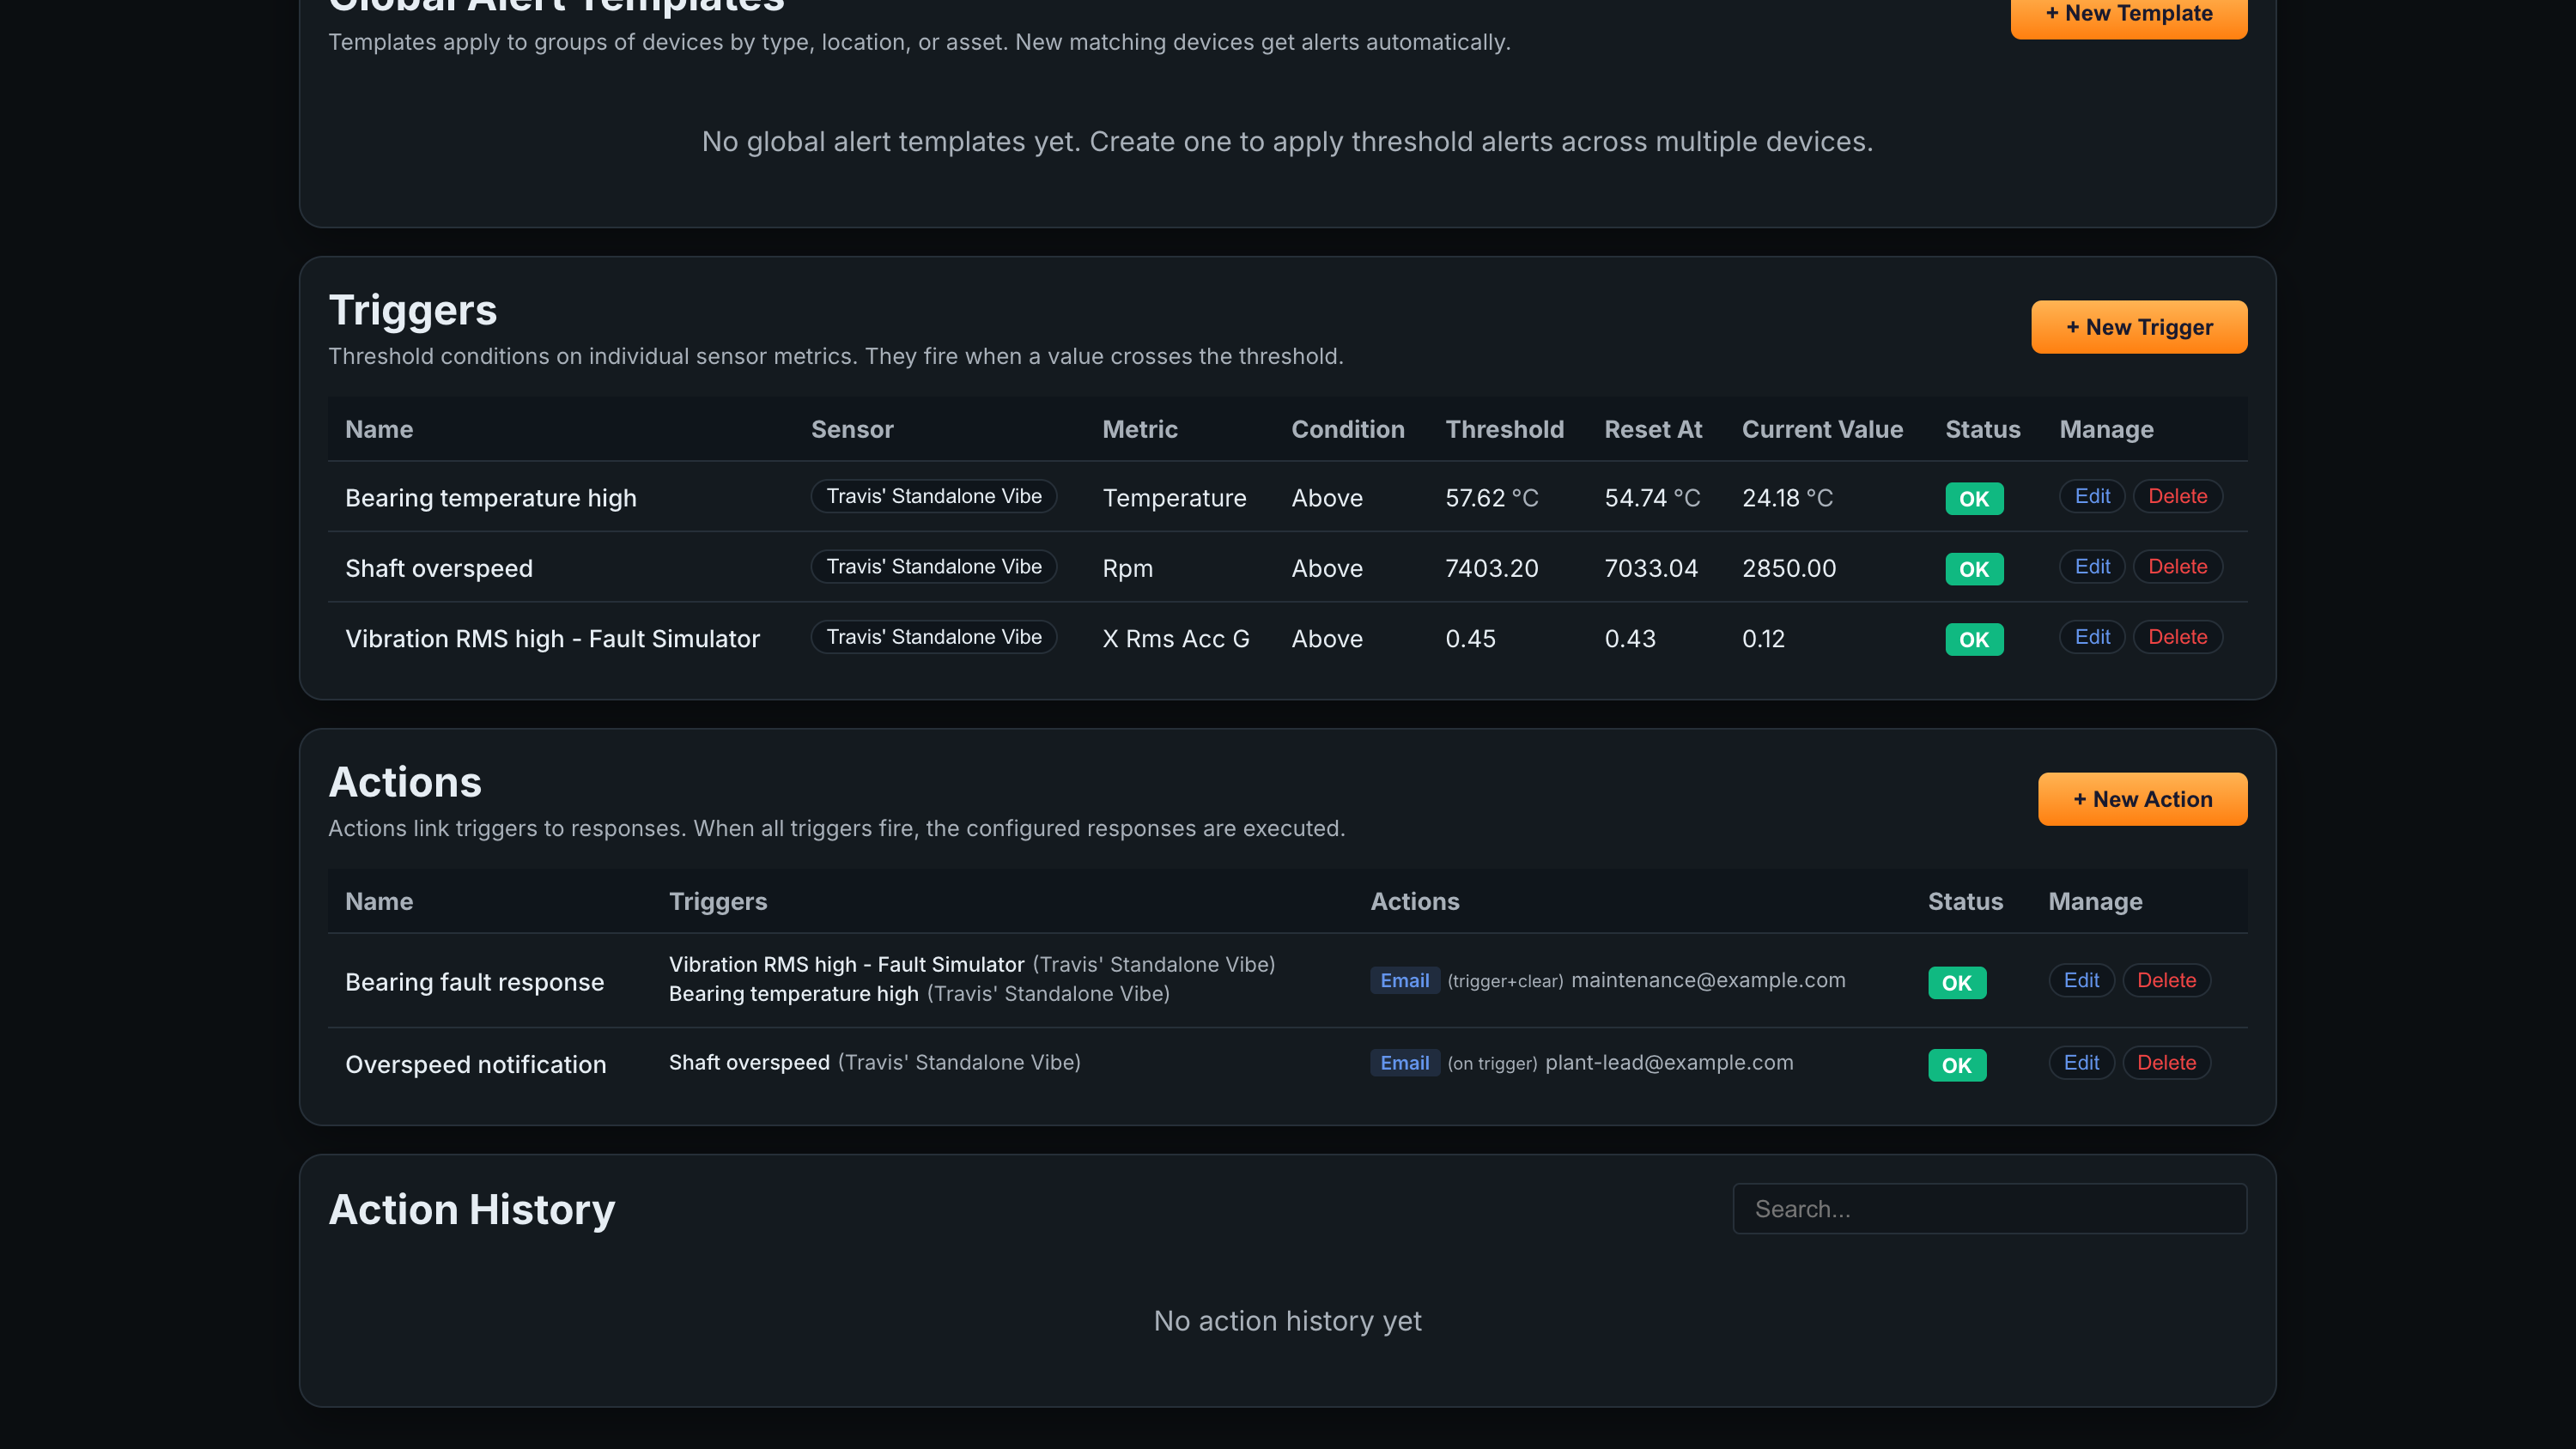
Turn readings into notification. The Alerts tab opens Alerts & Actions, where you define the conditions worth knowing about and what should happen when they are met.
It has four parts:
- Global Alert Templates — threshold rules that auto-apply to groups of devices (all devices, a sensor type, a location, or an asset). New matching devices inherit the alert automatically.
- Triggers — a single threshold condition on one device’s metric, with a condition (above/below), a value, and a reset point (hysteresis). Each row shows the current value and an OK / ACTIVE status.
- Actions — link one or more triggers to one or more responses. When all of an action’s triggers fire, its responses are executed.
- Action History — a searchable log of past action events.
An action’s responses send an email to one or more recipients, firing on trigger, on clear, or both.
09Automations
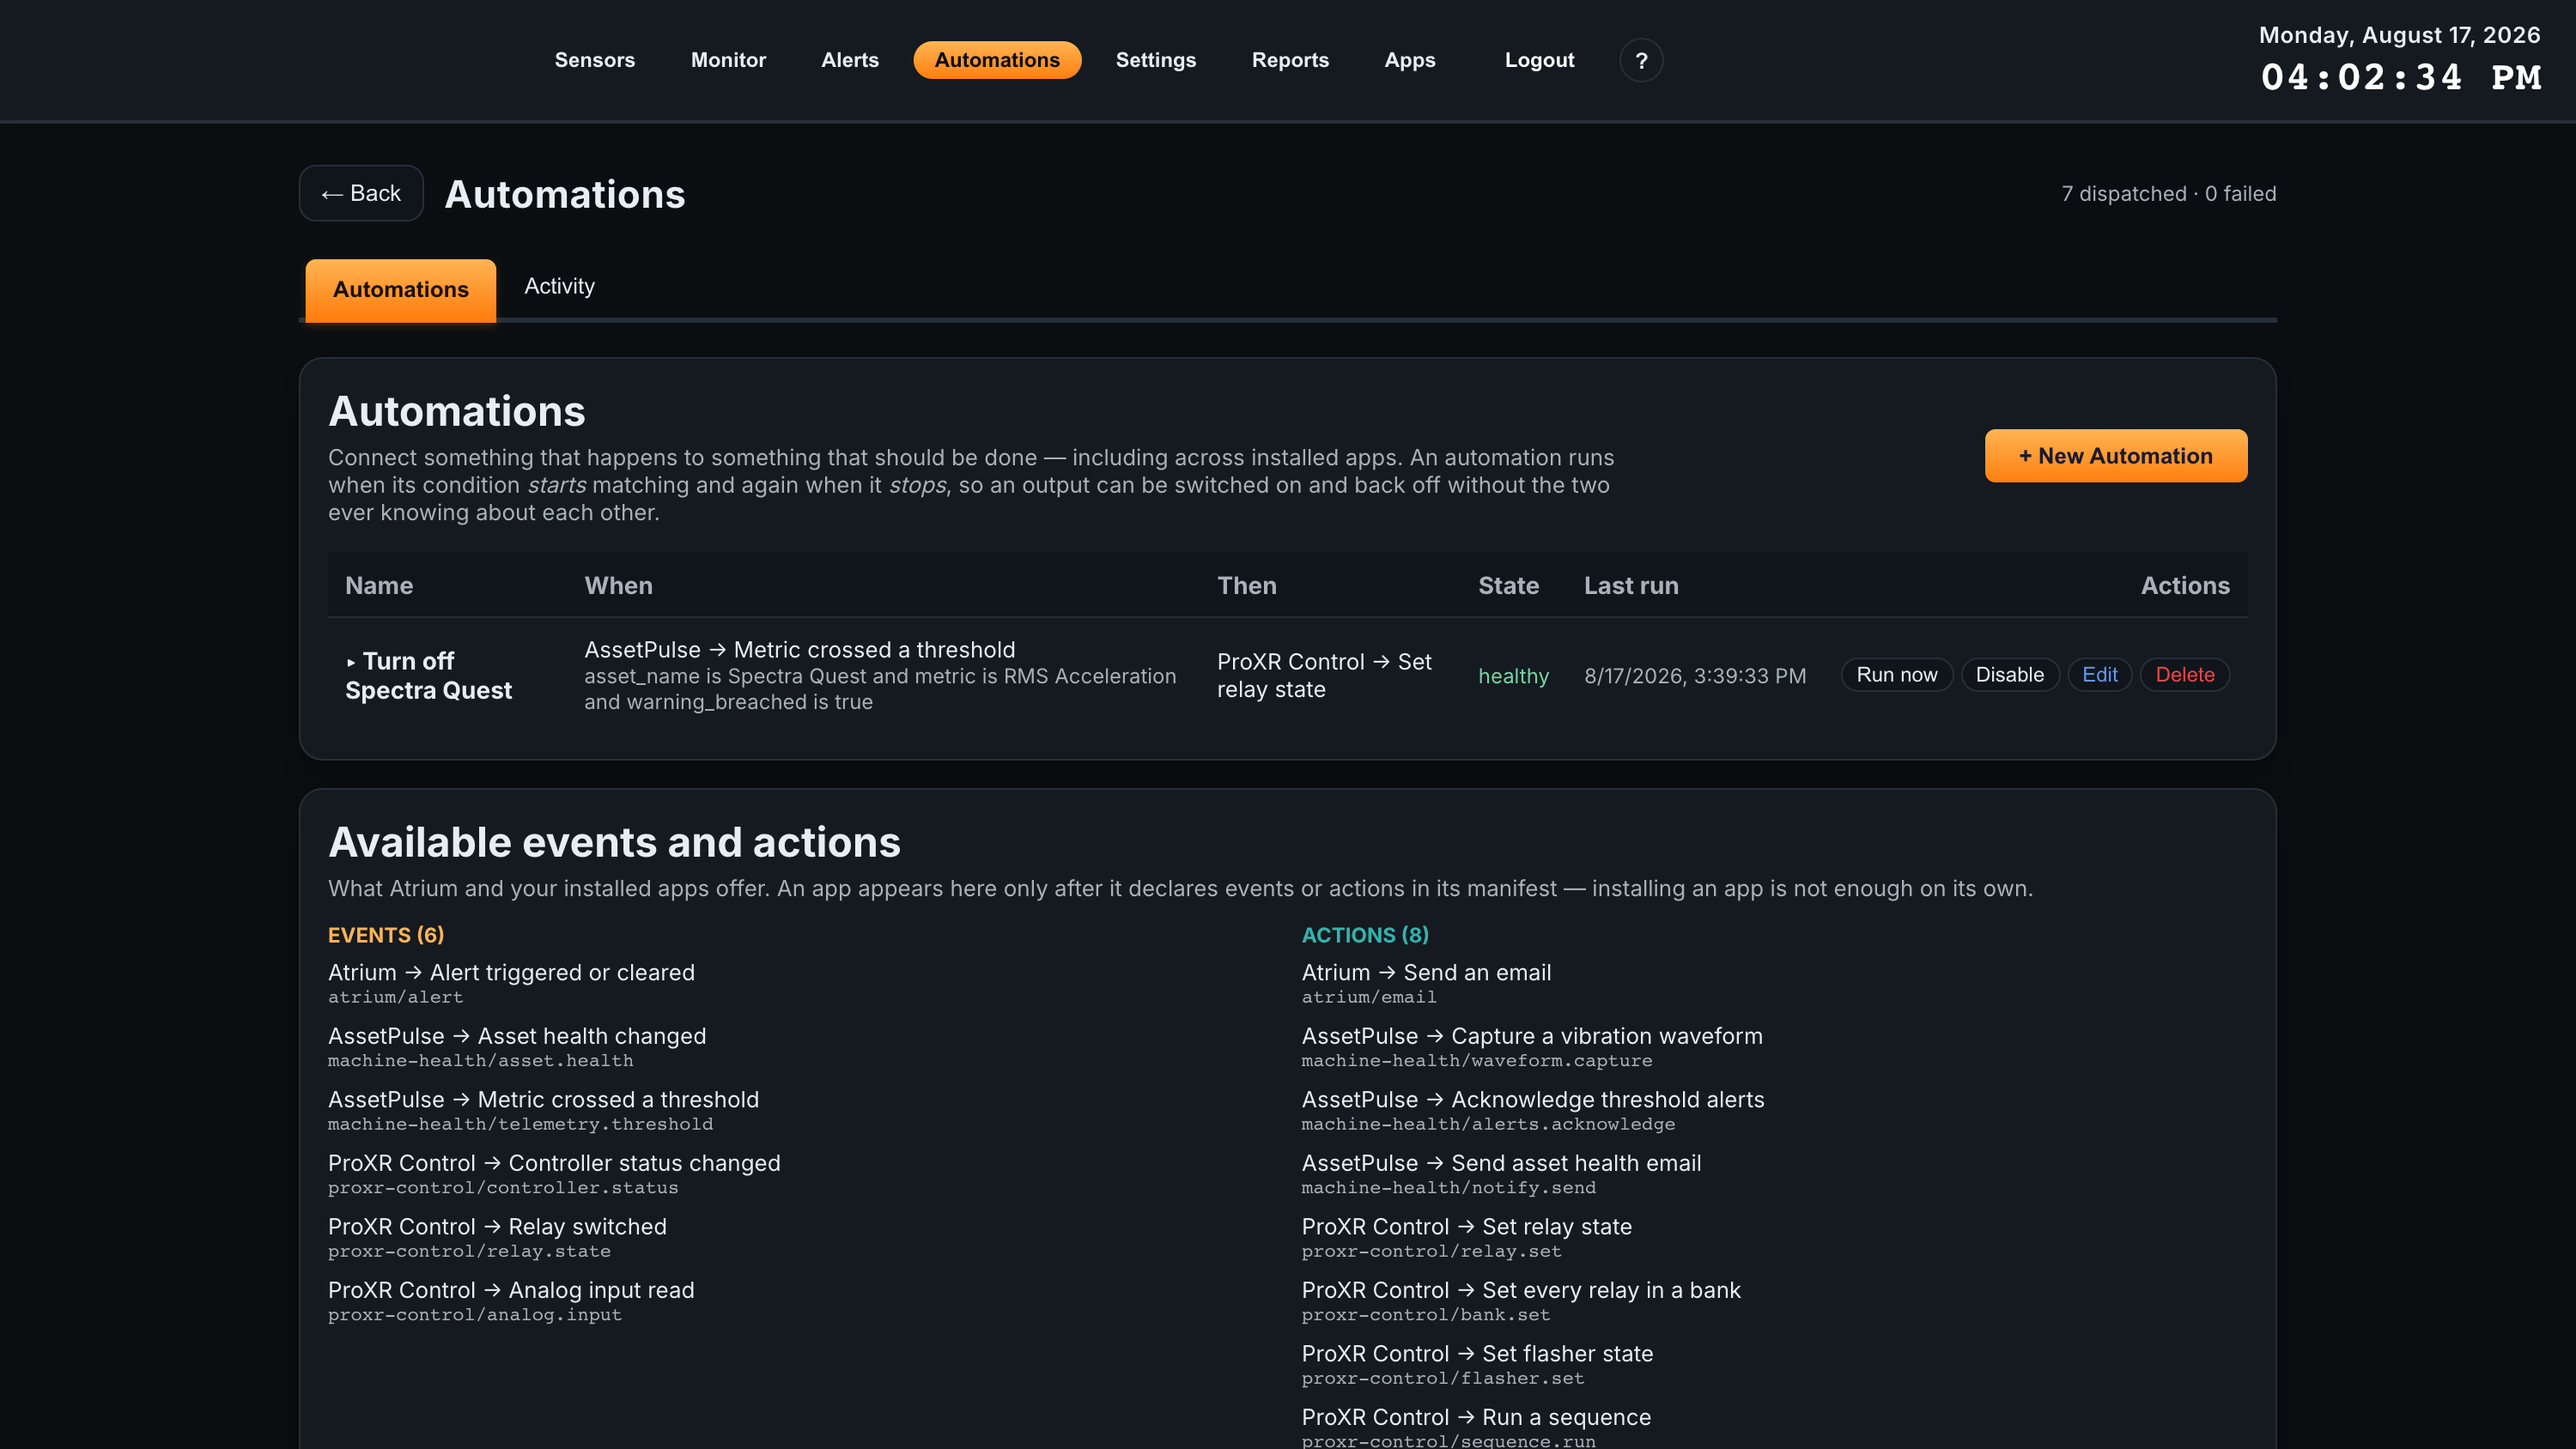
The Automations tab is a gateway-wide event bus: it connects something that happens to something that should be done, including across installed apps.
Each automation is a When (an event) paired with a Then (an action), and shows its state, last run, and controls to run, disable, edit, or delete it. An automation runs when its condition starts matching and again when it stops, so an output can be switched on and back off without either side knowing about the other.
An Available events and actions panel lists everything the gateway and your installed apps offer — for example AssetPulse: metric crossed a threshold as an event, and ProXR Control: set relay state as an action.
Alongside sending an email or driving an installed app’s action, an automation can call a webhook — a signed message to a URL you choose. That is how a gateway event reaches software outside it: a chat channel, a ticketing system, or an agent that should wake up and take a look. Deliveries are signed with a secret unique to your gateway, so the receiver can confirm the message really came from you.
10Scheduled Reports
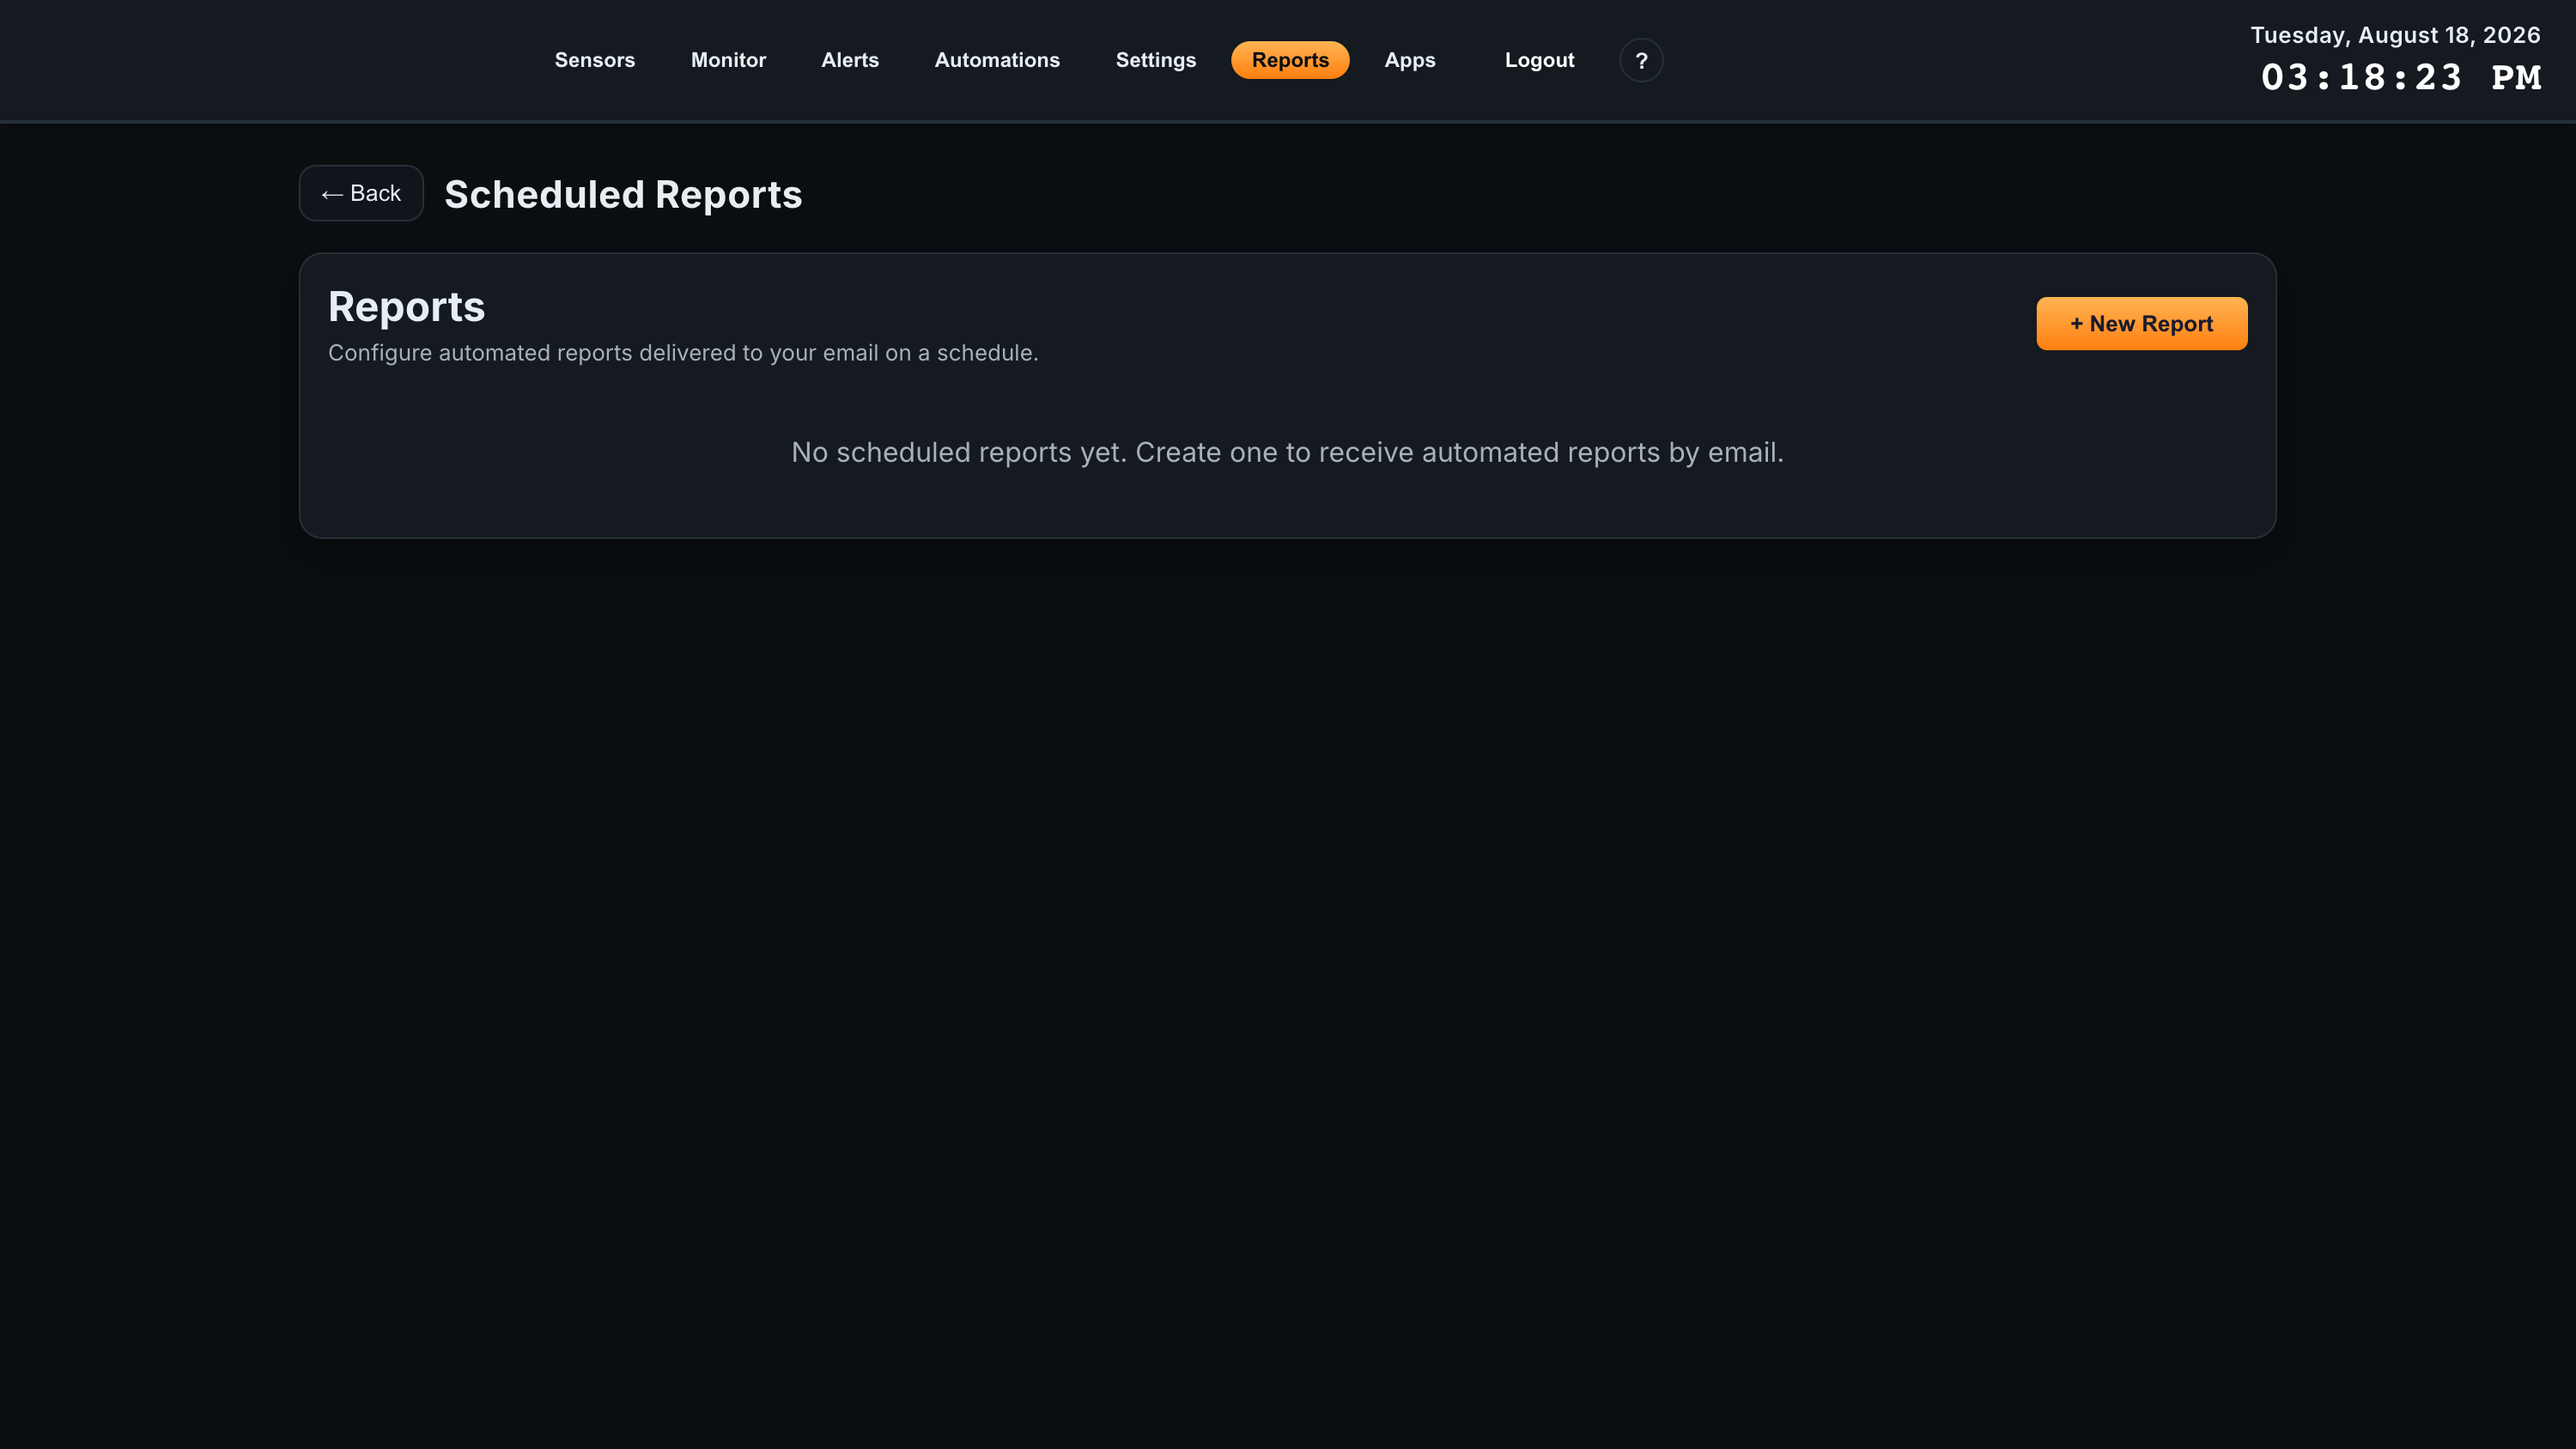
The Reports tab generates recurring reports and emails them out, so a summary lands in someone’s inbox without anyone opening the dashboard.
Reports run daily, weekly, or monthly and are delivered as PDF, CSV, or both. Use Send Now to deliver one immediately, which is the quickest way to check a report looks right before leaving it on a schedule.
Report types
| Type | What it covers |
|---|---|
| Fleet Summary | Every device on the gateway, with status. |
| Sensor Group | A chosen subset of sensors. |
| Alert Digest | Alert activity over the reporting period. |
| Productivity Summary | Machine runtime against quotas. Requires the Productivity Monitor app. |
| OEE Summary | Overall Equipment Effectiveness. Requires the OEE app. |
| Custom SQL | The results of a query you supply — for anything the standard types do not cover. |
11Apps
Apps are optional add-ons that build specialized tools on top of your sensor data. You install only the ones you need, so each gateway runs its own set. Manage them from the Apps tab.
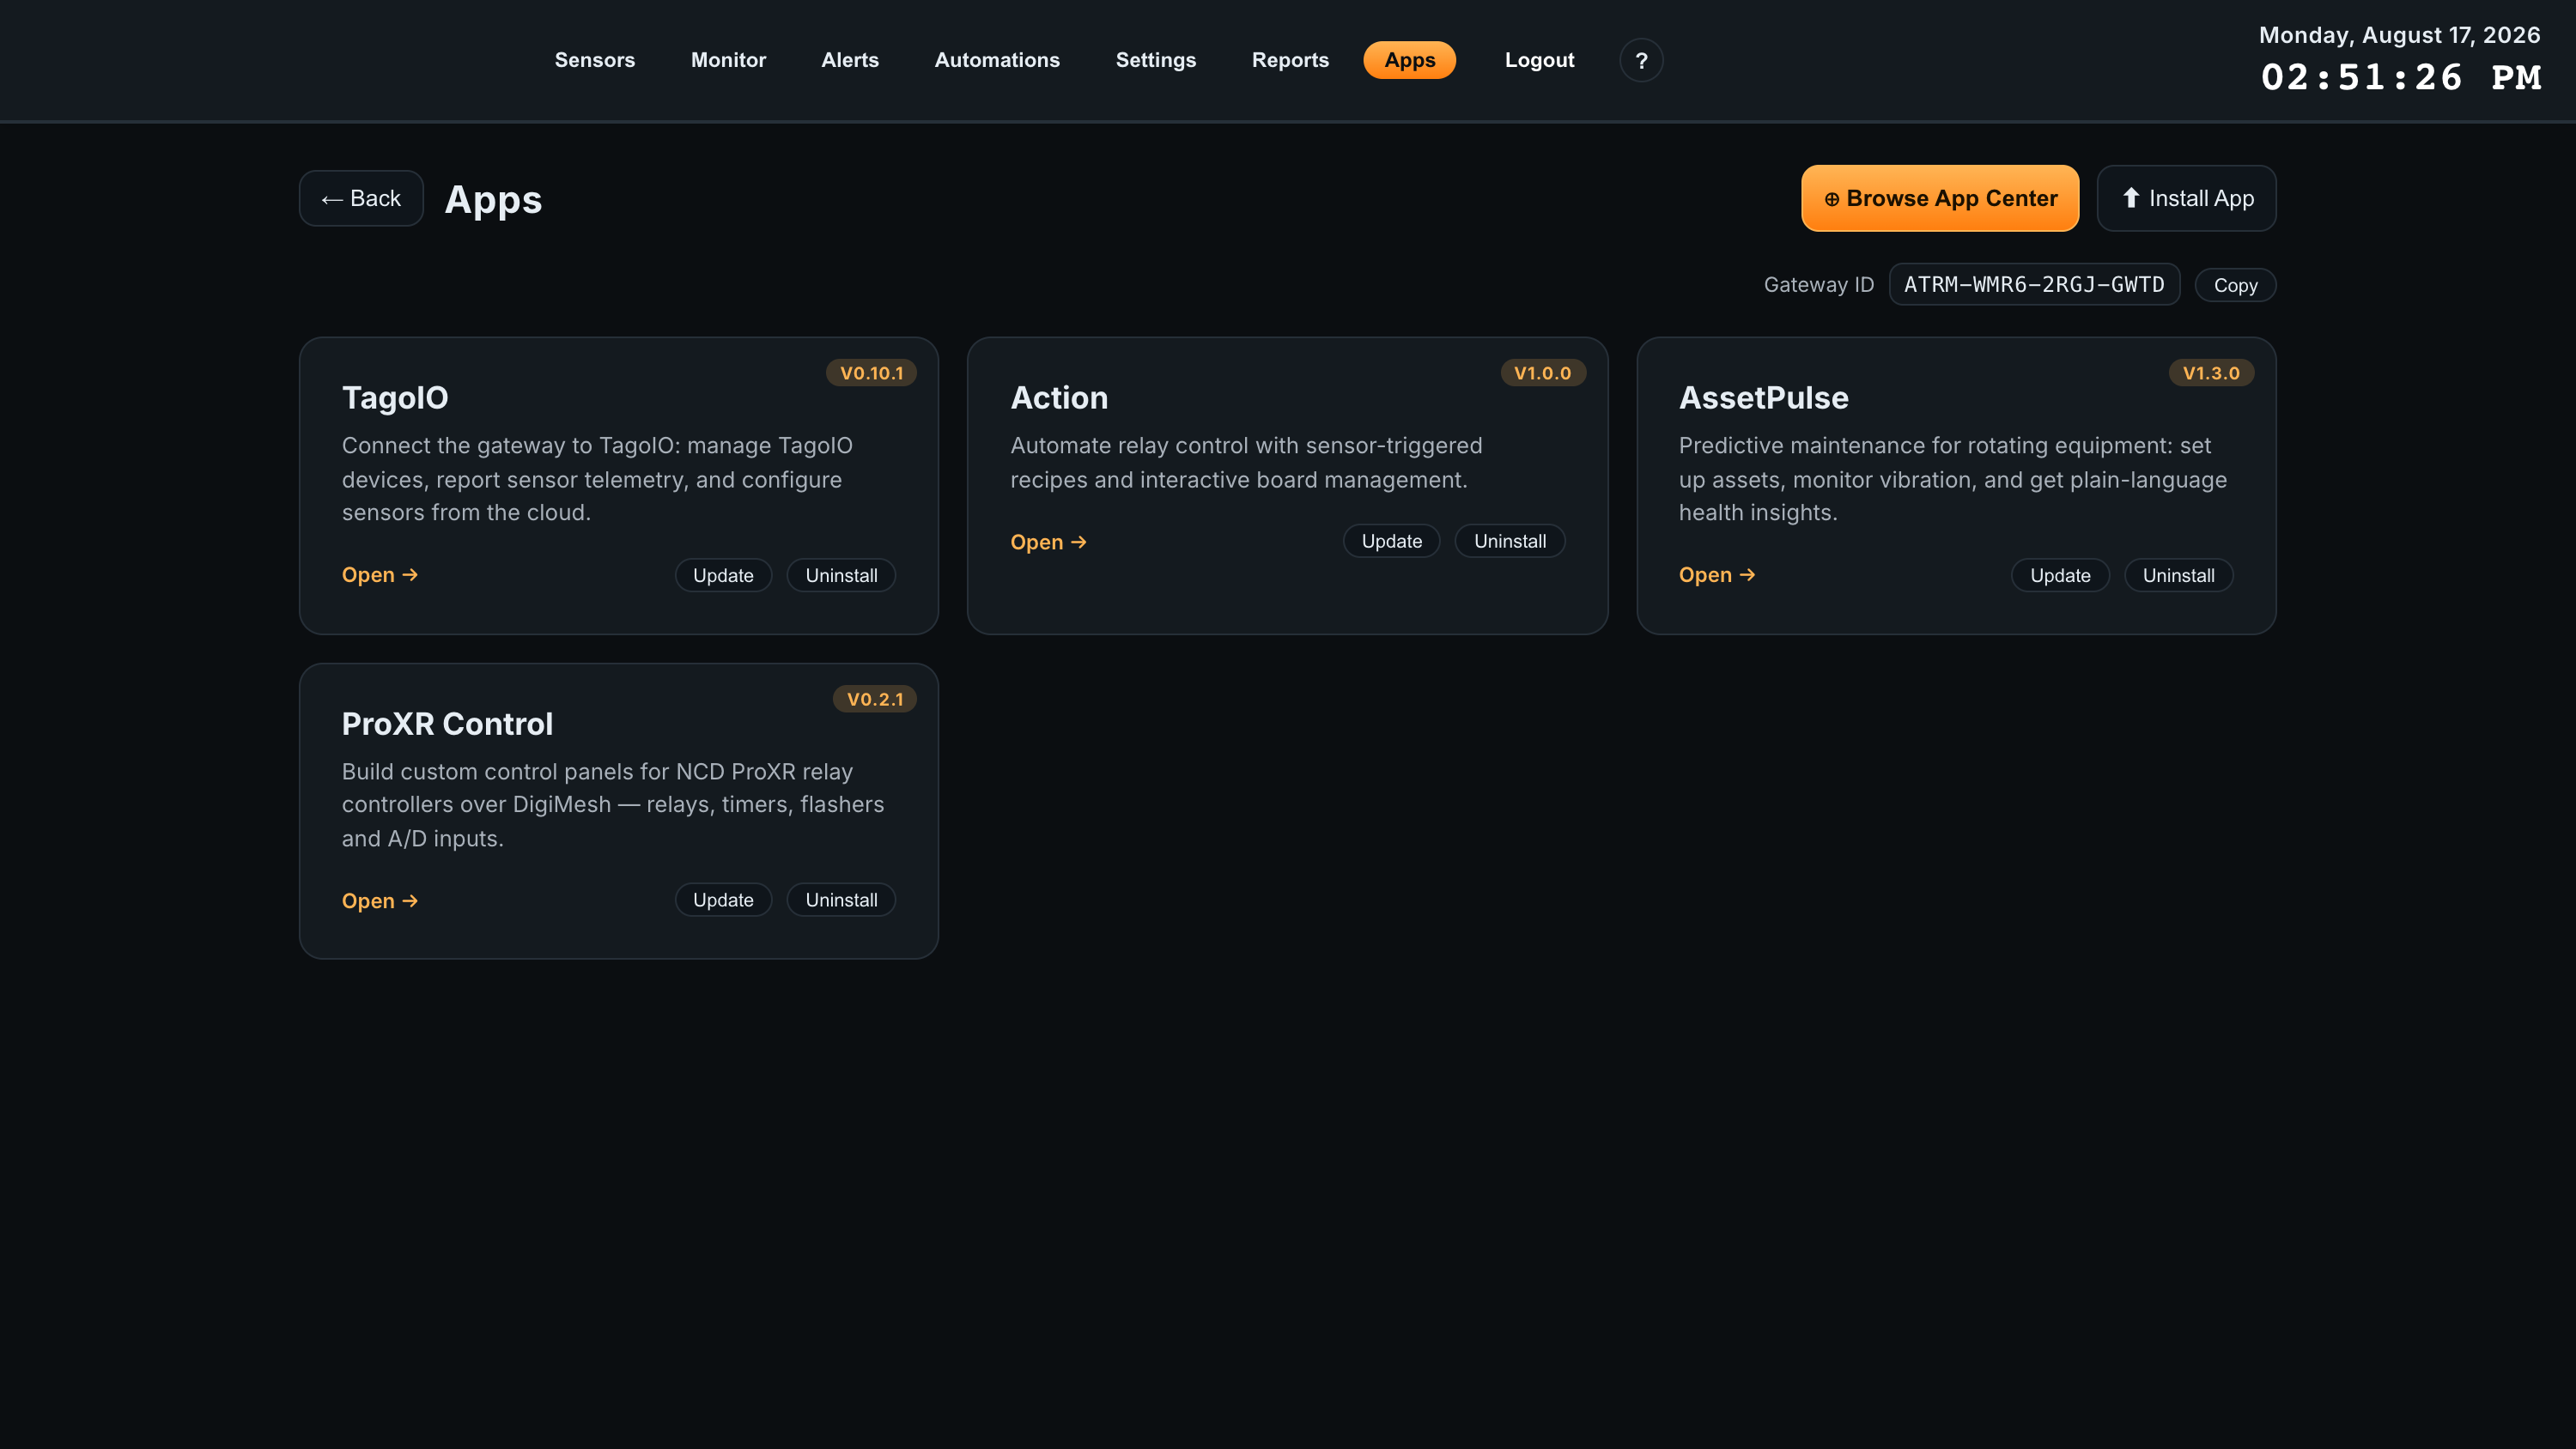
Every installed app appears as a card showing its version, with Open to launch it, Update when a newer version exists, and Uninstall to remove it. Above the cards, Gateway ID uniquely identifies this unit — copy it when requesting a license for a paid app.
Installing from the App Center
Click Browse App Center to see everything available for this gateway. Apps already installed carry an INSTALLED badge; apps that need a license carry a PAID badge.
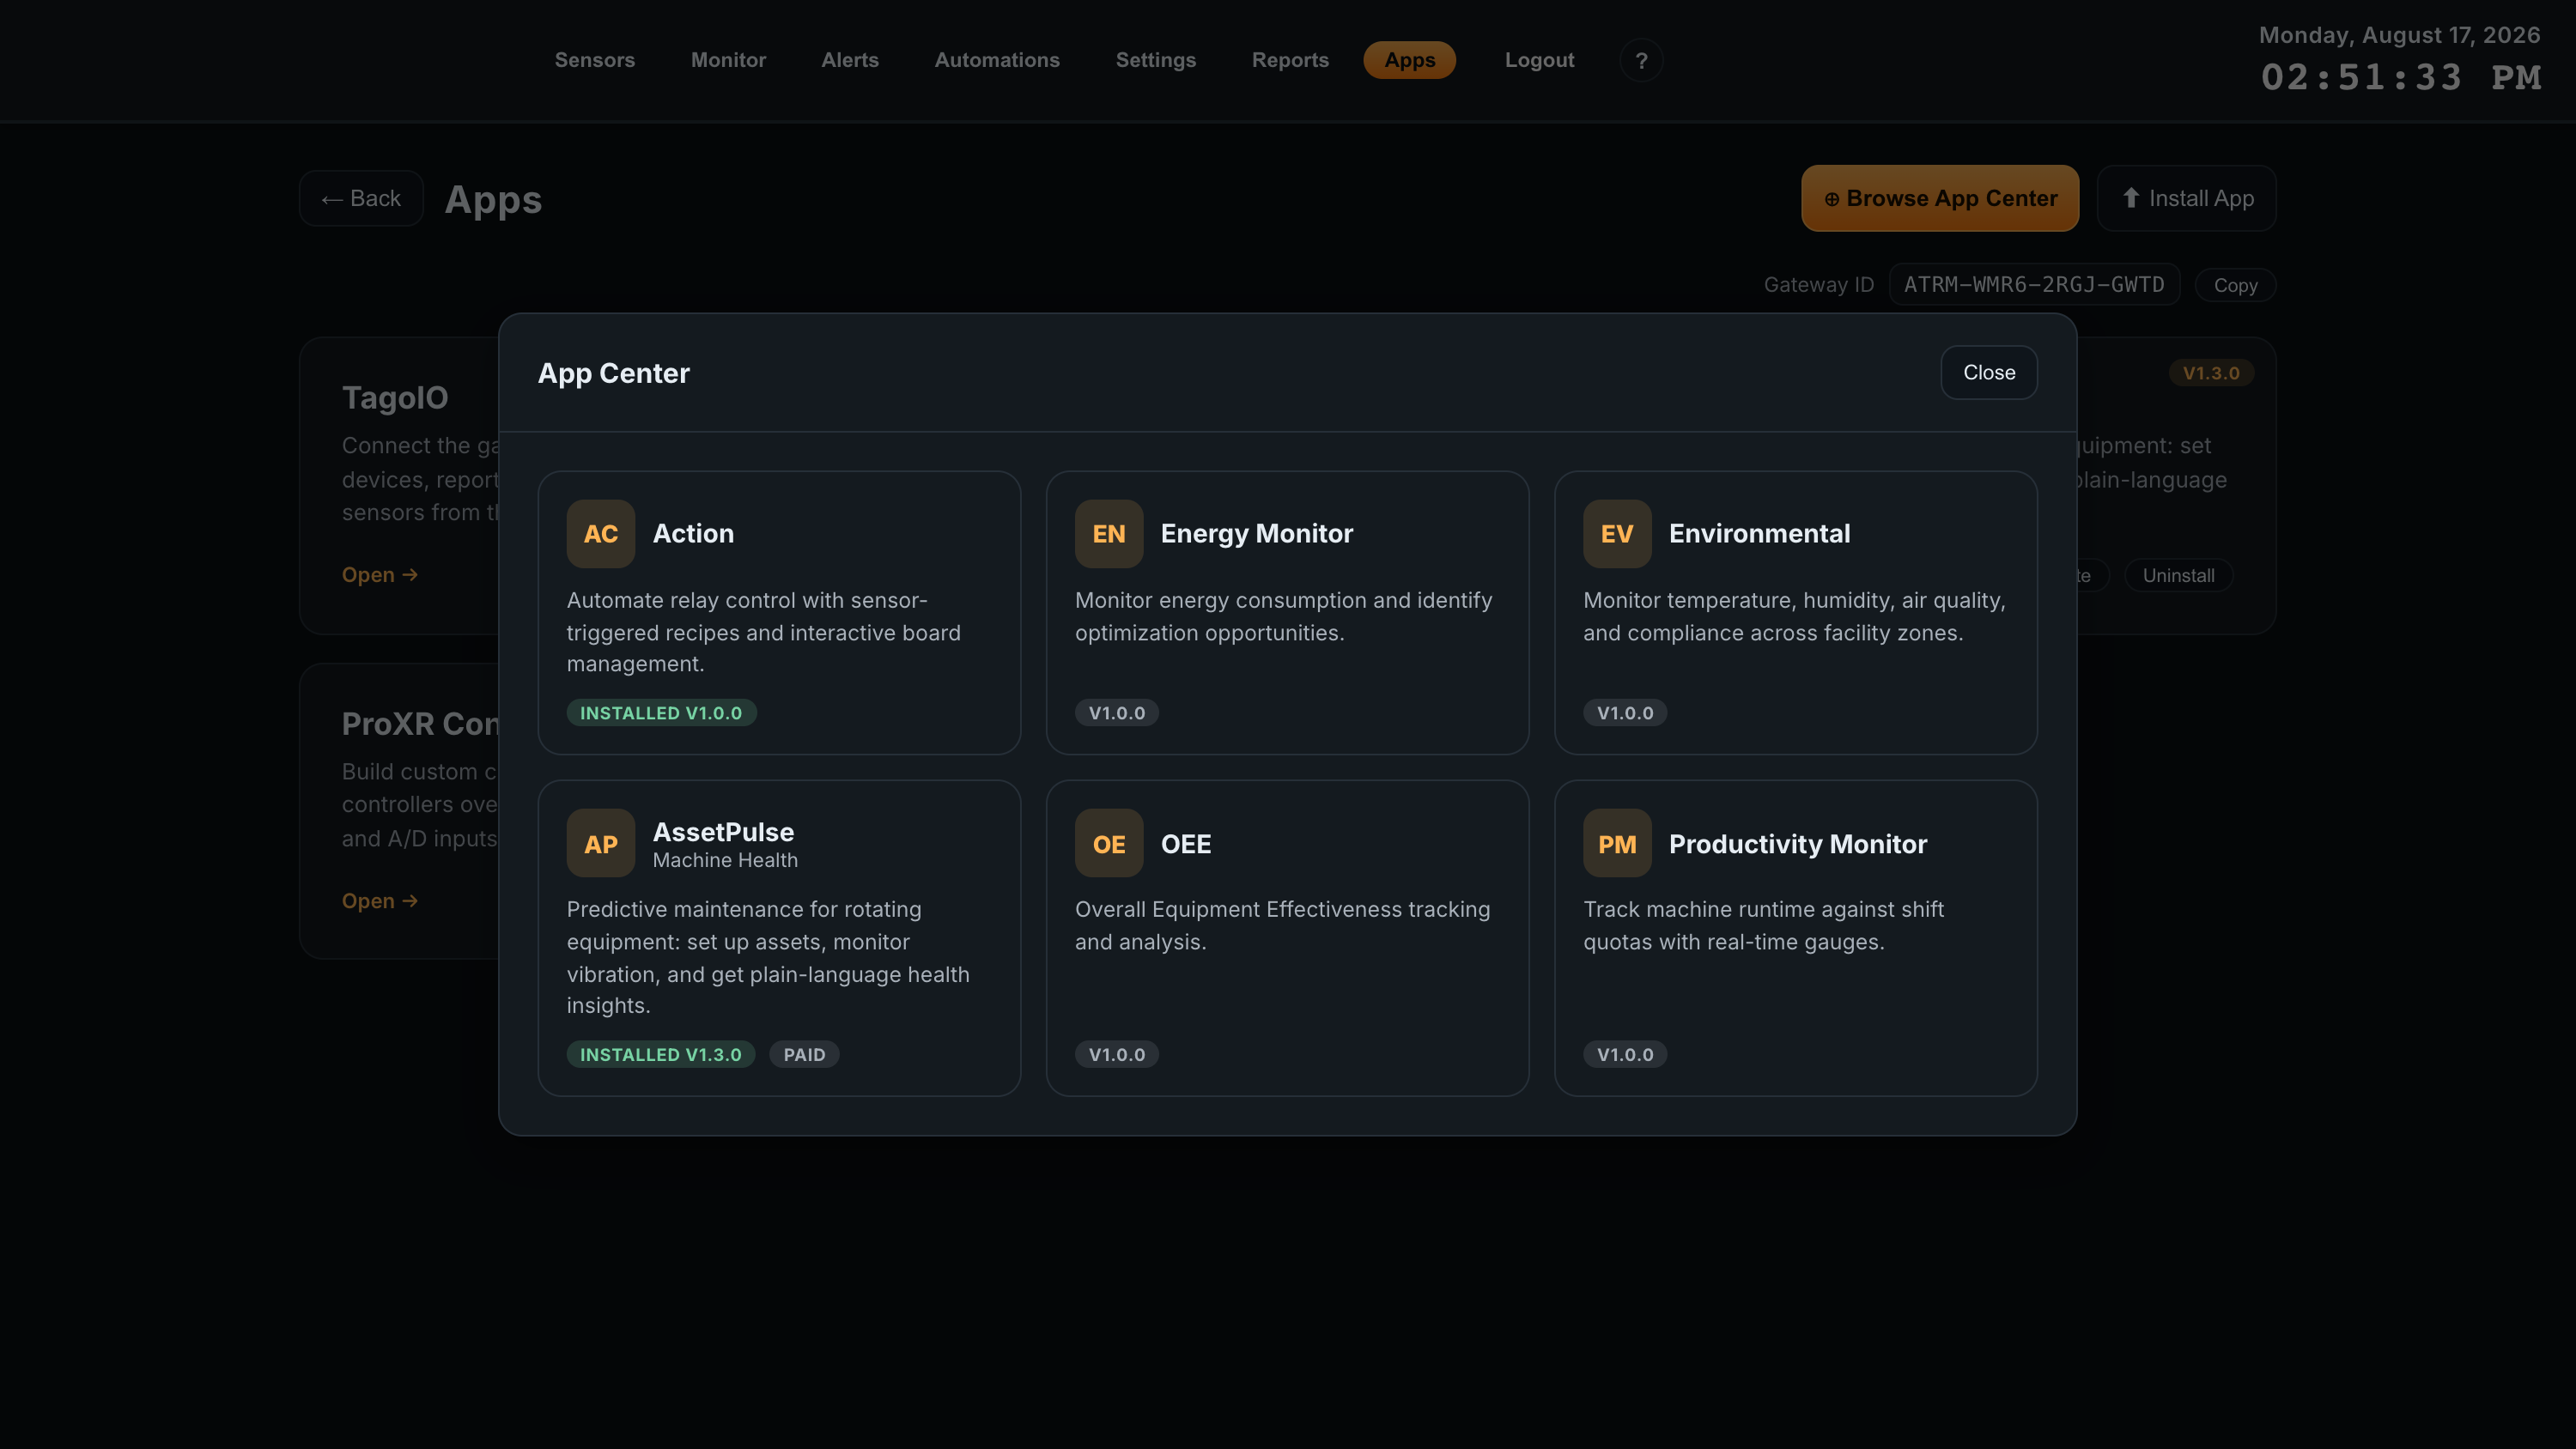
Productivity, OEE, and Energy share machine definitions, so a machine configured once can be tracked across all three. Apps support date navigation, auto-refresh when viewing today, drag-and-resize layouts, and a Fullscreen mode for floor displays.
Installing from a Package
Install App uploads an app package straight to the gateway. This is how apps distributed outside the catalog get installed — for example the TagoIO cloud integration and ProXR Control for NCD ProXR relay controllers. Once installed they behave like any other app.
12AI Assistant Access
The gateway can be connected directly to an AI assistant, so you can ask about your equipment in plain language — which sensors are unhealthy, what a machine’s vibration has been doing this week, how the mesh is routing — and have it act on what it finds.
The part that matters is what happens when you ask it to keep watching something. A chat session only exists while you have it open, so an assistant that promised to monitor your compressor would stop the moment you closed the app. Instead it writes the rule into Atrium: a trigger or an automation the gateway evaluates by itself, through reboots, with nothing connected. The conversation is how the rule gets written; the gateway is what runs it.
You decide what it may do
Access is granted as individual permissions — read sensors, read alerts, change a sensor’s configuration, run an installed app’s action, create automations. An assistant granted only read permissions can look at everything and change nothing. You can widen or narrow those permissions at any time without disconnecting it, and revoke access entirely in one click.
Connecting an assistant
There are two ways, and the right one depends on the client.
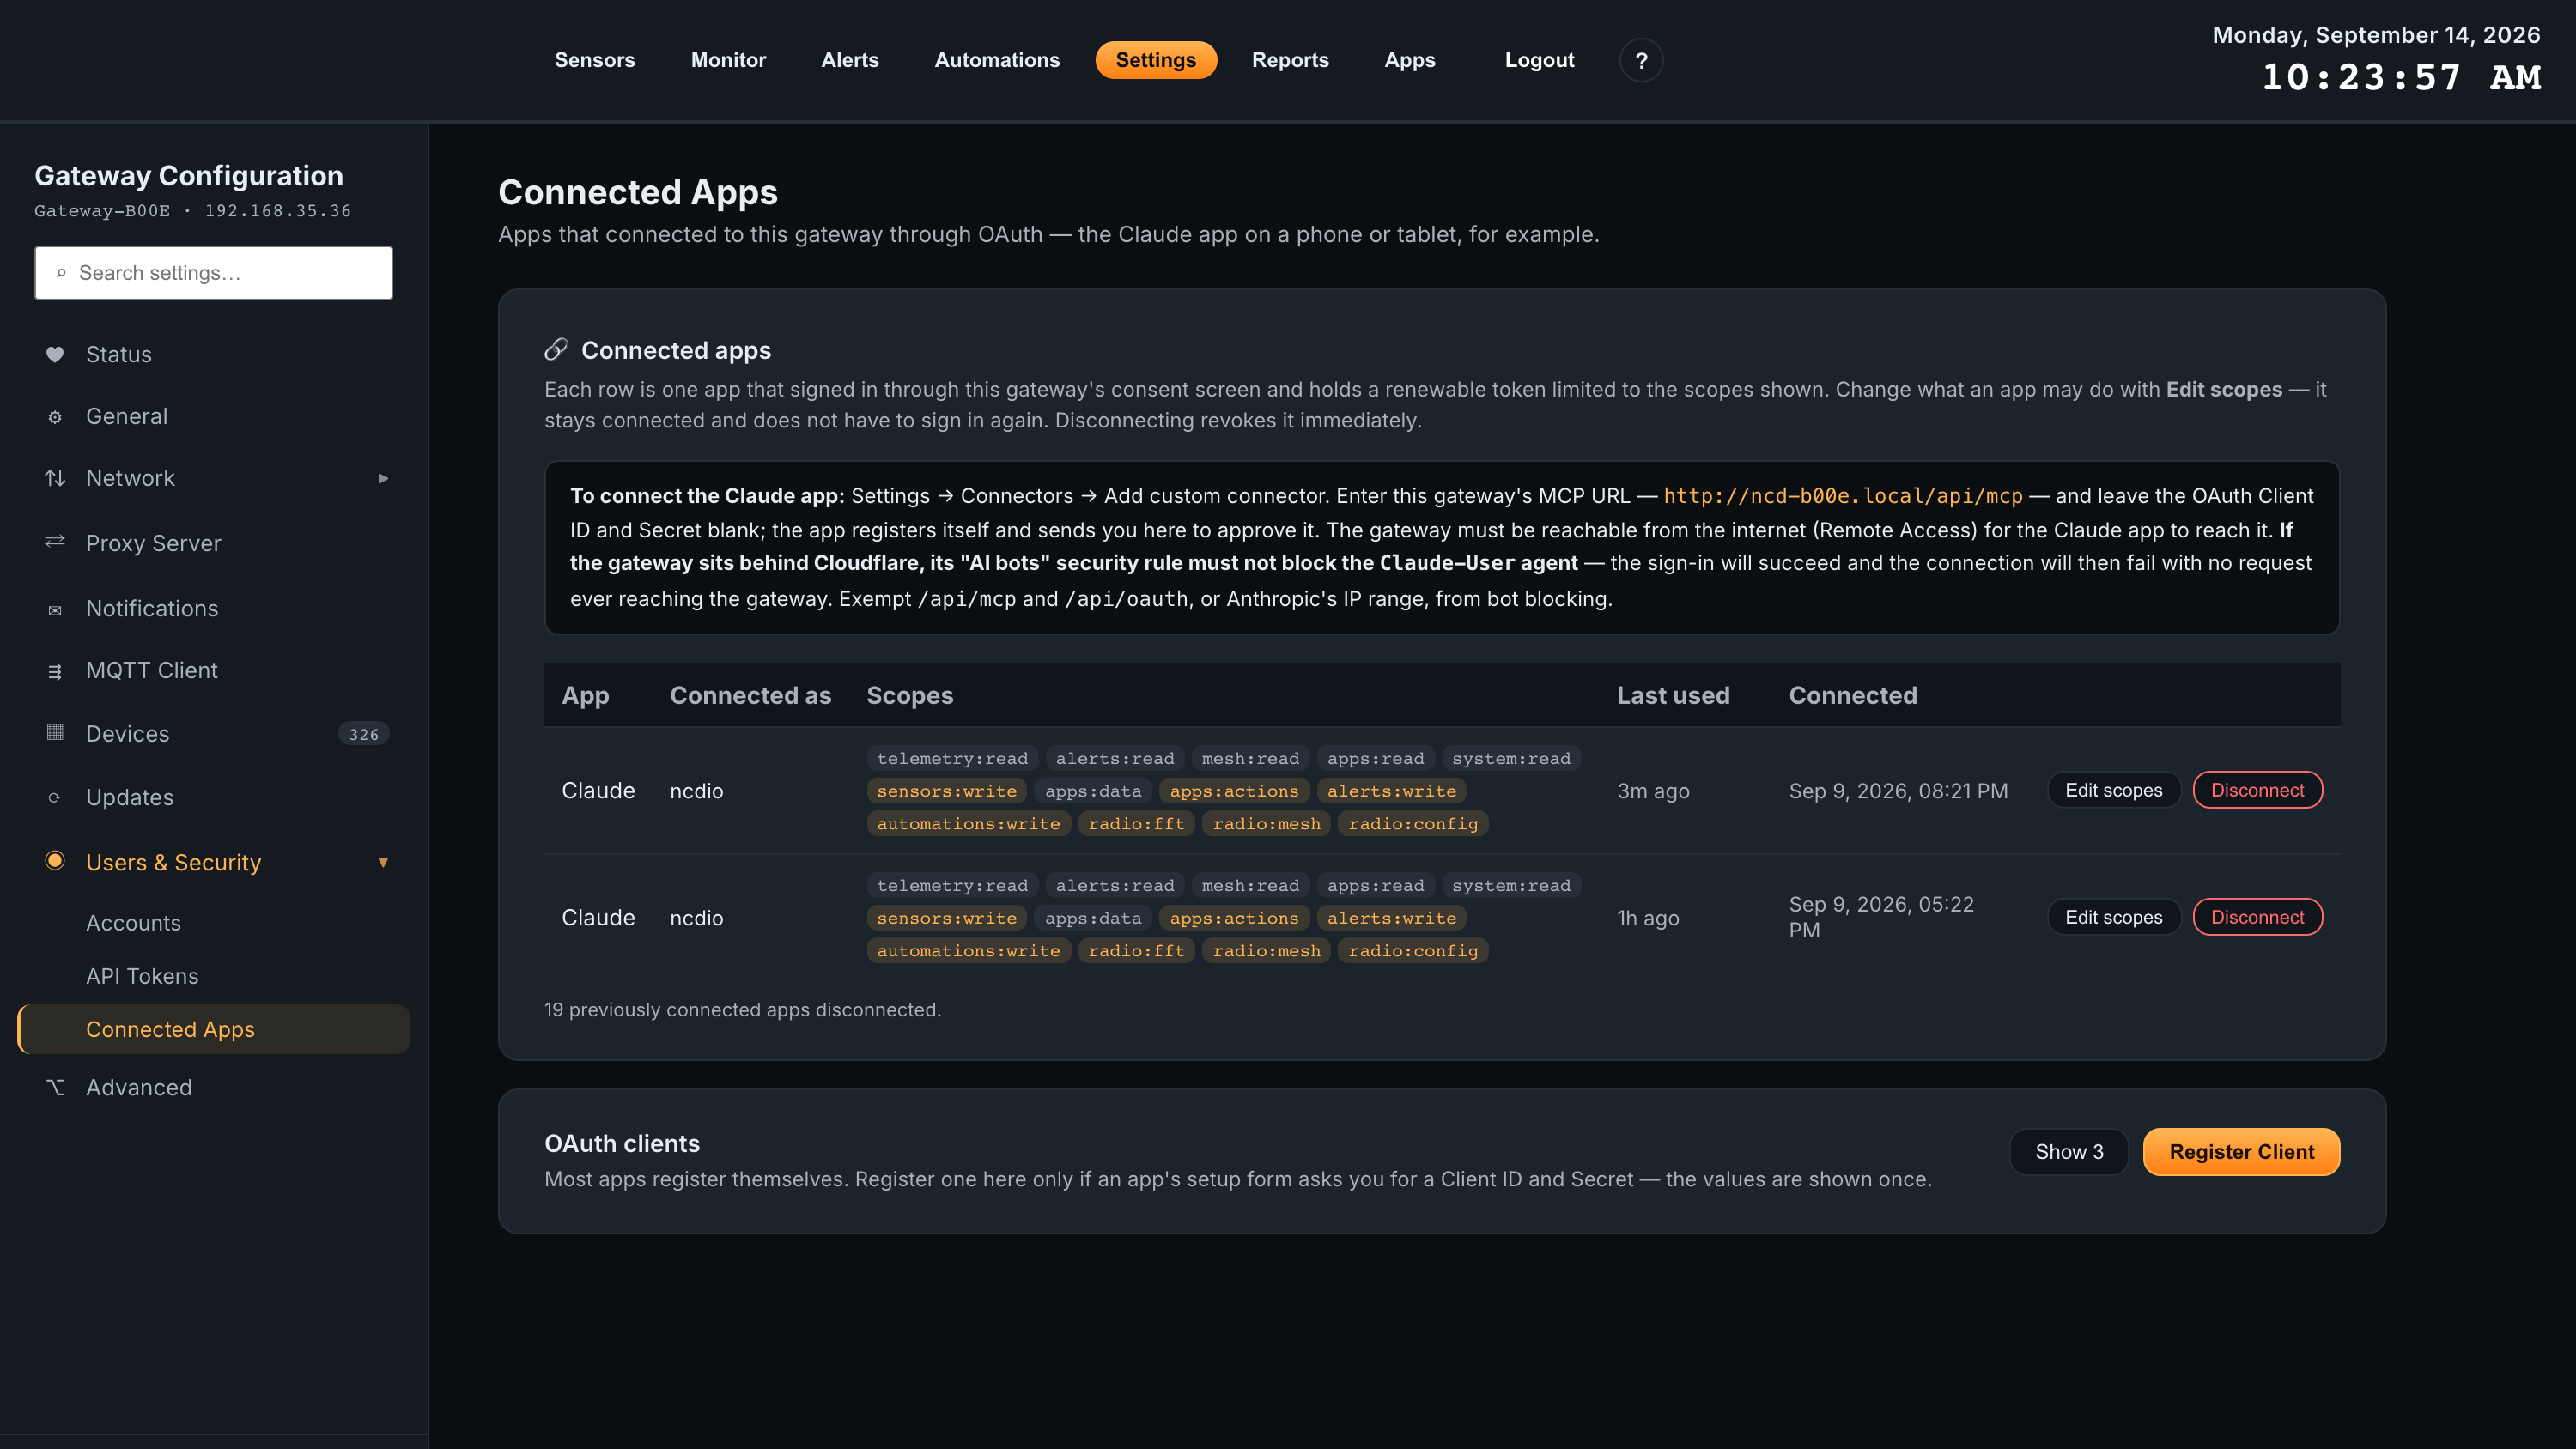
Apps that sign themselves in — the Claude app on a phone or tablet. In the app, go to Settings → Connectors → Add custom connector, enter this gateway’s MCP URL, and leave the Client ID and Secret blank. The app registers itself and sends you to a consent screen on your own gateway to approve it. Approved apps appear under Settings → Users & Security → Connected Apps. The exact URL for your gateway is printed on that panel, so you can copy it from there rather than assembling it by hand.
Anything you paste a credential into — desktop connectors, dashboards such as Grafana, your own scripts. Issue a token under Settings → Users & Security → API Tokens, tick the permissions it needs, and copy it. The token is shown once.
What an assistant can see and do
With read permissions it can list sensors and their health, query telemetry history, read alerts and alert history, inspect mesh topology and vibration captures, and read what installed apps expose. With write permissions it can additionally set sensor metadata, change sensor configuration, request captures and mesh tests, run app actions, and create alert rules and automations. Installed apps extend this, so the vocabulary grows as you install apps.
13Gateway Settings
Everything about how the gateway itself behaves lives under Settings. A sidebar on the left lists each group of settings; a search box at the top filters it, and the footer shows the gateway’s MAC address, platform version, and a Re-run Setup Wizard button.
Status
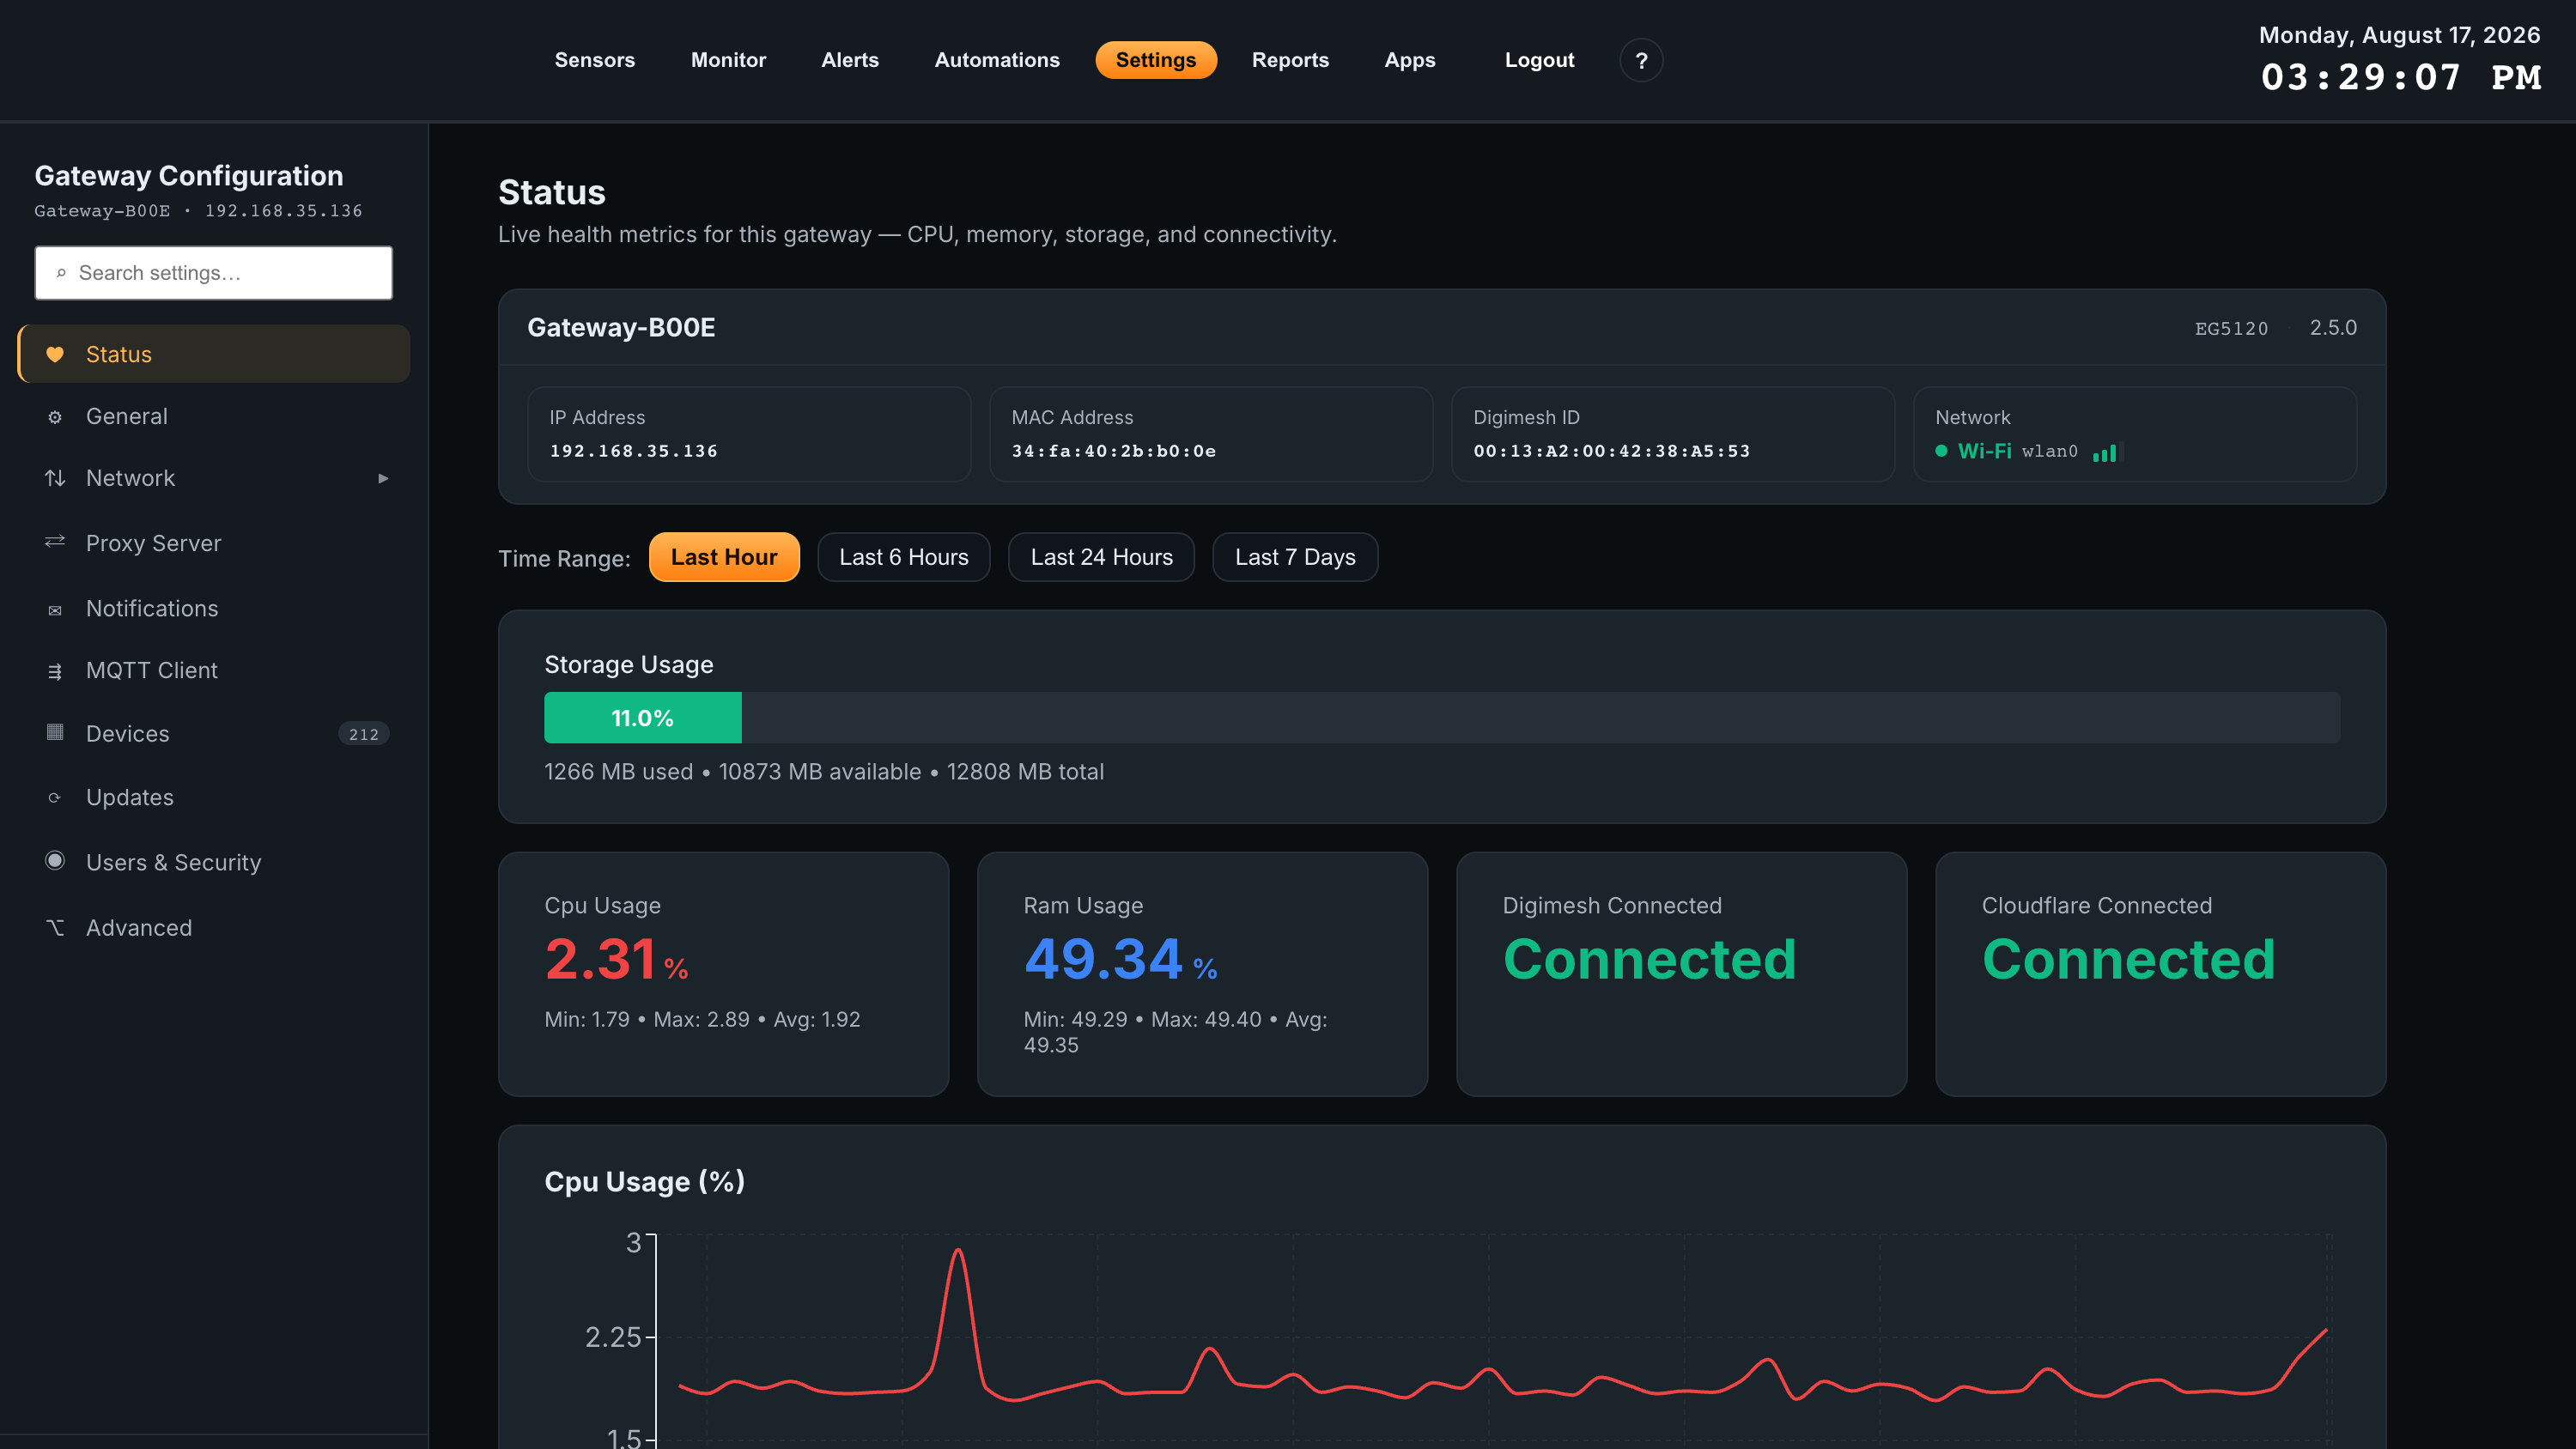
The landing panel is a live health view of the gateway hardware: its name, model, and platform version, the IP and MAC addresses, the DigiMesh radio ID, and which network interface is active. Below that are storage, CPU, and RAM usage, the DigiMesh and Cloudflare connection states, and charts for each over a selectable time range (1 hour, 6 hours, 24 hours, or 7 days).
General
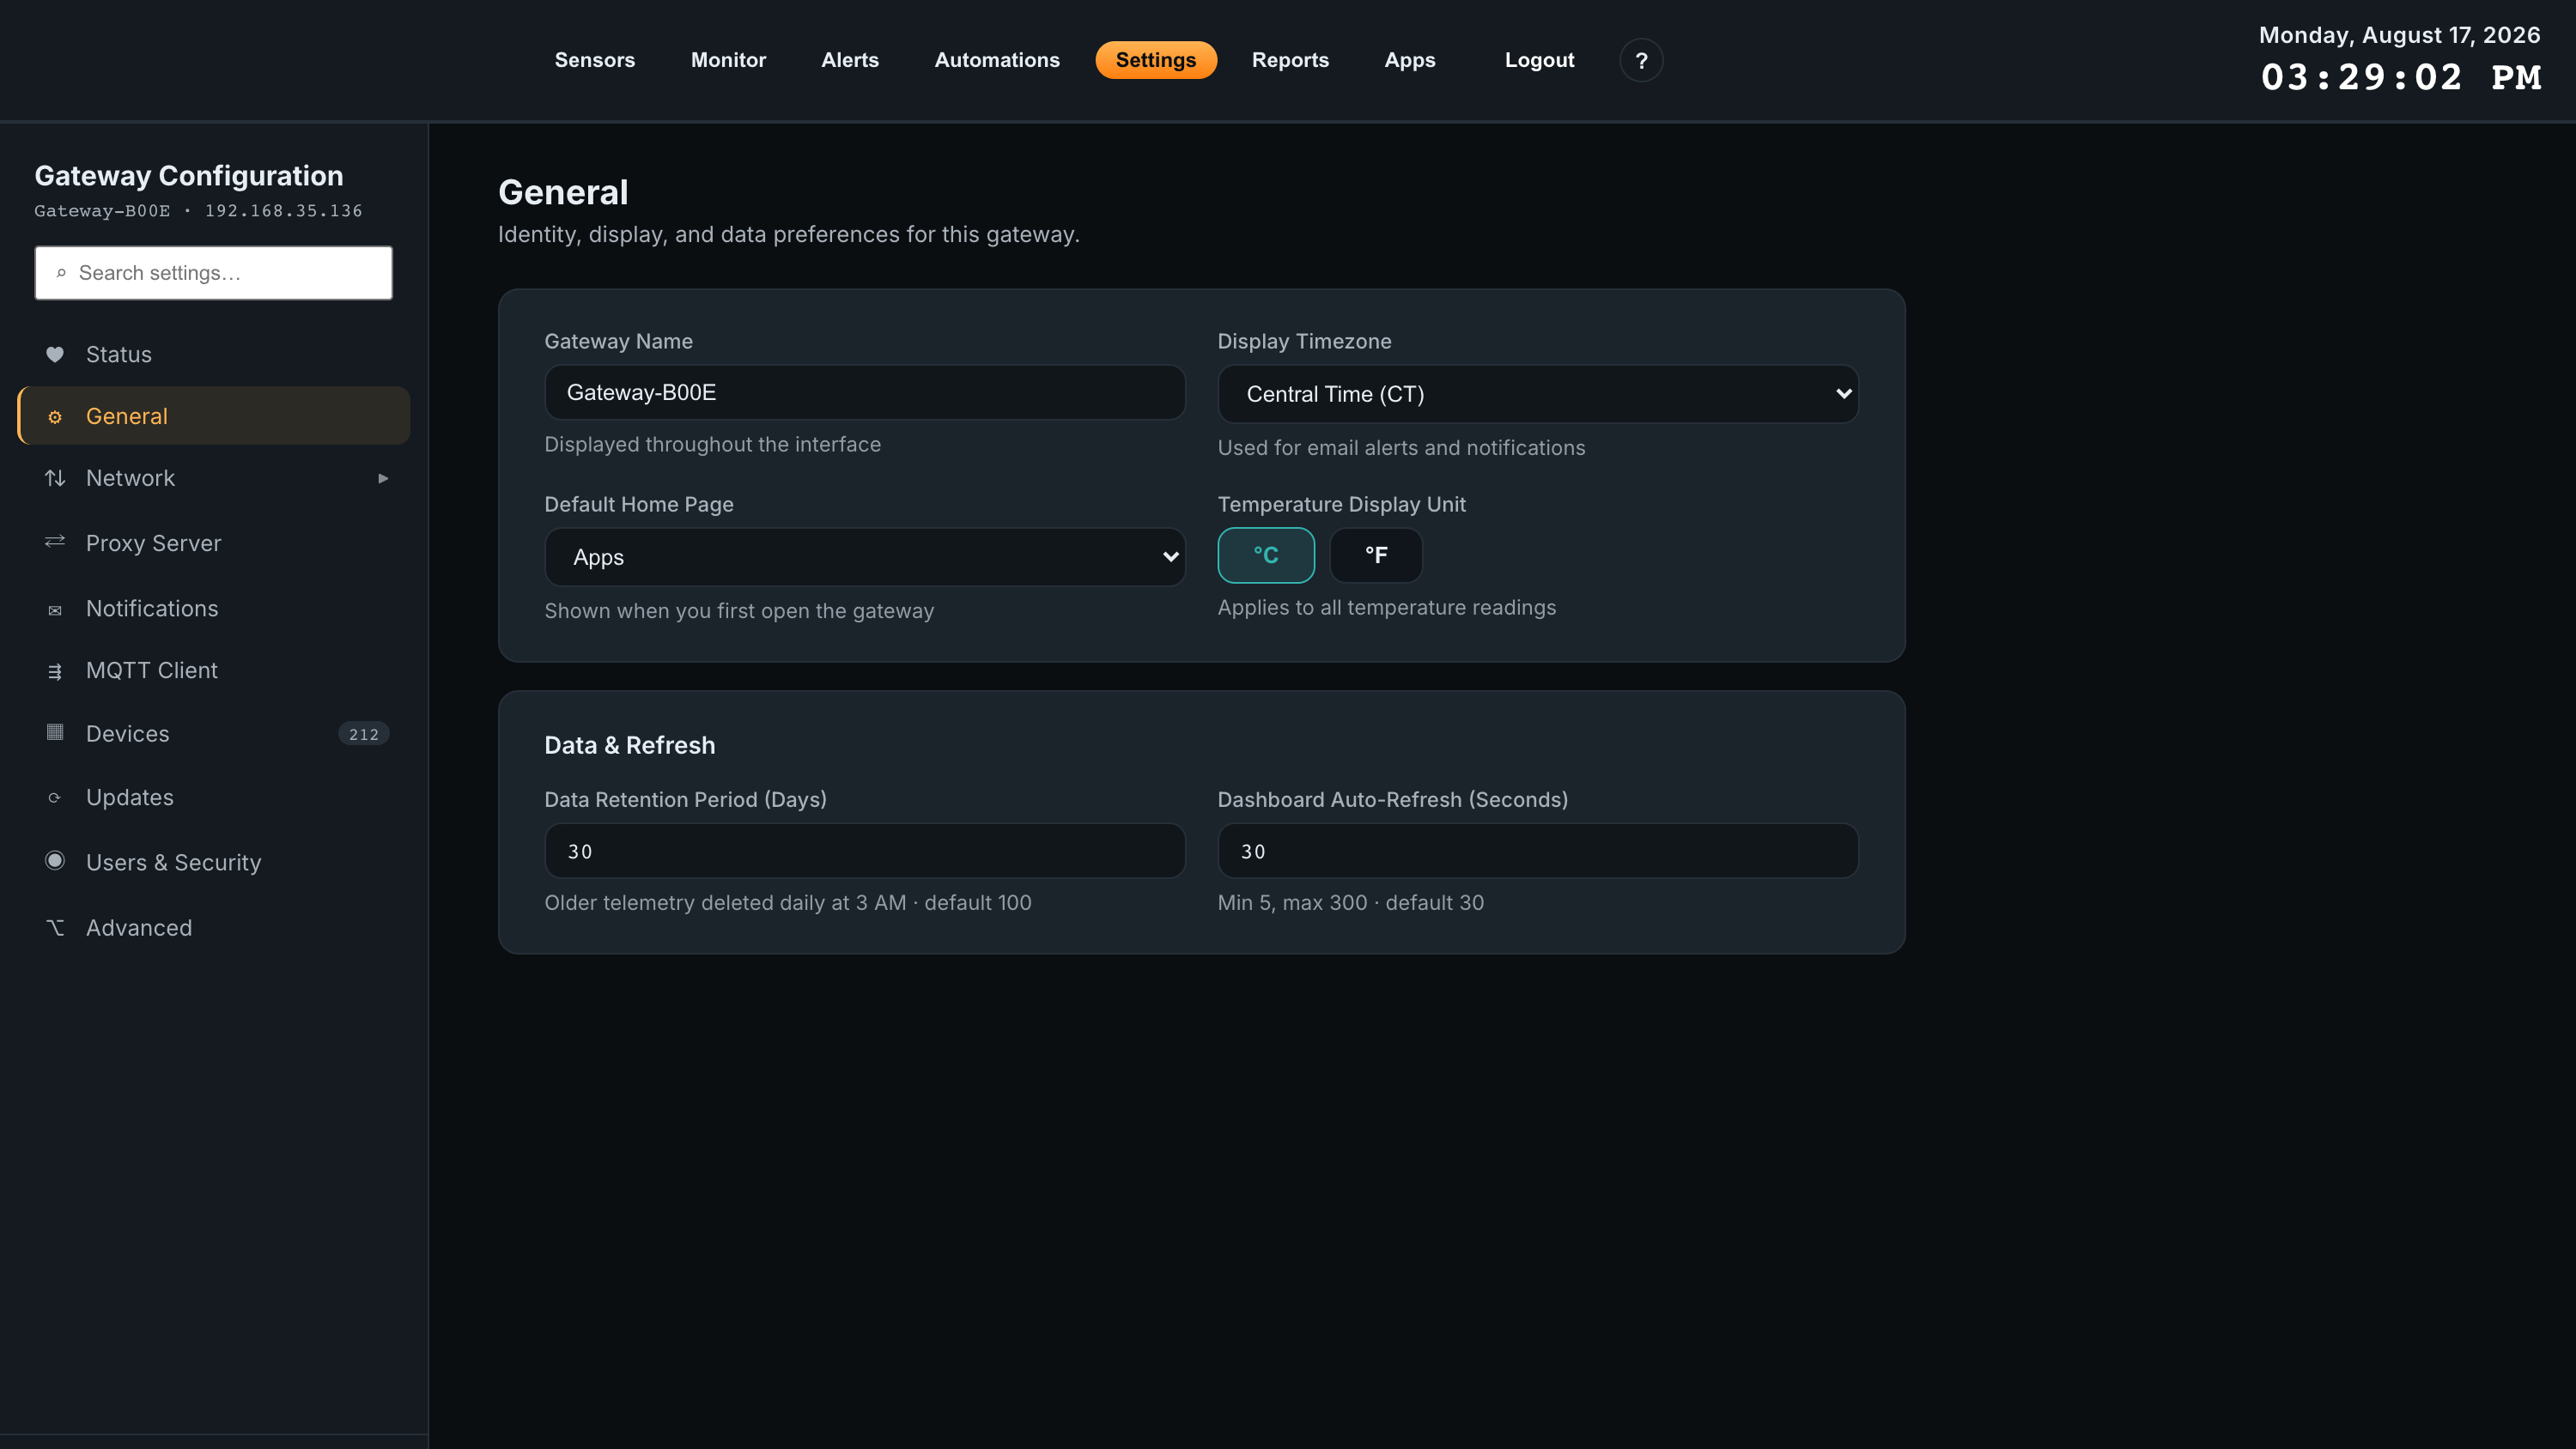
| Setting | What it does | Default |
|---|---|---|
| Gateway Name | The display name shown in the Atrium header, and used in MQTT topic paths. | Gateway-XXXX |
| Display Timezone | Timezone used for displaying timestamps and for scheduling. Separate from the gateway’s own clock timezone under Network → Time & NTP. | — |
| Temperature Display Unit | Toggle between °C and °F. Applies globally to every temperature reading in Atrium. | °C |
| Data Retention | How many days of telemetry to keep. Older data is deleted automatically each day at 3 AM. | 100 days |
| Dashboard Refresh | How often pages refresh their data, in seconds (minimum 5, maximum 300). | 30 s |
Click Save Configuration after making changes.
WiFi
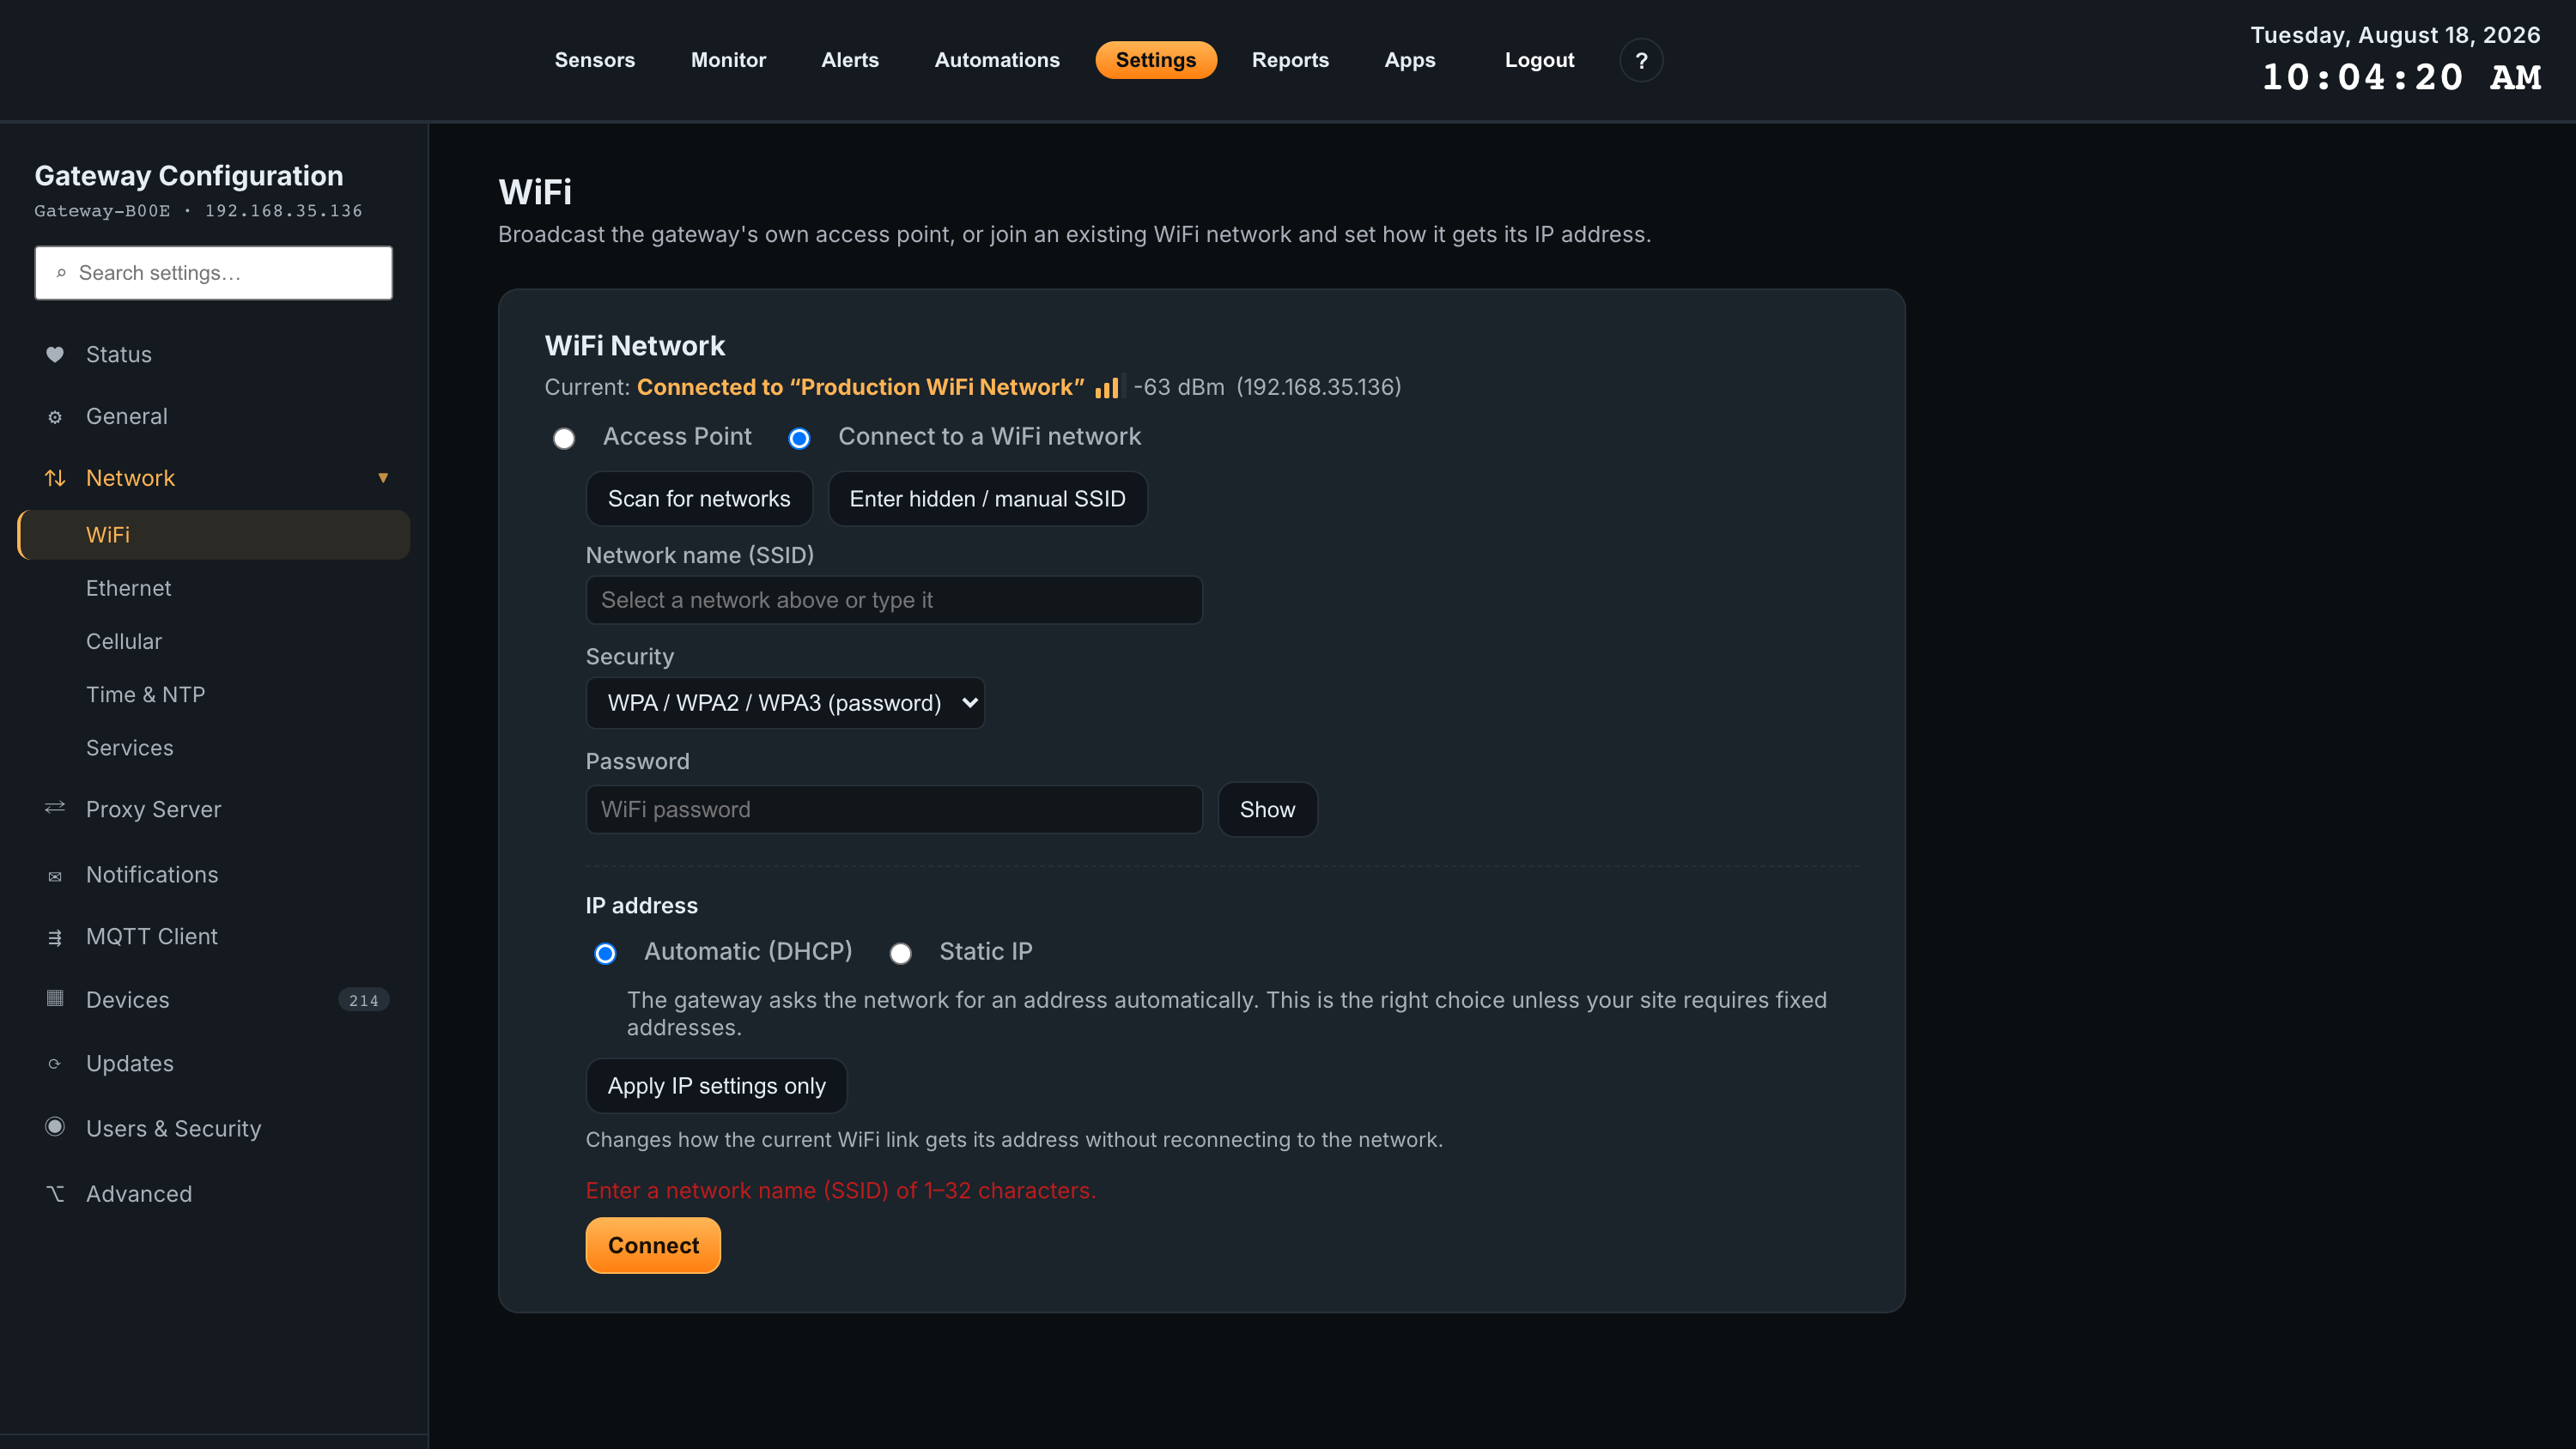
The gateway can either broadcast its own Access Point or Connect to a WiFi network. The panel header shows the current state — the network it is joined to, the signal strength in dBm, and the address it was given.
- Scan for networks lists what the radio can see, or use Enter hidden / manual SSID to type a network name that is not broadcast.
- Security offers WPA / WPA2 / WPA3 (password), Open (no password), or WEP (legacy).
- IP address is either Automatic (DHCP) — the right choice unless your site requires fixed addresses — or Static IP.
- Apply IP settings only changes how the current link gets its address without reconnecting to the network. Connect joins the network.
Ethernet
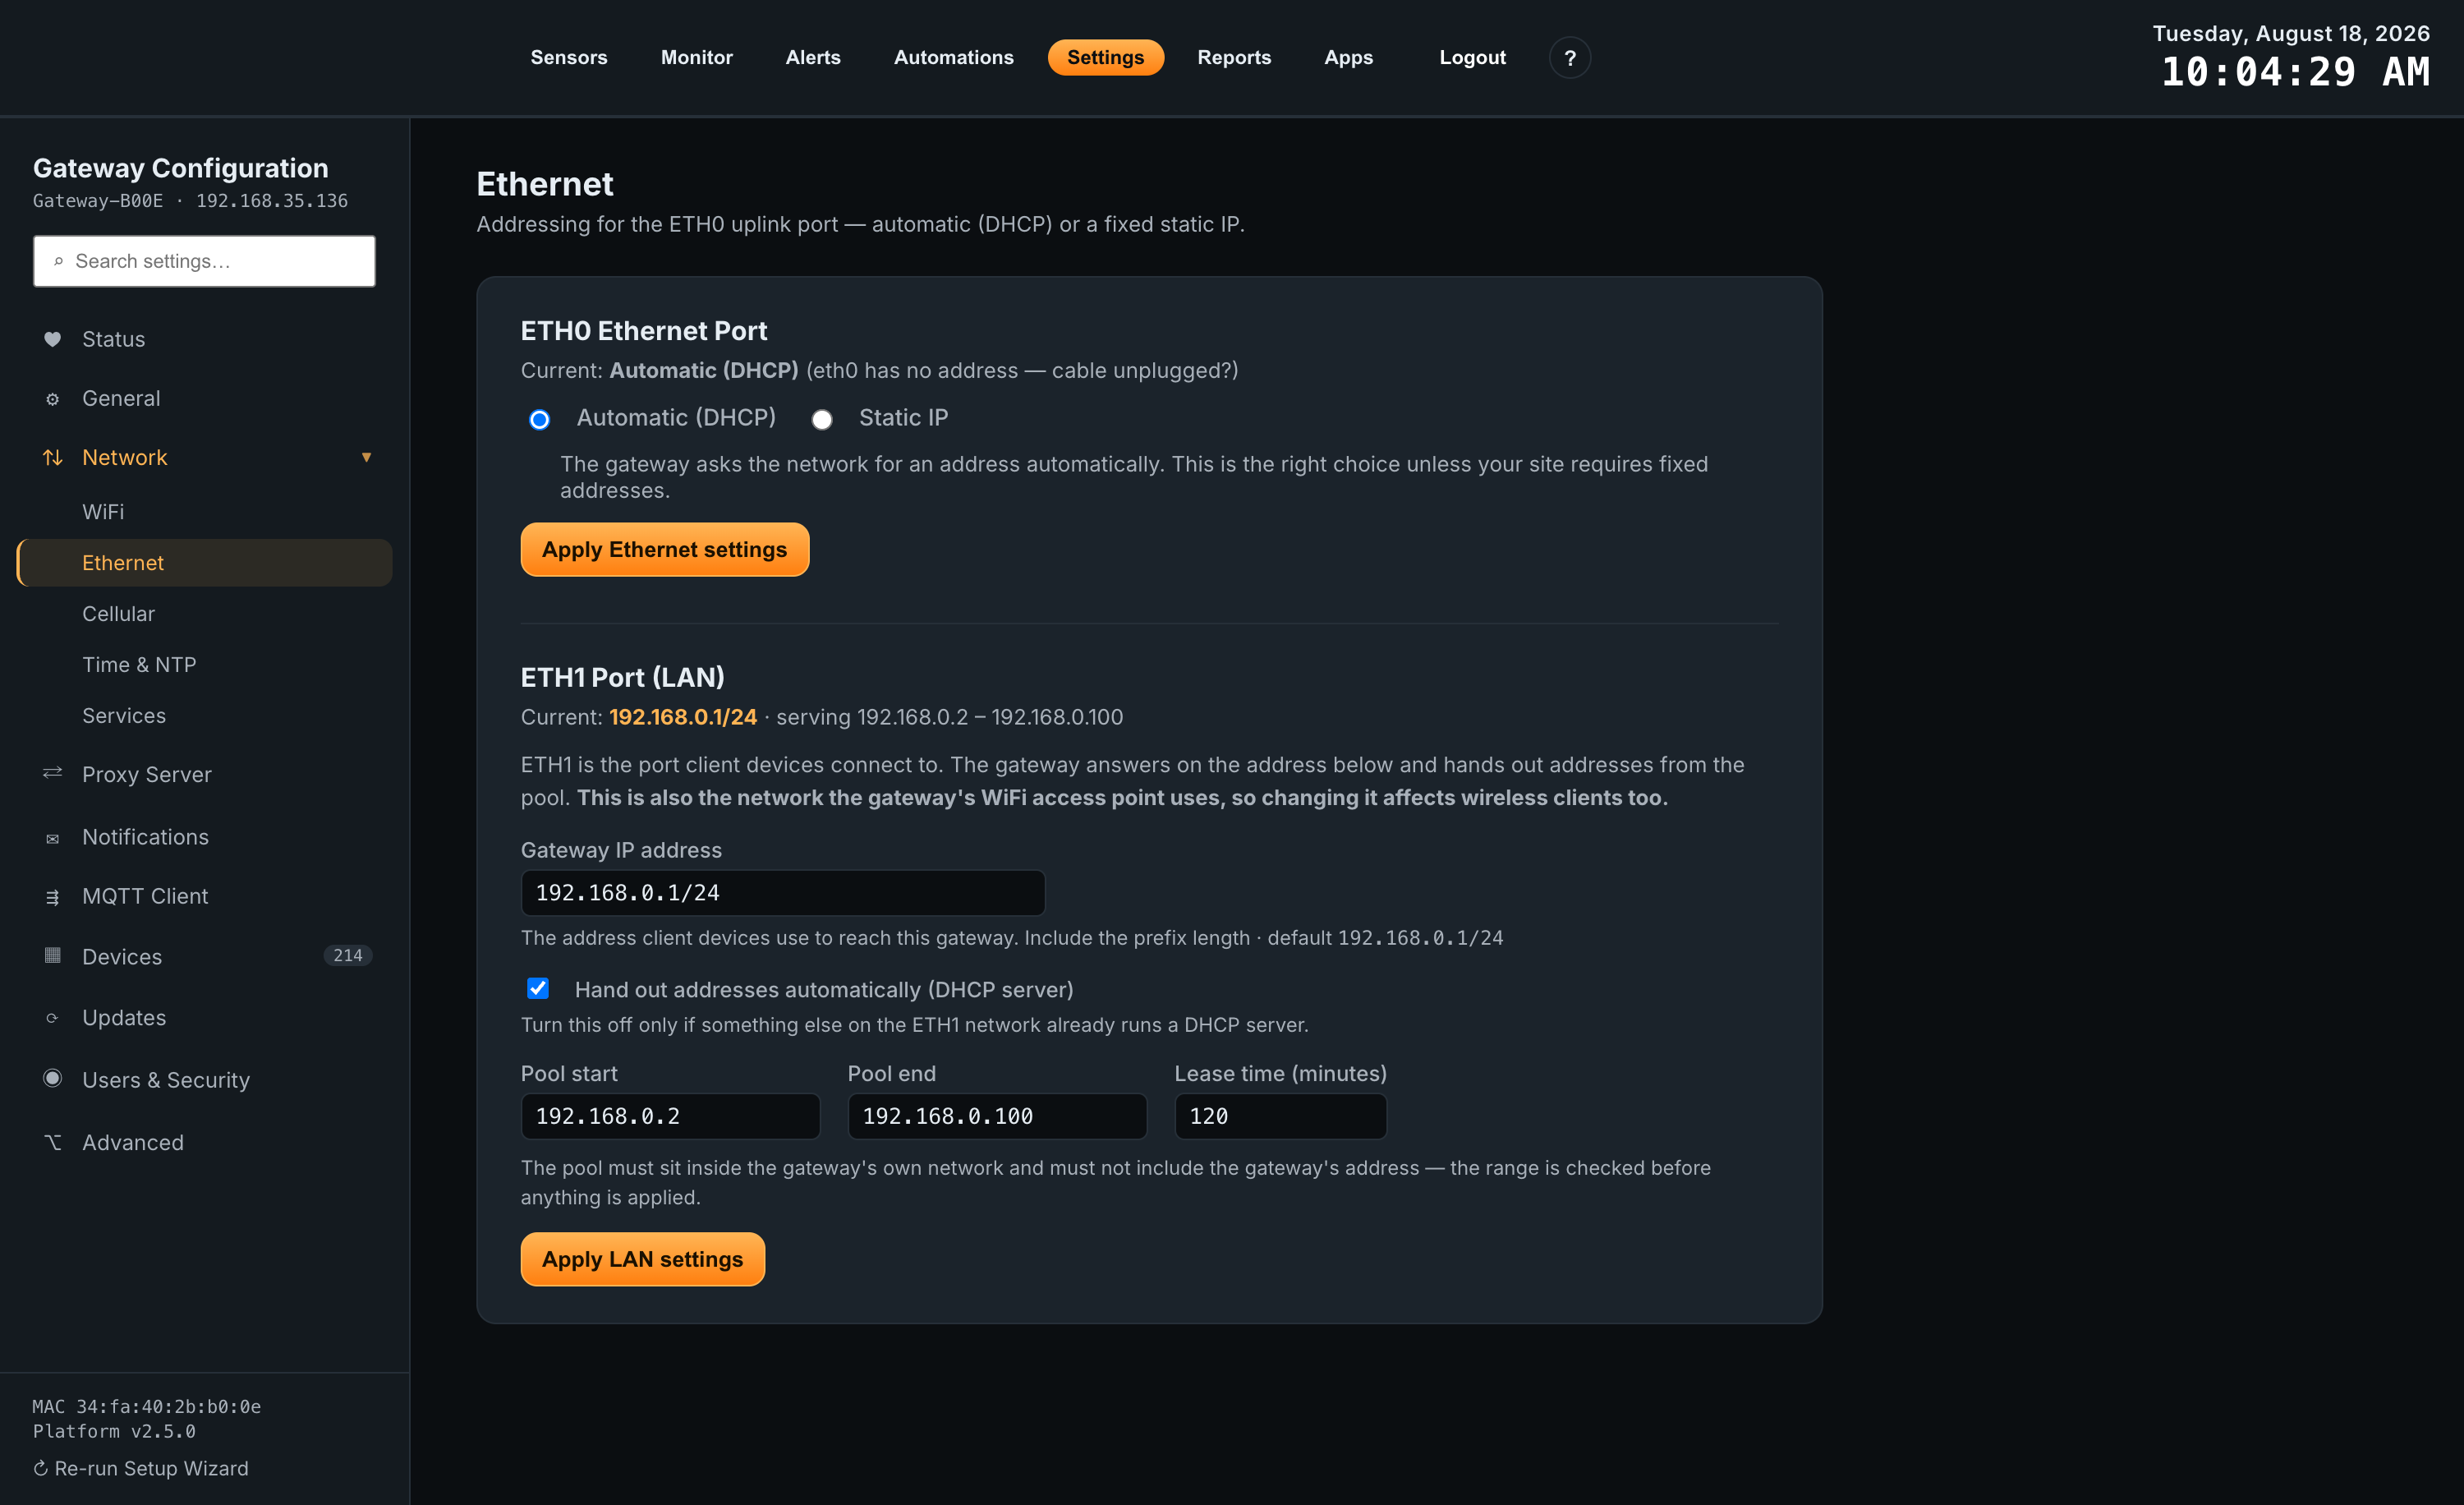
The two Ethernet ports do different jobs, and each is configured separately.
- ETH0 is the uplink port — the one facing your existing network. Set it to Automatic (DHCP) or Static IP, then Apply Ethernet settings. The panel reports the current address, and tells you if the port has none (usually an unplugged cable).
- ETH1 is the LAN port that client devices plug into. The gateway answers on the address you set here and hands out addresses from a pool. Set the Gateway IP address including its prefix length, whether to hand out addresses automatically (DHCP server), the pool start and end, and the lease time in minutes, then Apply LAN settings.
Cellular
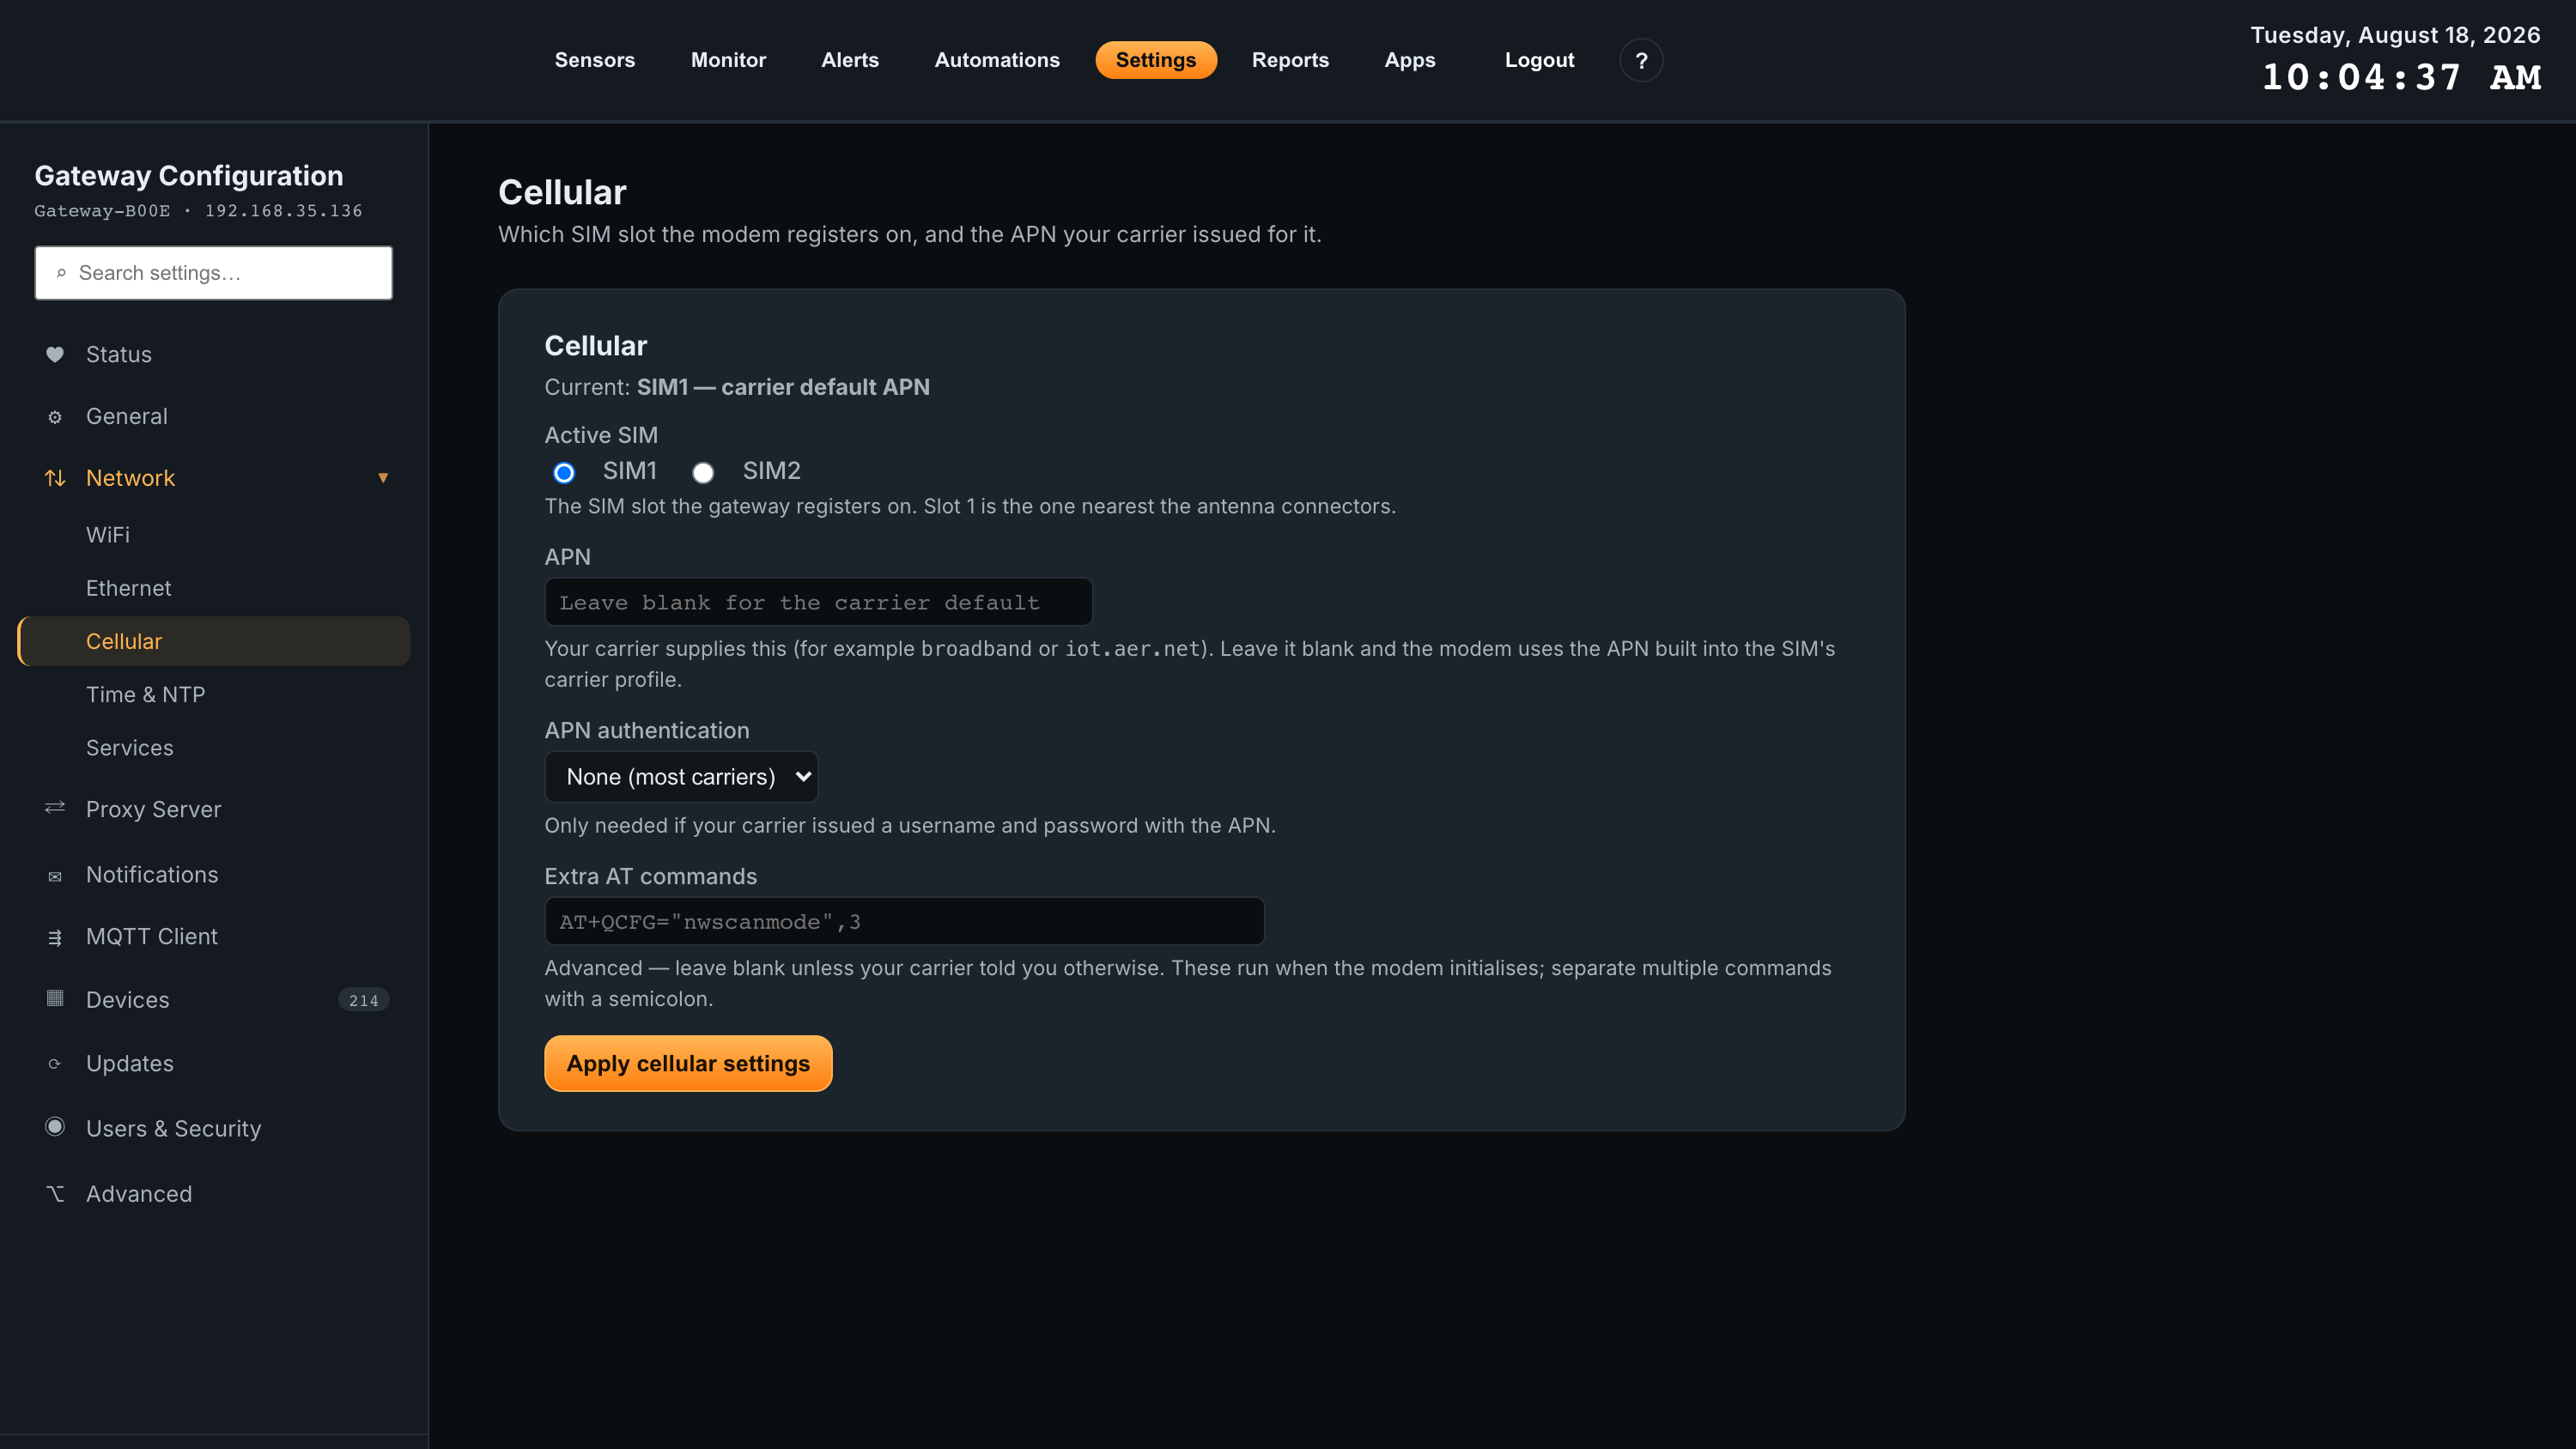
For gateways with a cellular modem, this panel selects which SIM the modem registers on and the APN your carrier issued.
- Active SIM — SIM1 or SIM2. Slot 1 is the one nearest the antenna connectors.
- APN — supplied by your carrier (for example
broadbandoriot.aer.net). Leave it blank and the modem uses the APN built into the SIM’s carrier profile. - APN authentication — None for most carriers, or supply the username and password if your carrier issued them.
- Extra AT commands — advanced, and normally blank. These run when the modem initialises; separate multiple commands with a semicolon.
Time & NTP
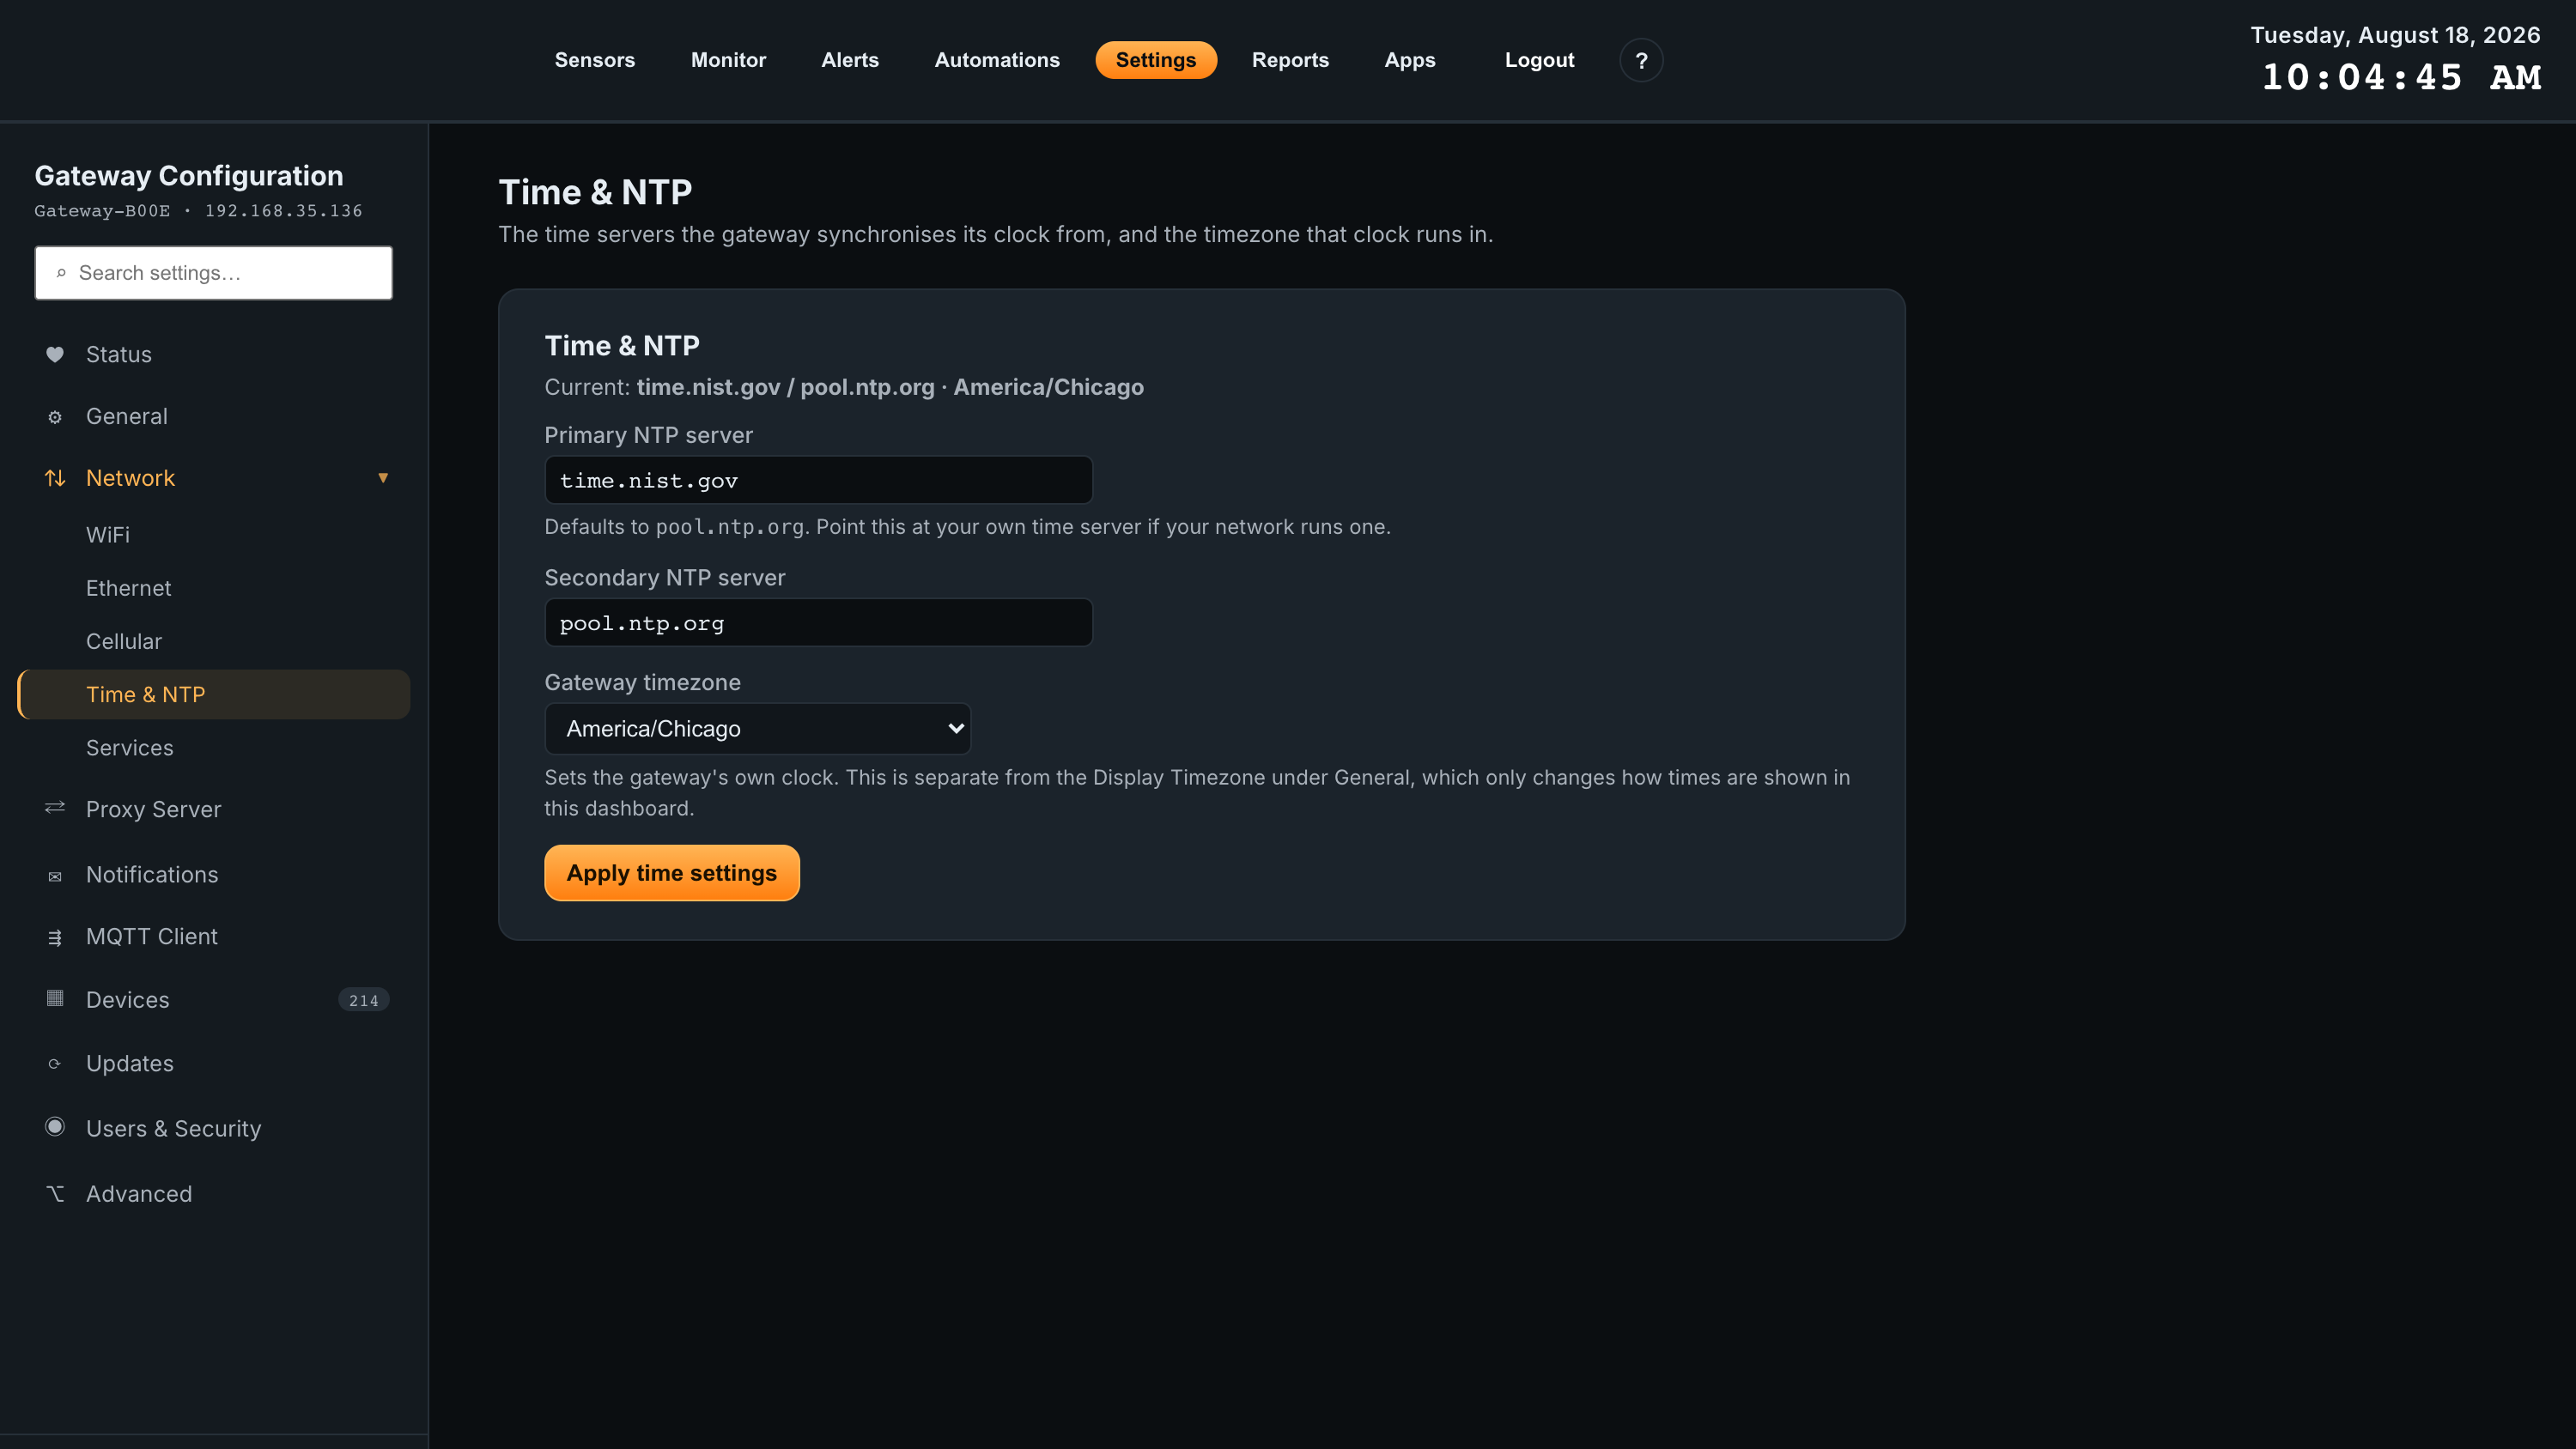
Sets the time servers the gateway synchronises its clock from, and the timezone that clock runs in. Provide a primary and secondary NTP server — point these at your own time server if your network runs one — and a gateway timezone.
Services
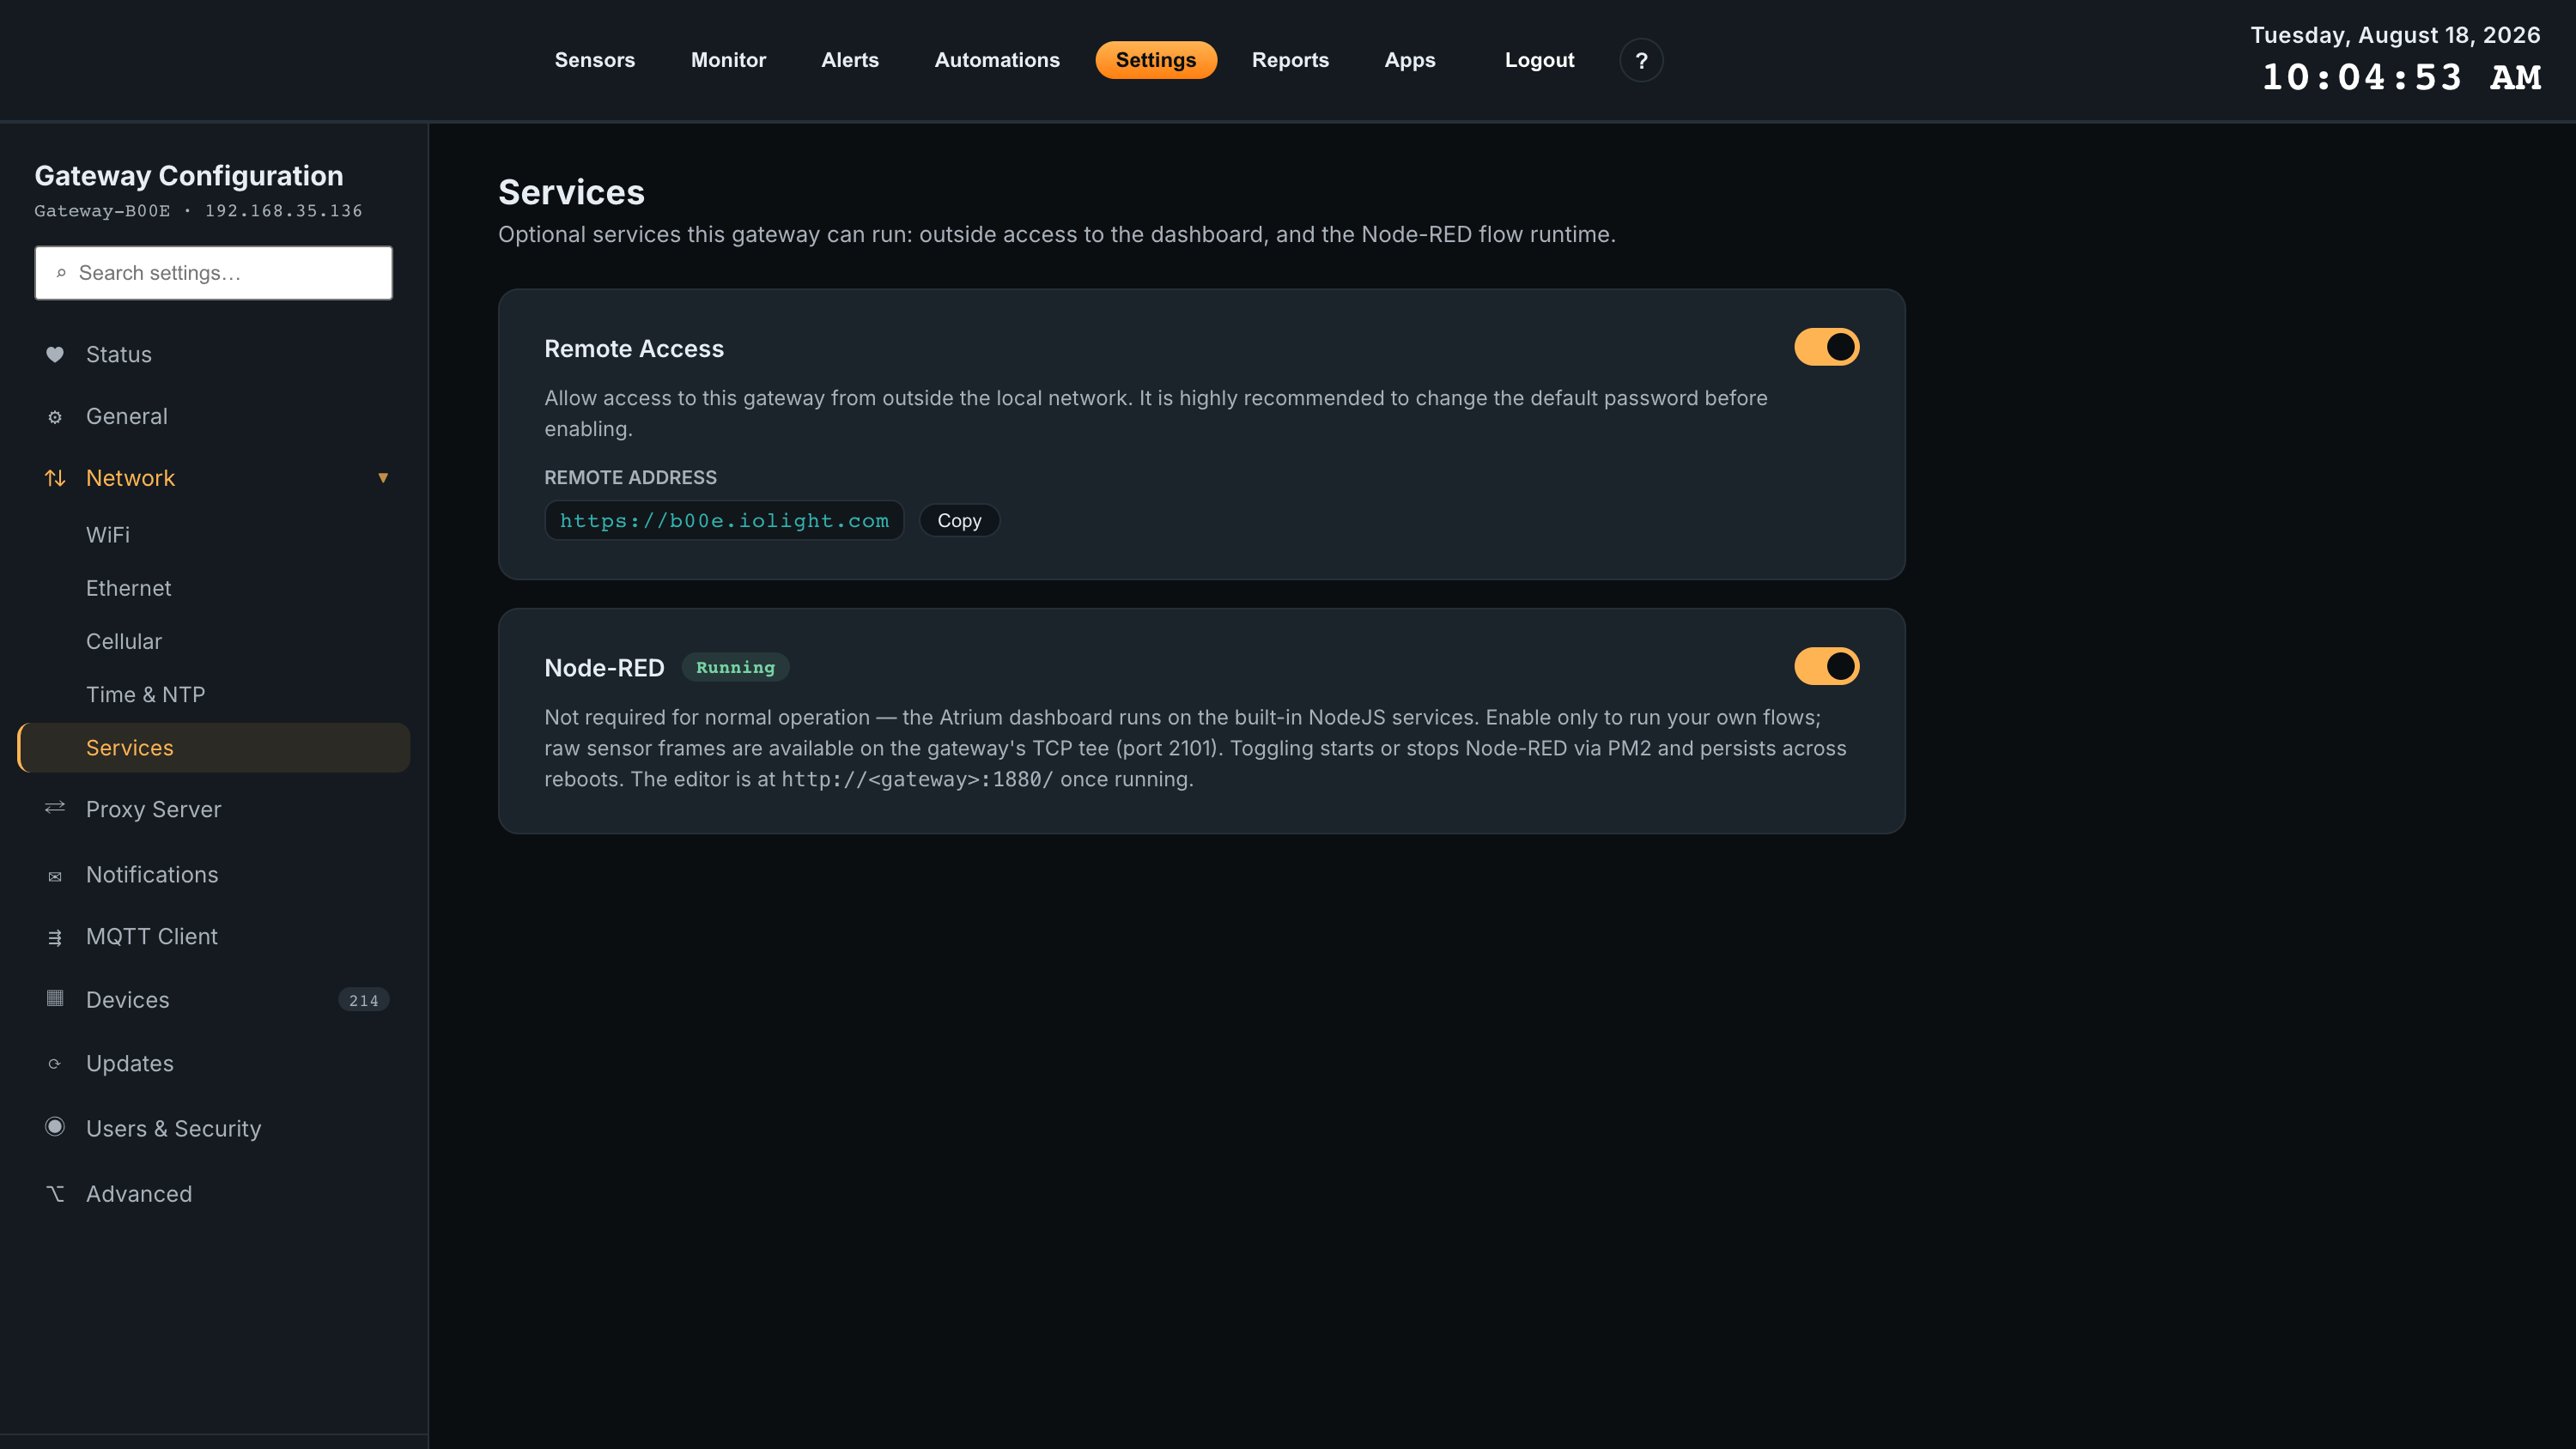
Two optional services the gateway can run.
- Remote Access — allows reaching the dashboard from outside the local network. Once enabled, the panel shows the remote address (an
https://URL) with a Copy button. No port forwarding or static IP is required. - Node-RED — not required for normal operation; the dashboard runs on the gateway’s built-in services. Enable it only to run your own flows. Raw sensor frames are available on the gateway’s TCP tee on port 2101, and the editor is at
http://<gateway>:1880/once running. Toggling starts or stops it and persists across reboots.
Proxy Server
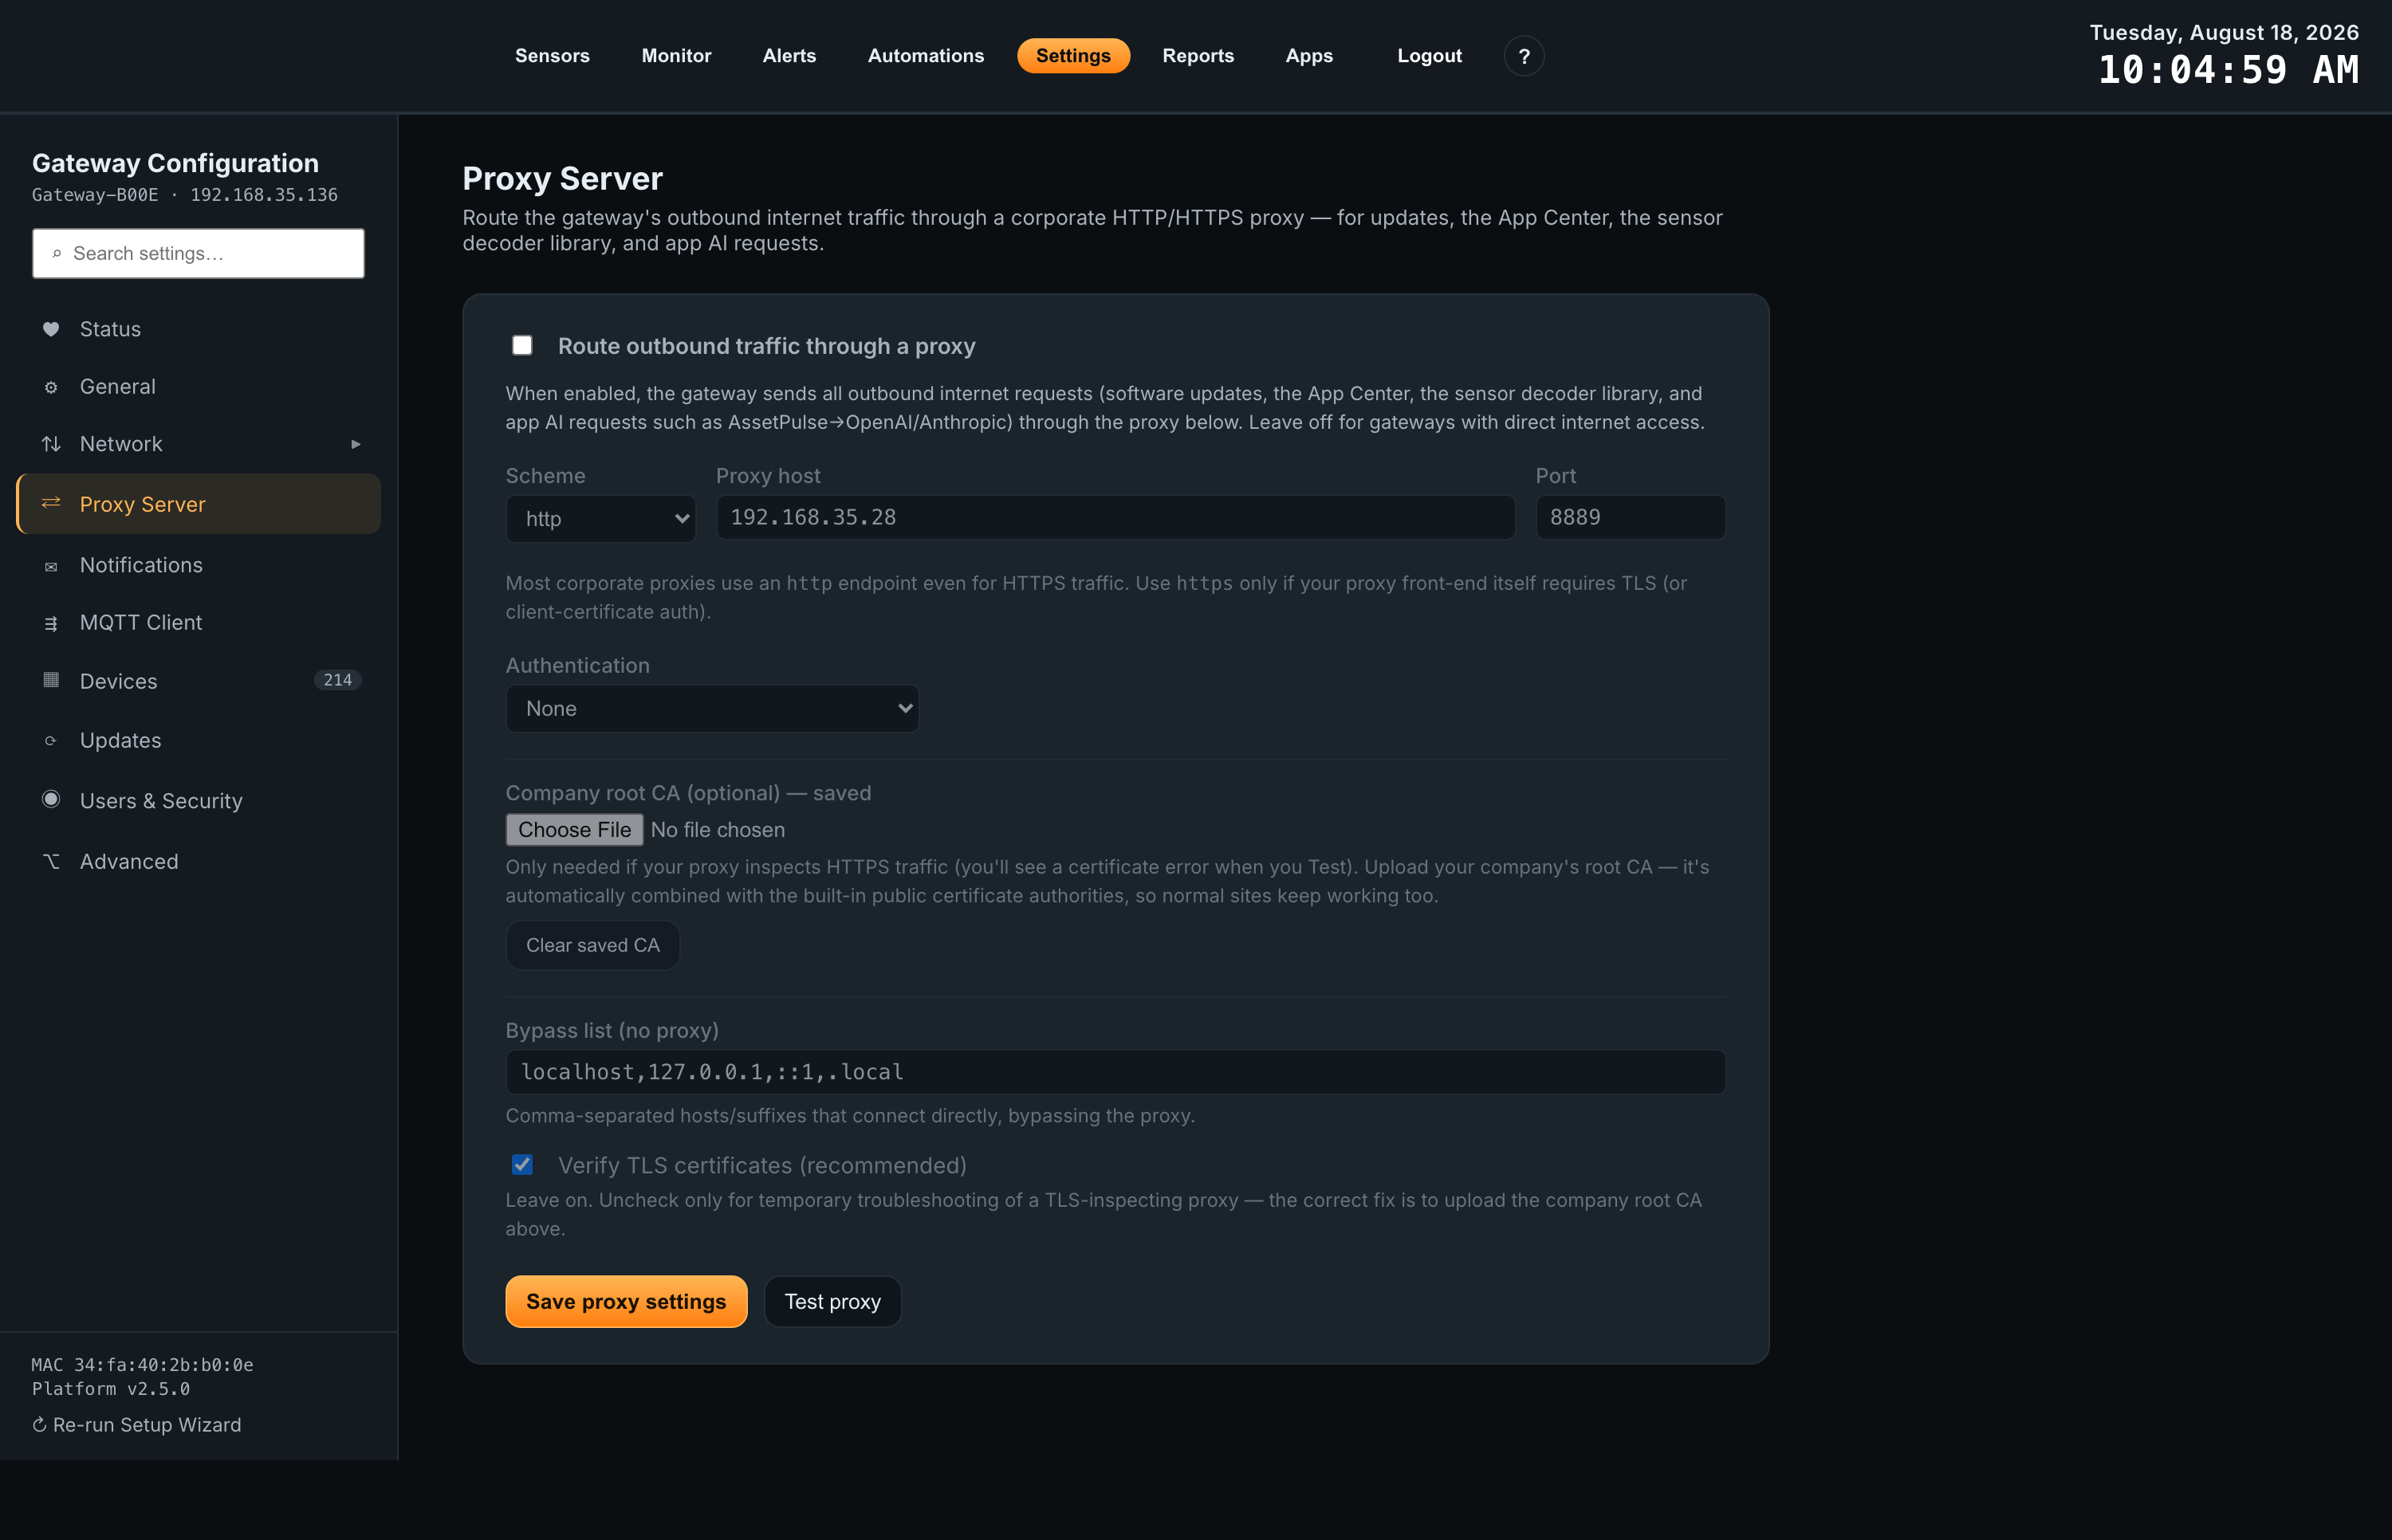
For sites where outbound internet access goes through a corporate proxy. When enabled, the gateway sends all outbound requests — software updates, the App Center, the sensor decoder library, and app AI requests — through the proxy you configure here. Leave it off for gateways with direct internet access.
| Field | What it does |
|---|---|
| Scheme | http or https. Most corporate proxies use an http endpoint even for HTTPS traffic; choose https only if the proxy front-end itself requires TLS or client-certificate auth. |
| Proxy host / Port | Where the proxy listens. |
| Authentication | None, Basic, or NTLM for Windows domains. |
| Company root CA | Only needed if the proxy inspects HTTPS traffic — you will see a certificate error when you Test. The uploaded CA is combined with the built-in public authorities, so normal sites keep working. |
| Bypass list | Comma-separated hosts or suffixes that connect directly, bypassing the proxy. |
| Verify TLS certificates | Leave on. Uncheck only for temporary troubleshooting — the correct fix for a TLS-inspecting proxy is to upload the company root CA. |
Save with Save proxy settings, then use Test proxy to confirm the gateway can reach the internet through it.
Notifications (SMTP)
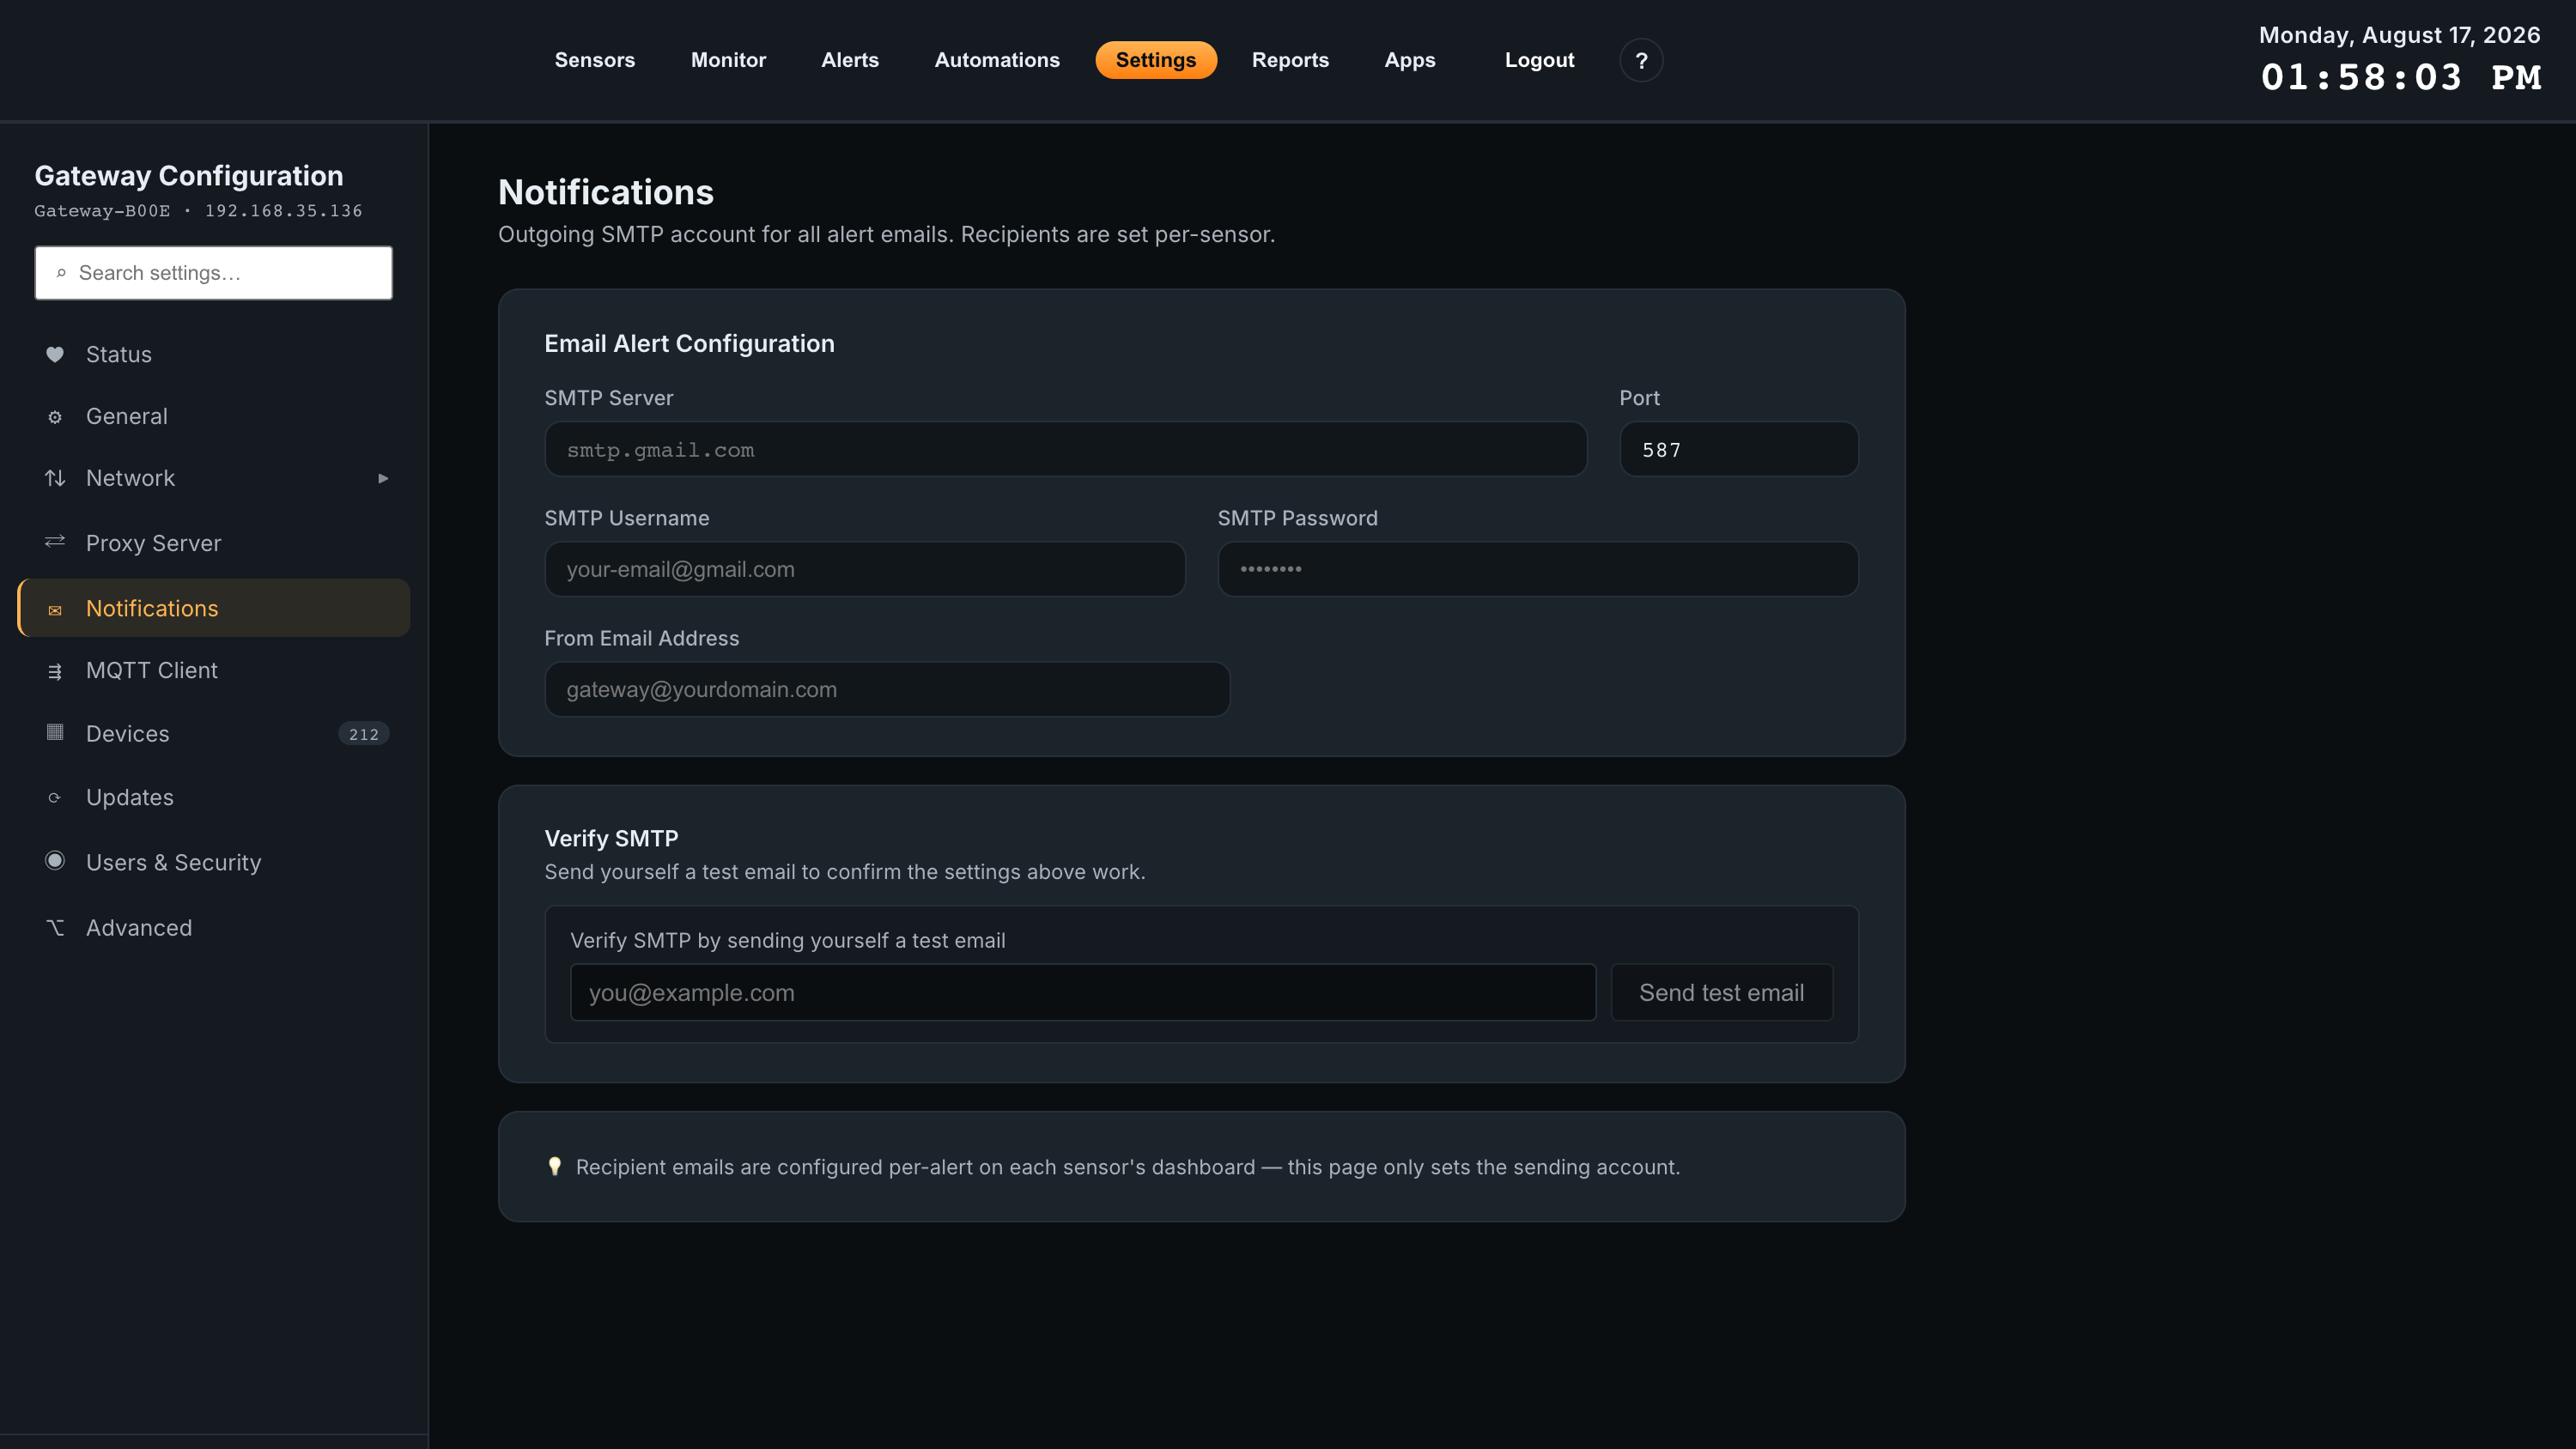
The outgoing mail server used for alert emails and scheduled reports.
| Field | What it does |
|---|---|
| SMTP Server | Your email provider’s SMTP host. |
| SMTP Port | Typically 587 for TLS. |
| SMTP Username / Password | Login credentials for the mail server. |
| From Email Address | The sender address on outgoing mail. |
This page only sets the sending account. Recipients are configured per-alert on each sensor’s dashboard, and per-report on the Reports page. Use Verify SMTP to send yourself a test email and confirm the settings work before relying on alerts.
MQTT Client
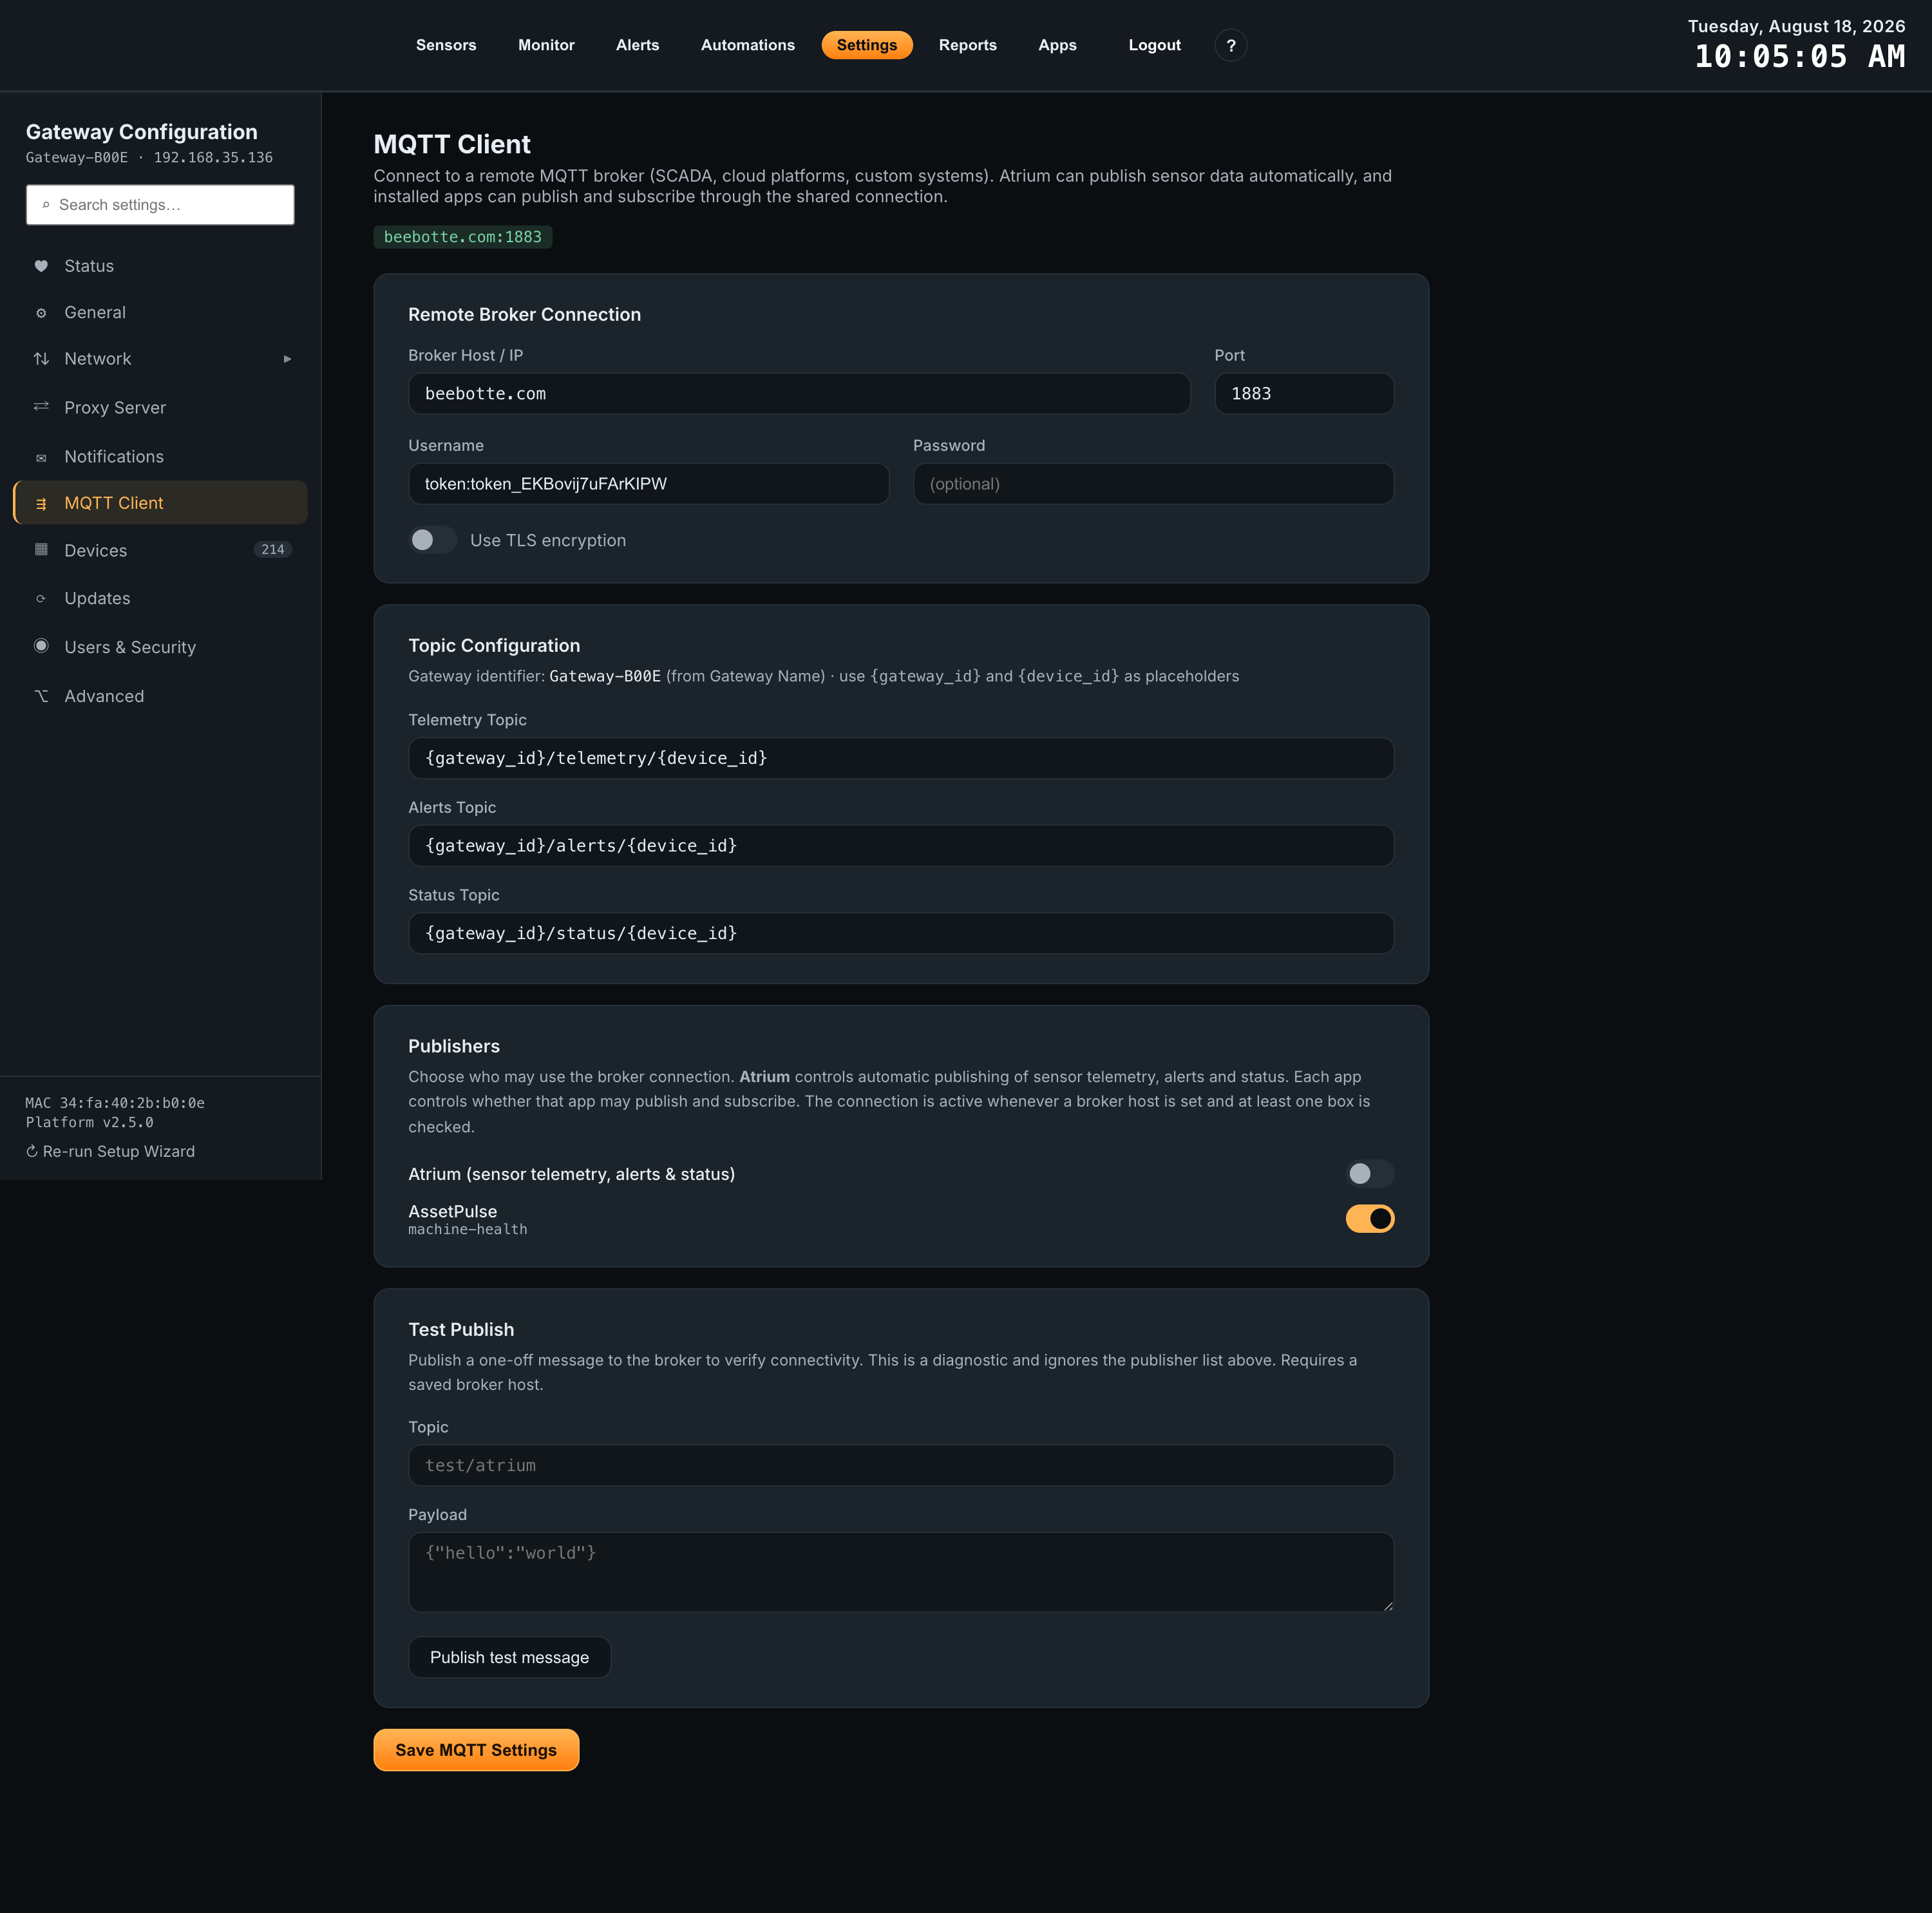
Connects the gateway to a remote MQTT broker for SCADA systems, cloud platforms, or your own pipelines. There is one shared broker connection: Atrium can publish sensor data automatically, and installed apps can publish and subscribe through the same connection.
Broker connection
| Field | What it does |
|---|---|
| Broker Host / IP | Hostname or address of the broker. |
| Port | 1883 by default, or 8883 for TLS. |
| Username / Password | Broker authentication, if required. |
| Use TLS encryption | Encrypts the broker connection and reveals the certificate options below. |
Save MQTT Settings re-establishes the connection immediately.
TLS certificates
- Verify broker certificate — on by default. Uncheck only for a broker with a self-signed certificate and no CA to upload; this accepts any certificate and is not recommended in production.
- CA certificate (PEM) — the authority that issued the broker’s certificate. Combined with the built-in public authorities, so public brokers keep working.
- Client certificate (mTLS) — for brokers requiring mutual TLS. Upload the client certificate and private key, plus the key passphrase if the key is encrypted.
Uploaded private keys and passphrases are encrypted at rest on the gateway.
Topics
Topic patterns use {gateway_id} (the Gateway Name) and
{device_id} (the sensor’s device ID) as placeholders.
| Topic | Default pattern |
|---|---|
| Telemetry | {gateway_id}/telemetry/{device_id} |
| Alerts | {gateway_id}/alerts/{device_id} |
| Status | {gateway_id}/status/{device_id} |
Publishers
The Publishers list controls who may use the connection. Check Atrium to publish every telemetry reading, alert, and status change automatically to the topics above; leave it unchecked if you only want apps to use the broker rather than a constant stream of sensor data. Each installed app that uses MQTT appears as its own row, so you can let AssetPulse publish machine-health results while Atrium’s automatic publishing stays off.
The connection comes up whenever a broker host is saved and at least one publisher is checked. Publishing changes take effect immediately; a newly granted app picks up its subscriptions after the next gateway service restart.
Test Publish
Enter a topic and payload and click Publish test message to send a single message directly to the broker, regardless of the Publishers settings. It is the quickest way to confirm host, port, and credentials. A broker host must be saved first.
Devices
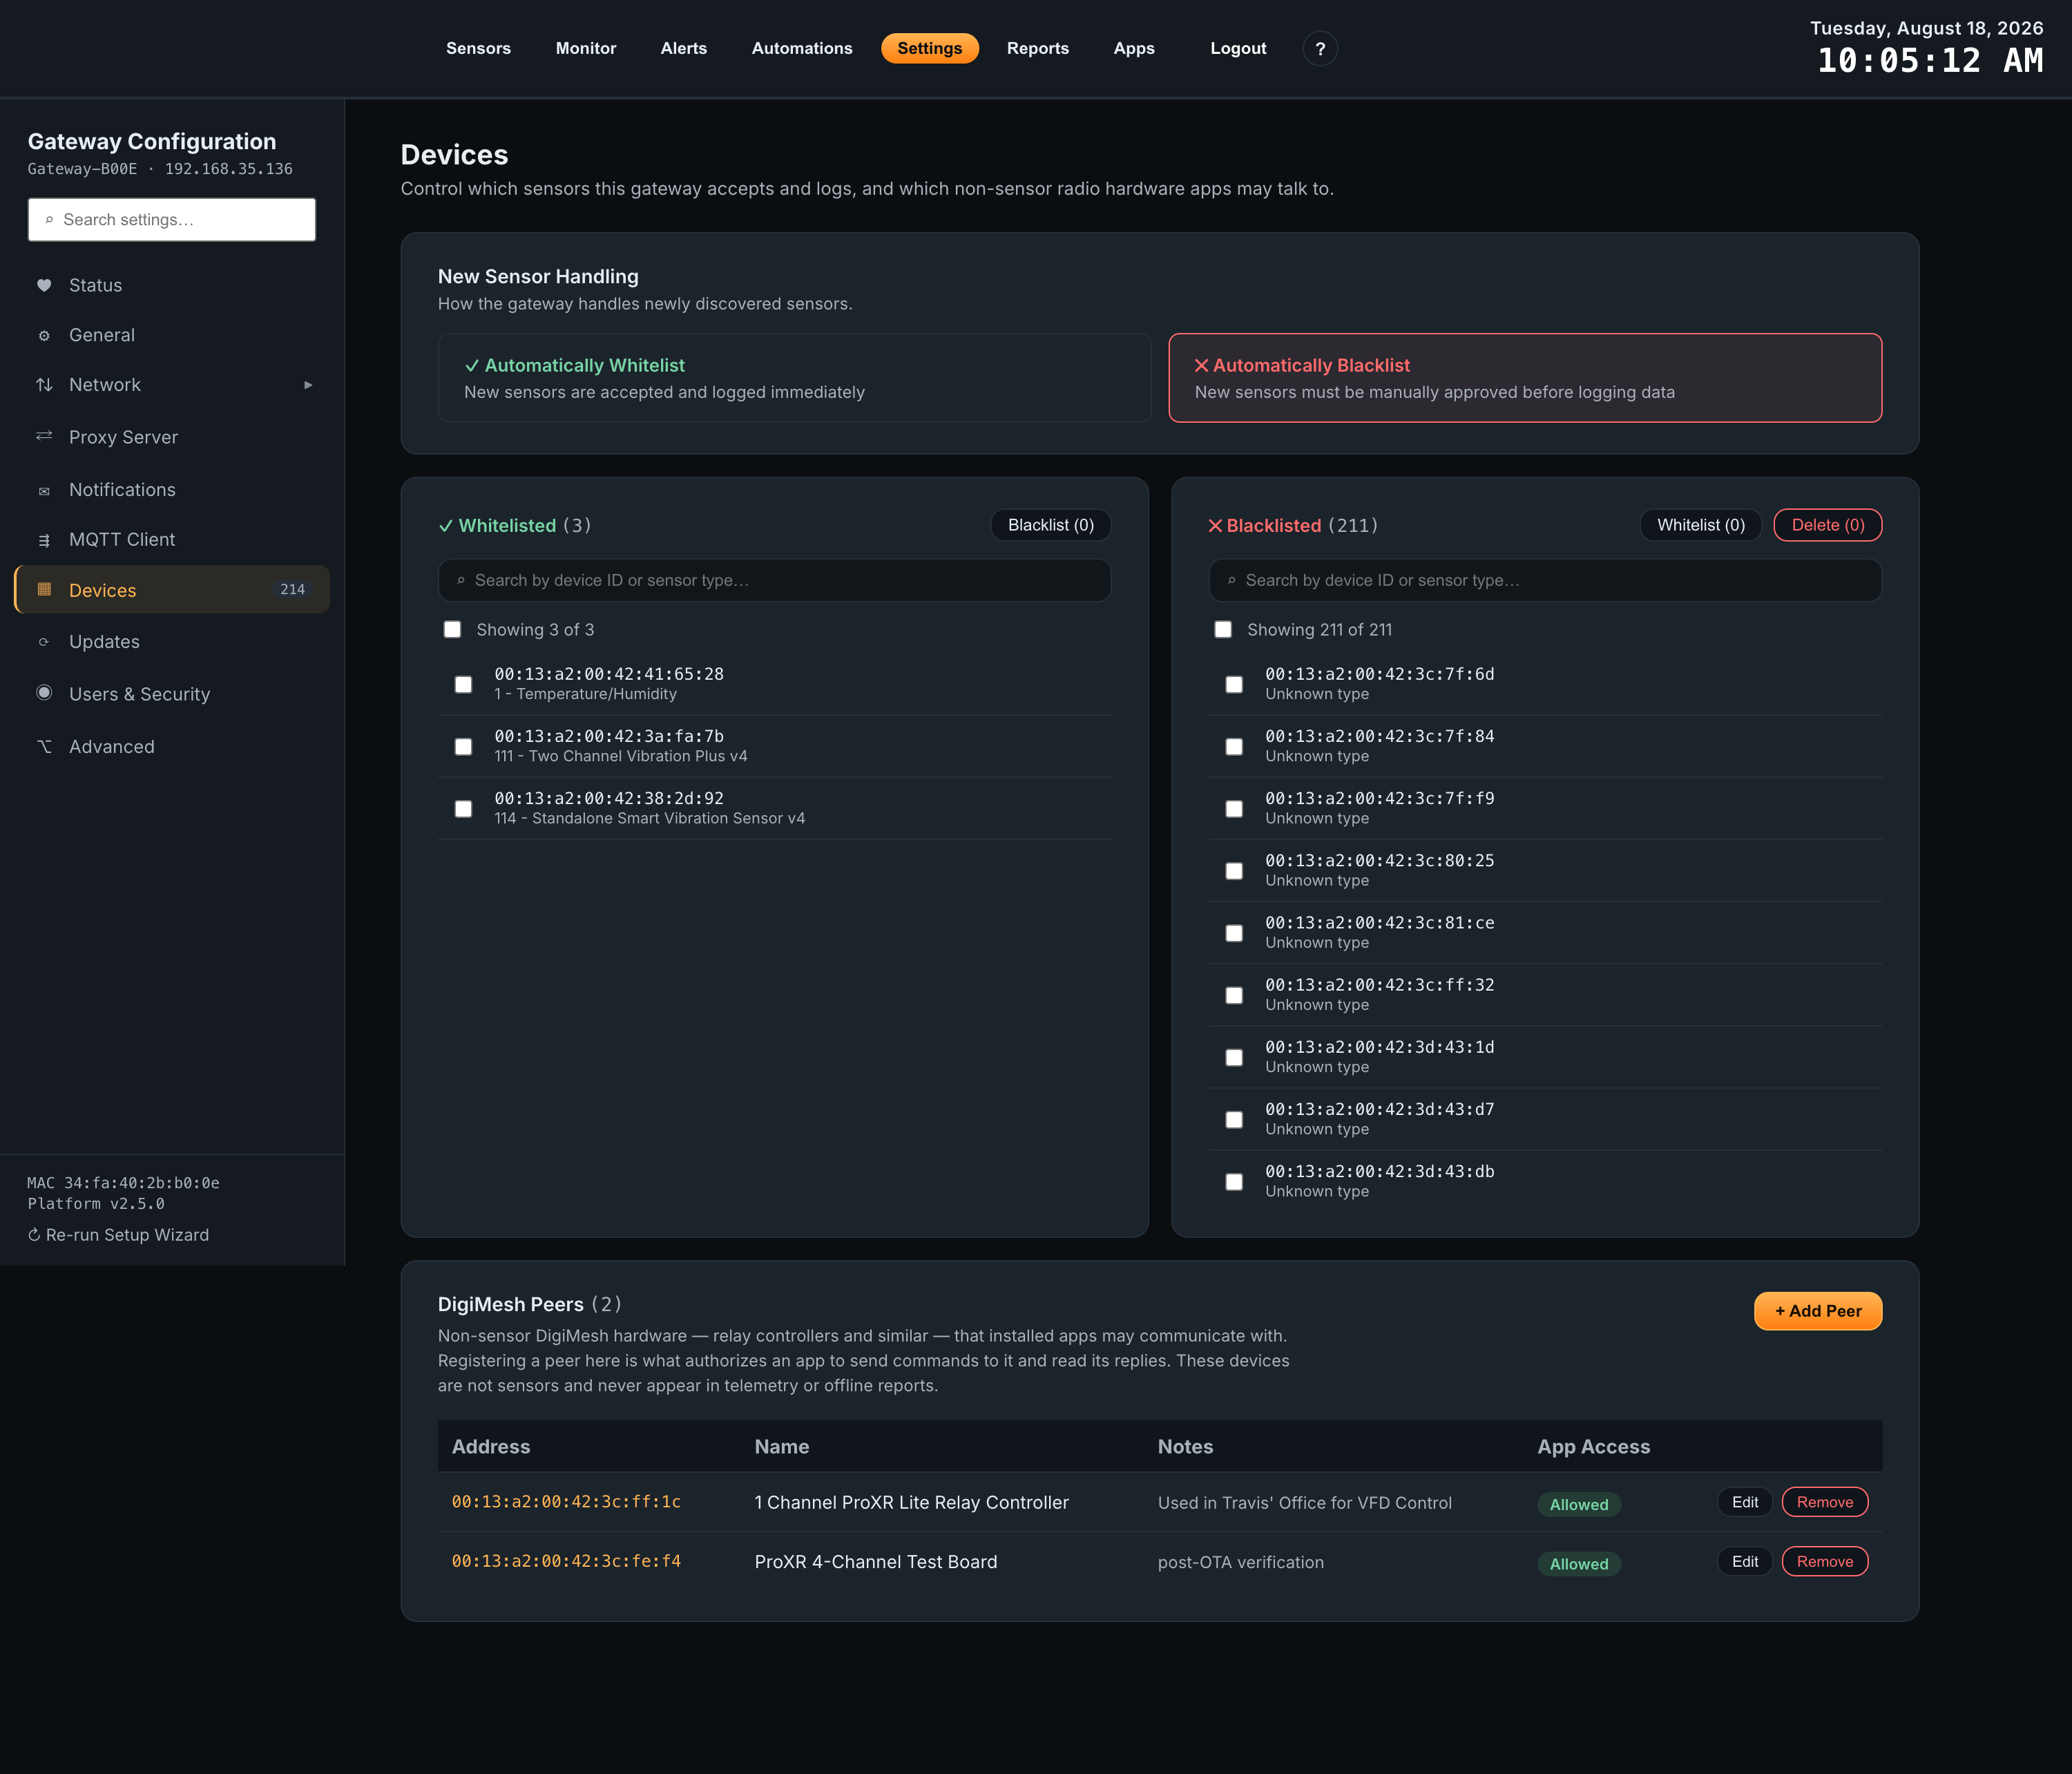
Controls what happens when the gateway hears from a sensor it does not know, and lets you manage the devices it has already seen. The sidebar shows the current device count.
- Automatically Whitelist — new sensors are accepted and their data logged immediately.
- Automatically Blacklist — new sensors must be approved manually before anything is recorded.
Whitelist and blacklist panels list the devices in each state, with bulk actions for moving or deleting them.
DigiMesh Peers
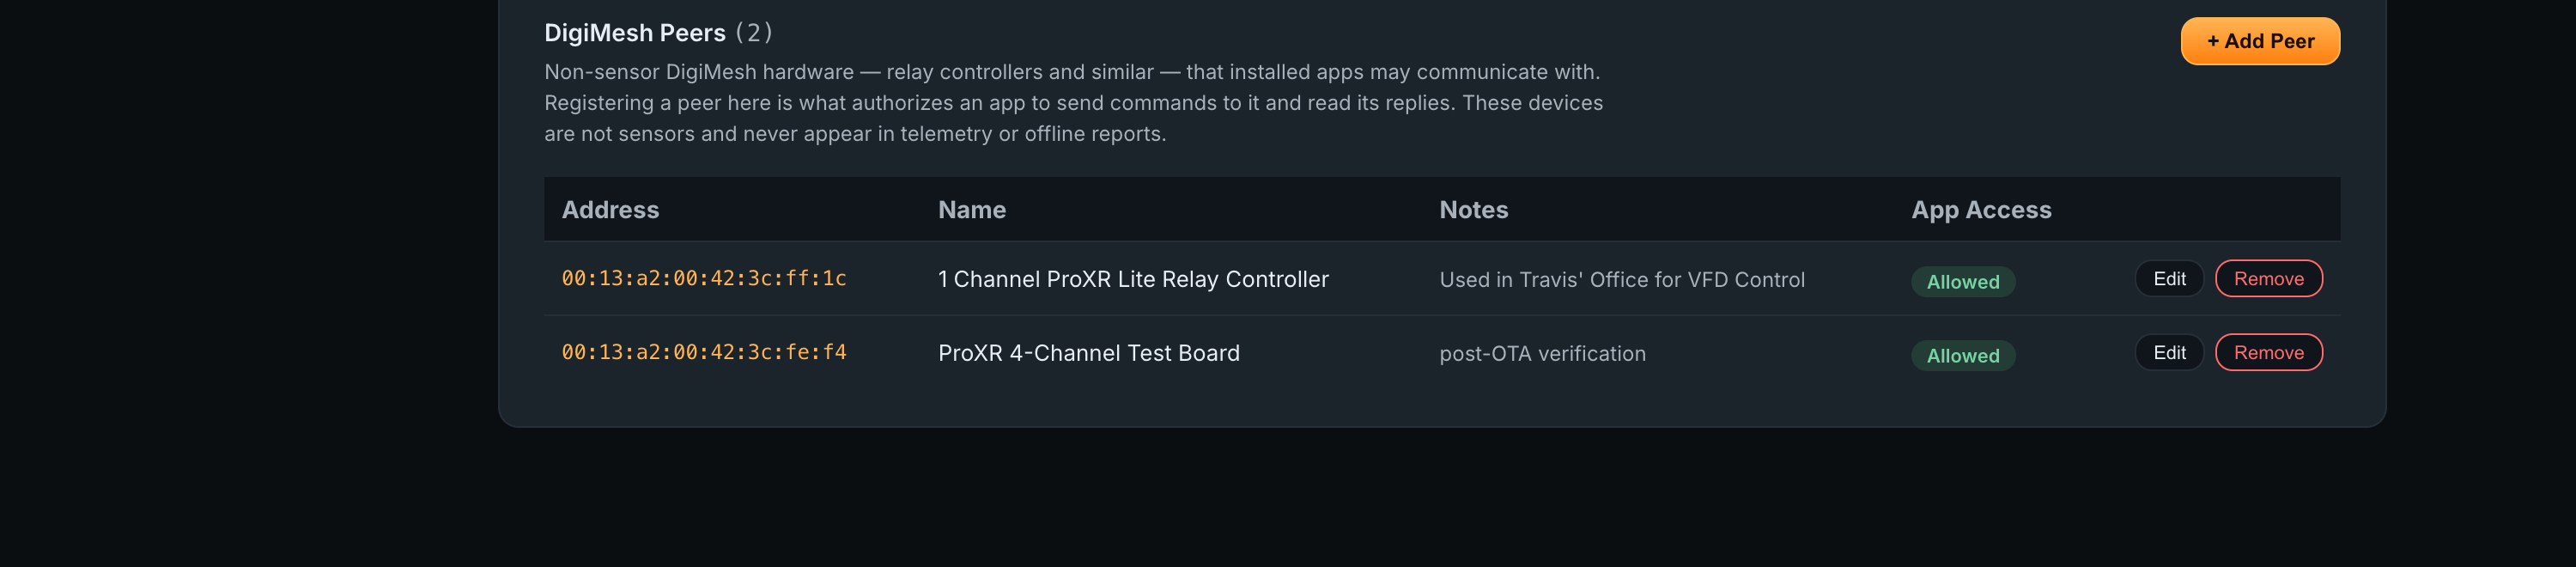
At the bottom of the Devices panel, DigiMesh Peers lists non-sensor DigiMesh hardware — relay controllers and similar — that installed apps may talk to. Registering a peer here is what authorizes an app to send it commands and read its replies.
These are not sensors. They never appear in telemetry or offline reports, so a relay board will not show up as a missing sensor.
| Column | What it shows |
|---|---|
| Address | The peer’s DigiMesh address. |
| Name | A label for the hardware, for example 1 Channel ProXR Lite Relay Controller. |
| Notes | Free text — useful for recording where the device is installed and what it drives. |
| App Access | Whether apps are allowed to communicate with this peer. |
Use + Add Peer to register one, and Edit or Remove to change or revoke it. Removing a peer withdraws app access to that device.
Updates
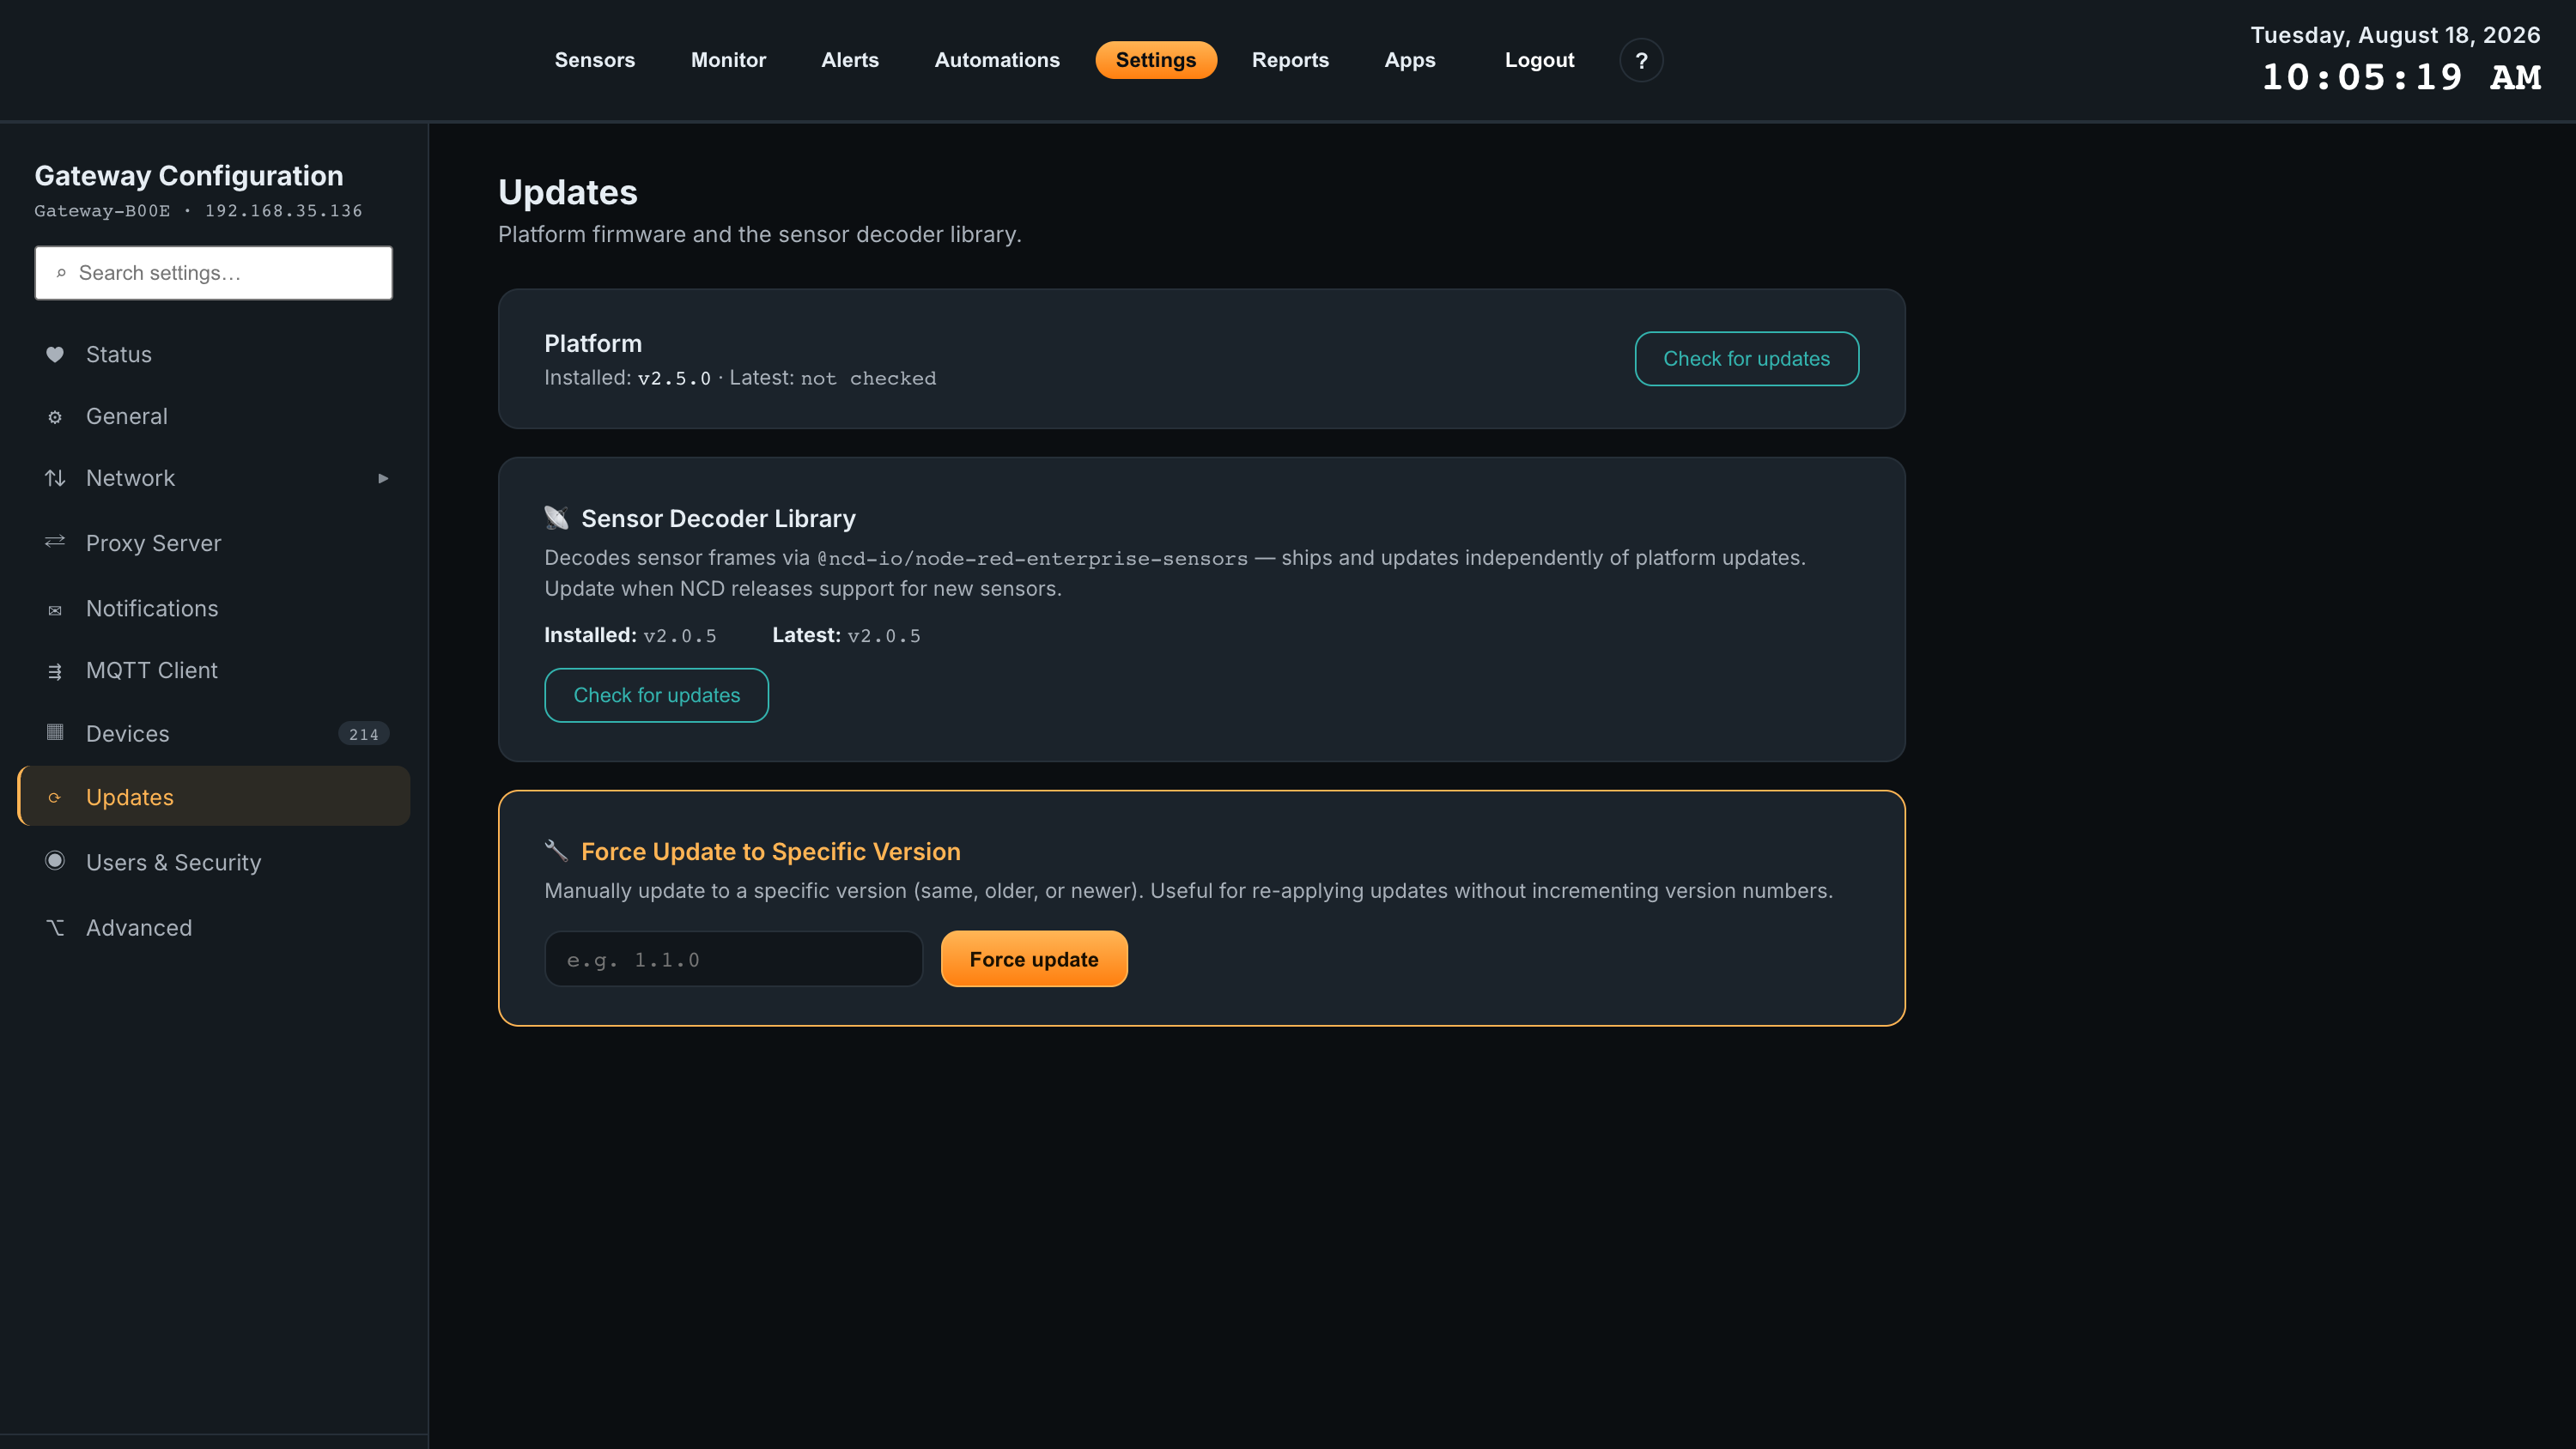
When a newer version of Atrium is available a banner appears with the new version number and its changelog. Click Update Now to download and install it; a progress modal tracks each step. The gateway restarts and you will need to log in again, typically after two to three minutes.
Force Update to Specific Version installs any version you name — the same one again, an older one, or a newer one. Use it to re-apply an update or to roll back.
Sensor Decoder Library
This panel updates two things independently. Below the platform is the Sensor Decoder Library, the component that decodes incoming sensor frames. It ships and updates separately from platform updates, with its own installed and latest version and its own Check for updates button.
Update it when NCD releases support for new sensors. A gateway on the current platform version can still be running an older decoder library — which is why a brand-new sensor type may not be recognised until you update here.
Users & Security
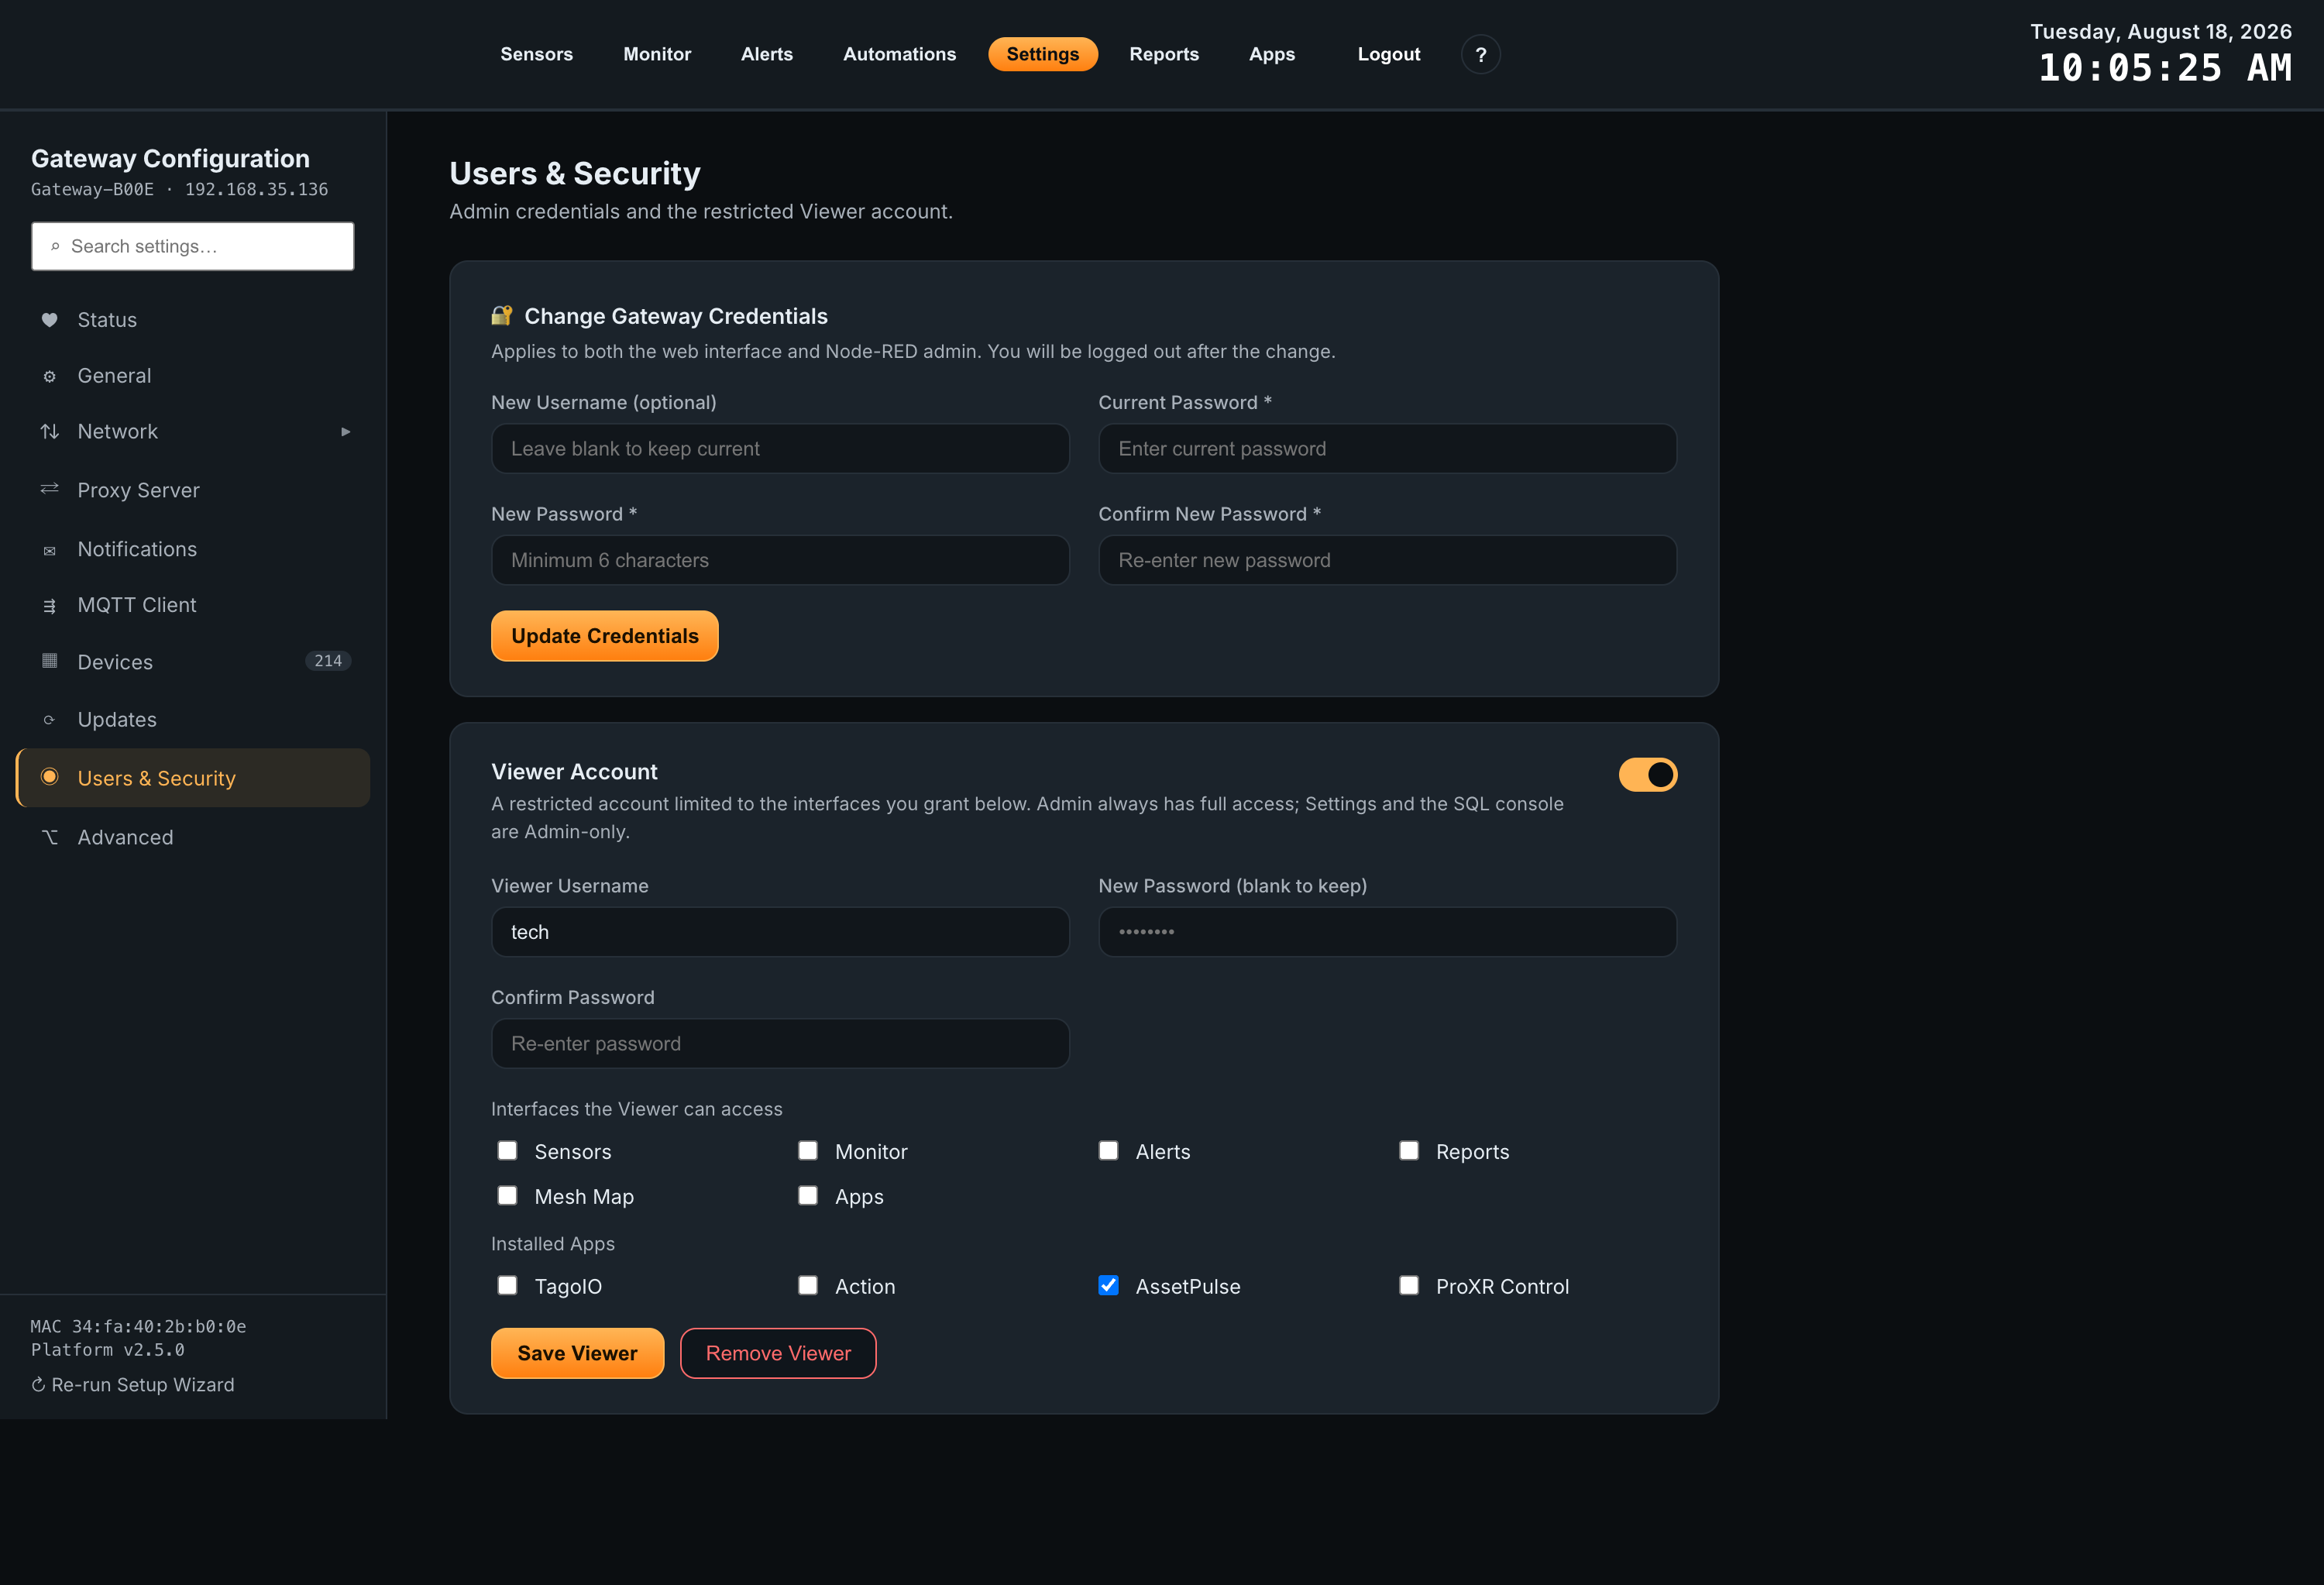
Change Gateway Credentials sets the username and password used to sign in to the Atrium dashboard. Enter the current password, then the new username (optional) and new password (minimum six characters). You are logged out after the change and sign back in with the new credentials.
Alongside the admin account, the gateway supports one optional Viewer account — a restricted login limited to the interfaces you grant it. Enable it with the toggle, set a username and password, then tick what it may reach: Sensors, Monitor, Alerts, Reports, Mesh Map, and Apps, plus each installed app individually. So a Viewer can be given AssetPulse without TagoIO, for example.
Users & Security expands into three panels. Accounts covers the people who sign in, described above. The other two cover software that talks to the gateway without a login.
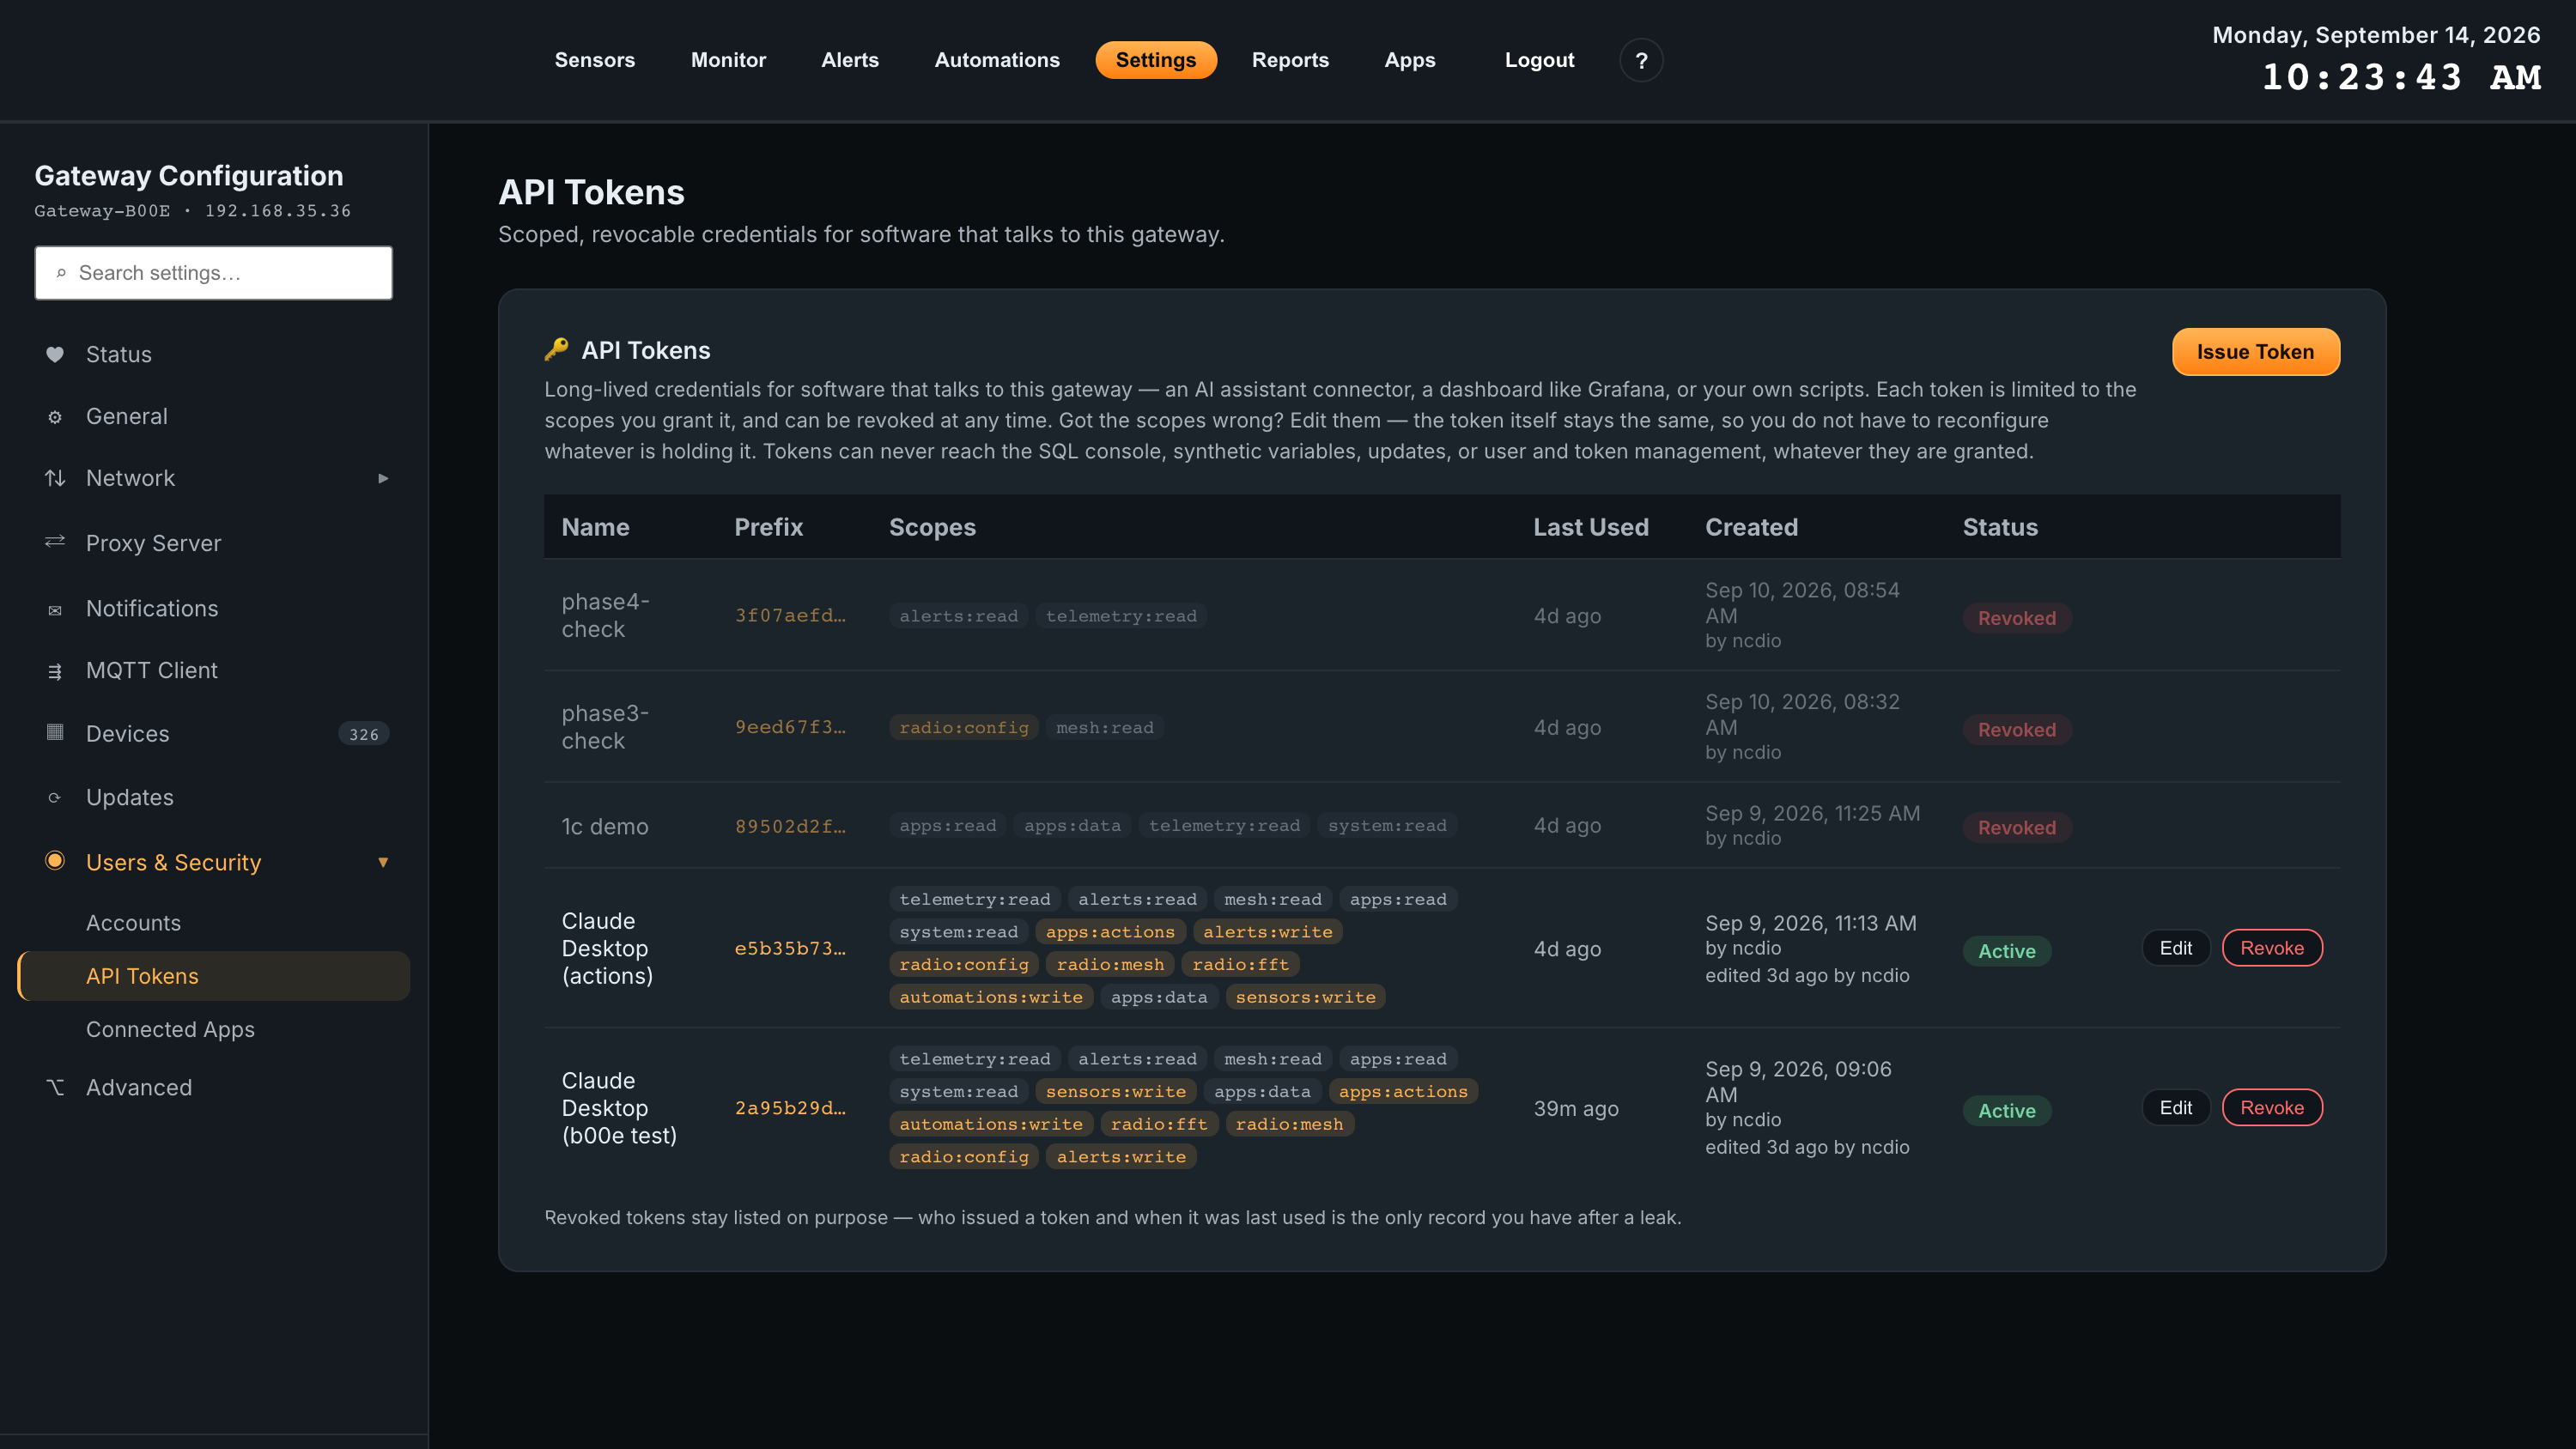
API Tokens
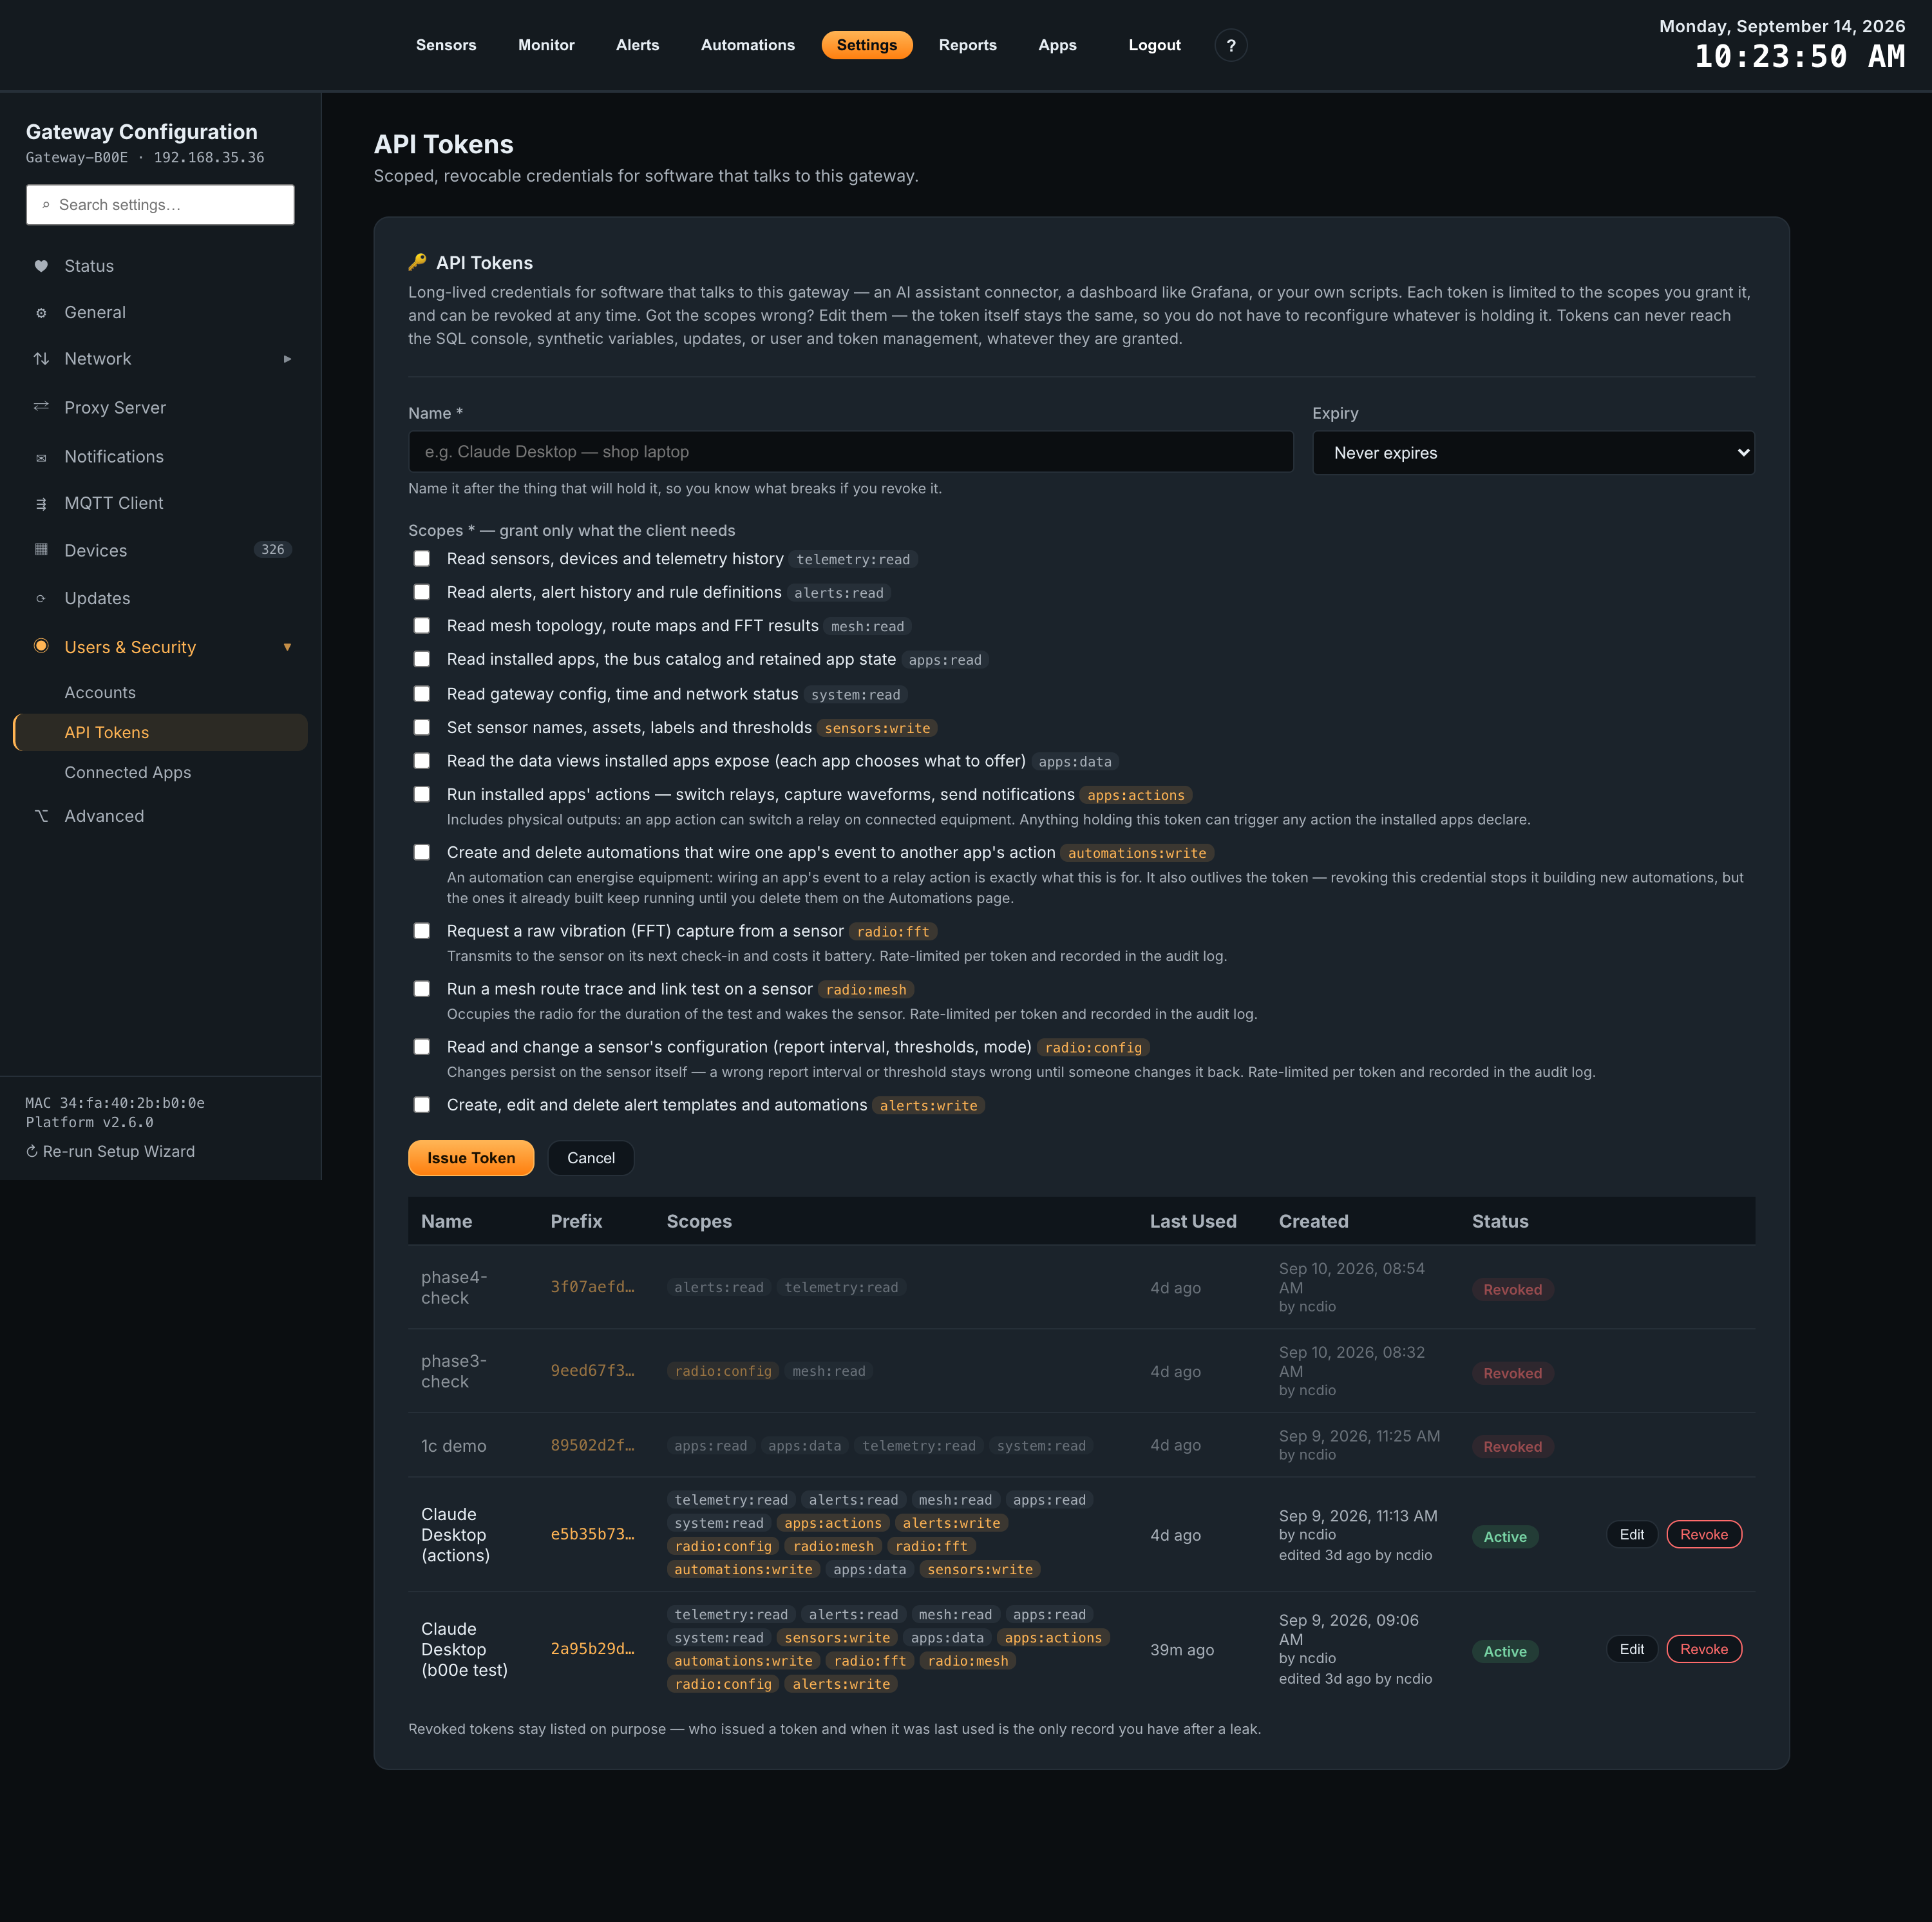
An API token is a long-lived credential for software rather than a person — an AI assistant connector, a dashboard such as Grafana, or your own scripts. Click Issue Token, name it after whatever will hold it, choose an expiry (never, 30 days, 90 days or a year), and tick only the permissions it needs.
The token is displayed once. Copy it then; it cannot be retrieved afterwards. If you grant the wrong permissions, use Edit rather than issuing a replacement — the token value stays the same, so whatever is holding it does not have to be reconfigured. Four things are barred from tokens whatever you grant: the SQL console, synthetic variables, system updates, and user and token management.
Connected Apps
Where an API token is something you issue and paste, a connected app signs itself in through the gateway’s own consent screen using OAuth — the Claude app on a phone or tablet, for example. Each row is one app holding a renewable token limited to the permissions shown. Edit scopes changes what it may do without making it sign in again; Disconnect revokes it immediately.
The OAuth clients card below is for the uncommon case where an app’s setup form asks you for a Client ID and Secret. Most apps register themselves and you never need it.
The panel prints this gateway’s own MCP URL, and is where you approve, re-scope or disconnect an app. Connecting one is covered in AI Assistant Access.
Advanced
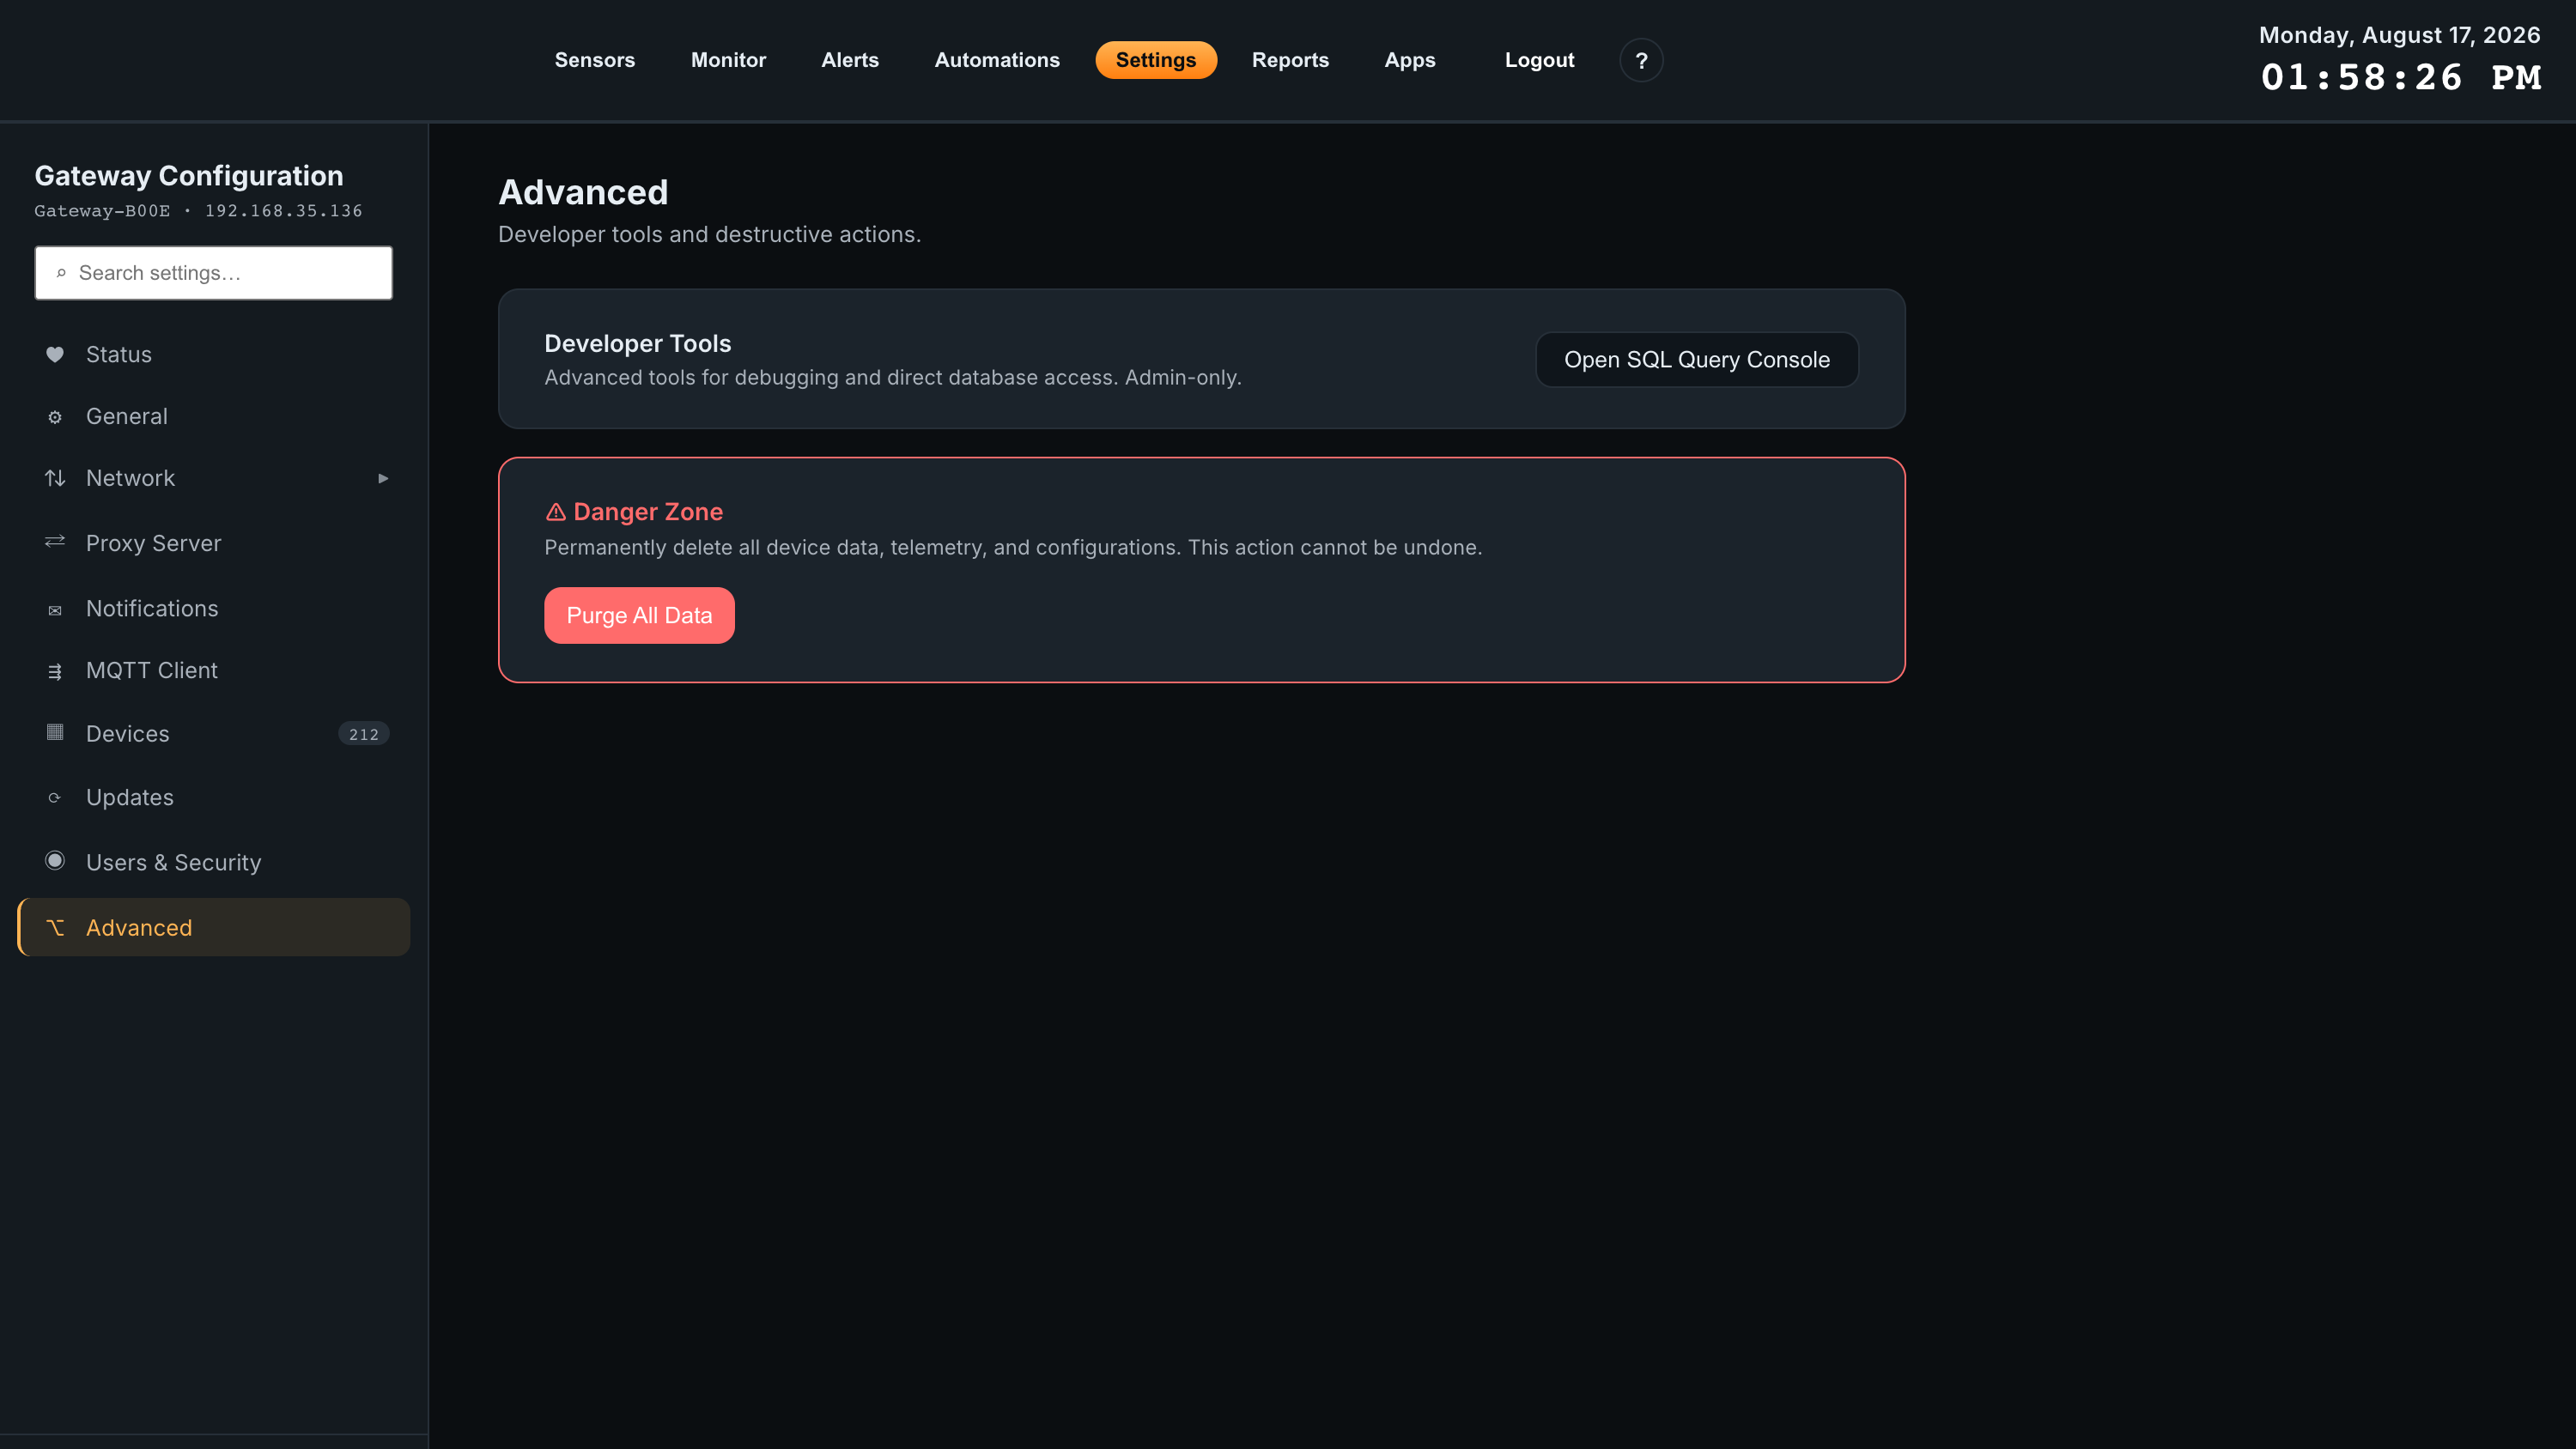
Two tools for people who need to go below the dashboard. The Danger Zone holds Purge All Data, which permanently deletes every device, reading and sensor configuration on the gateway. It cannot be undone and asks for confirmation first.
SQL Query Console
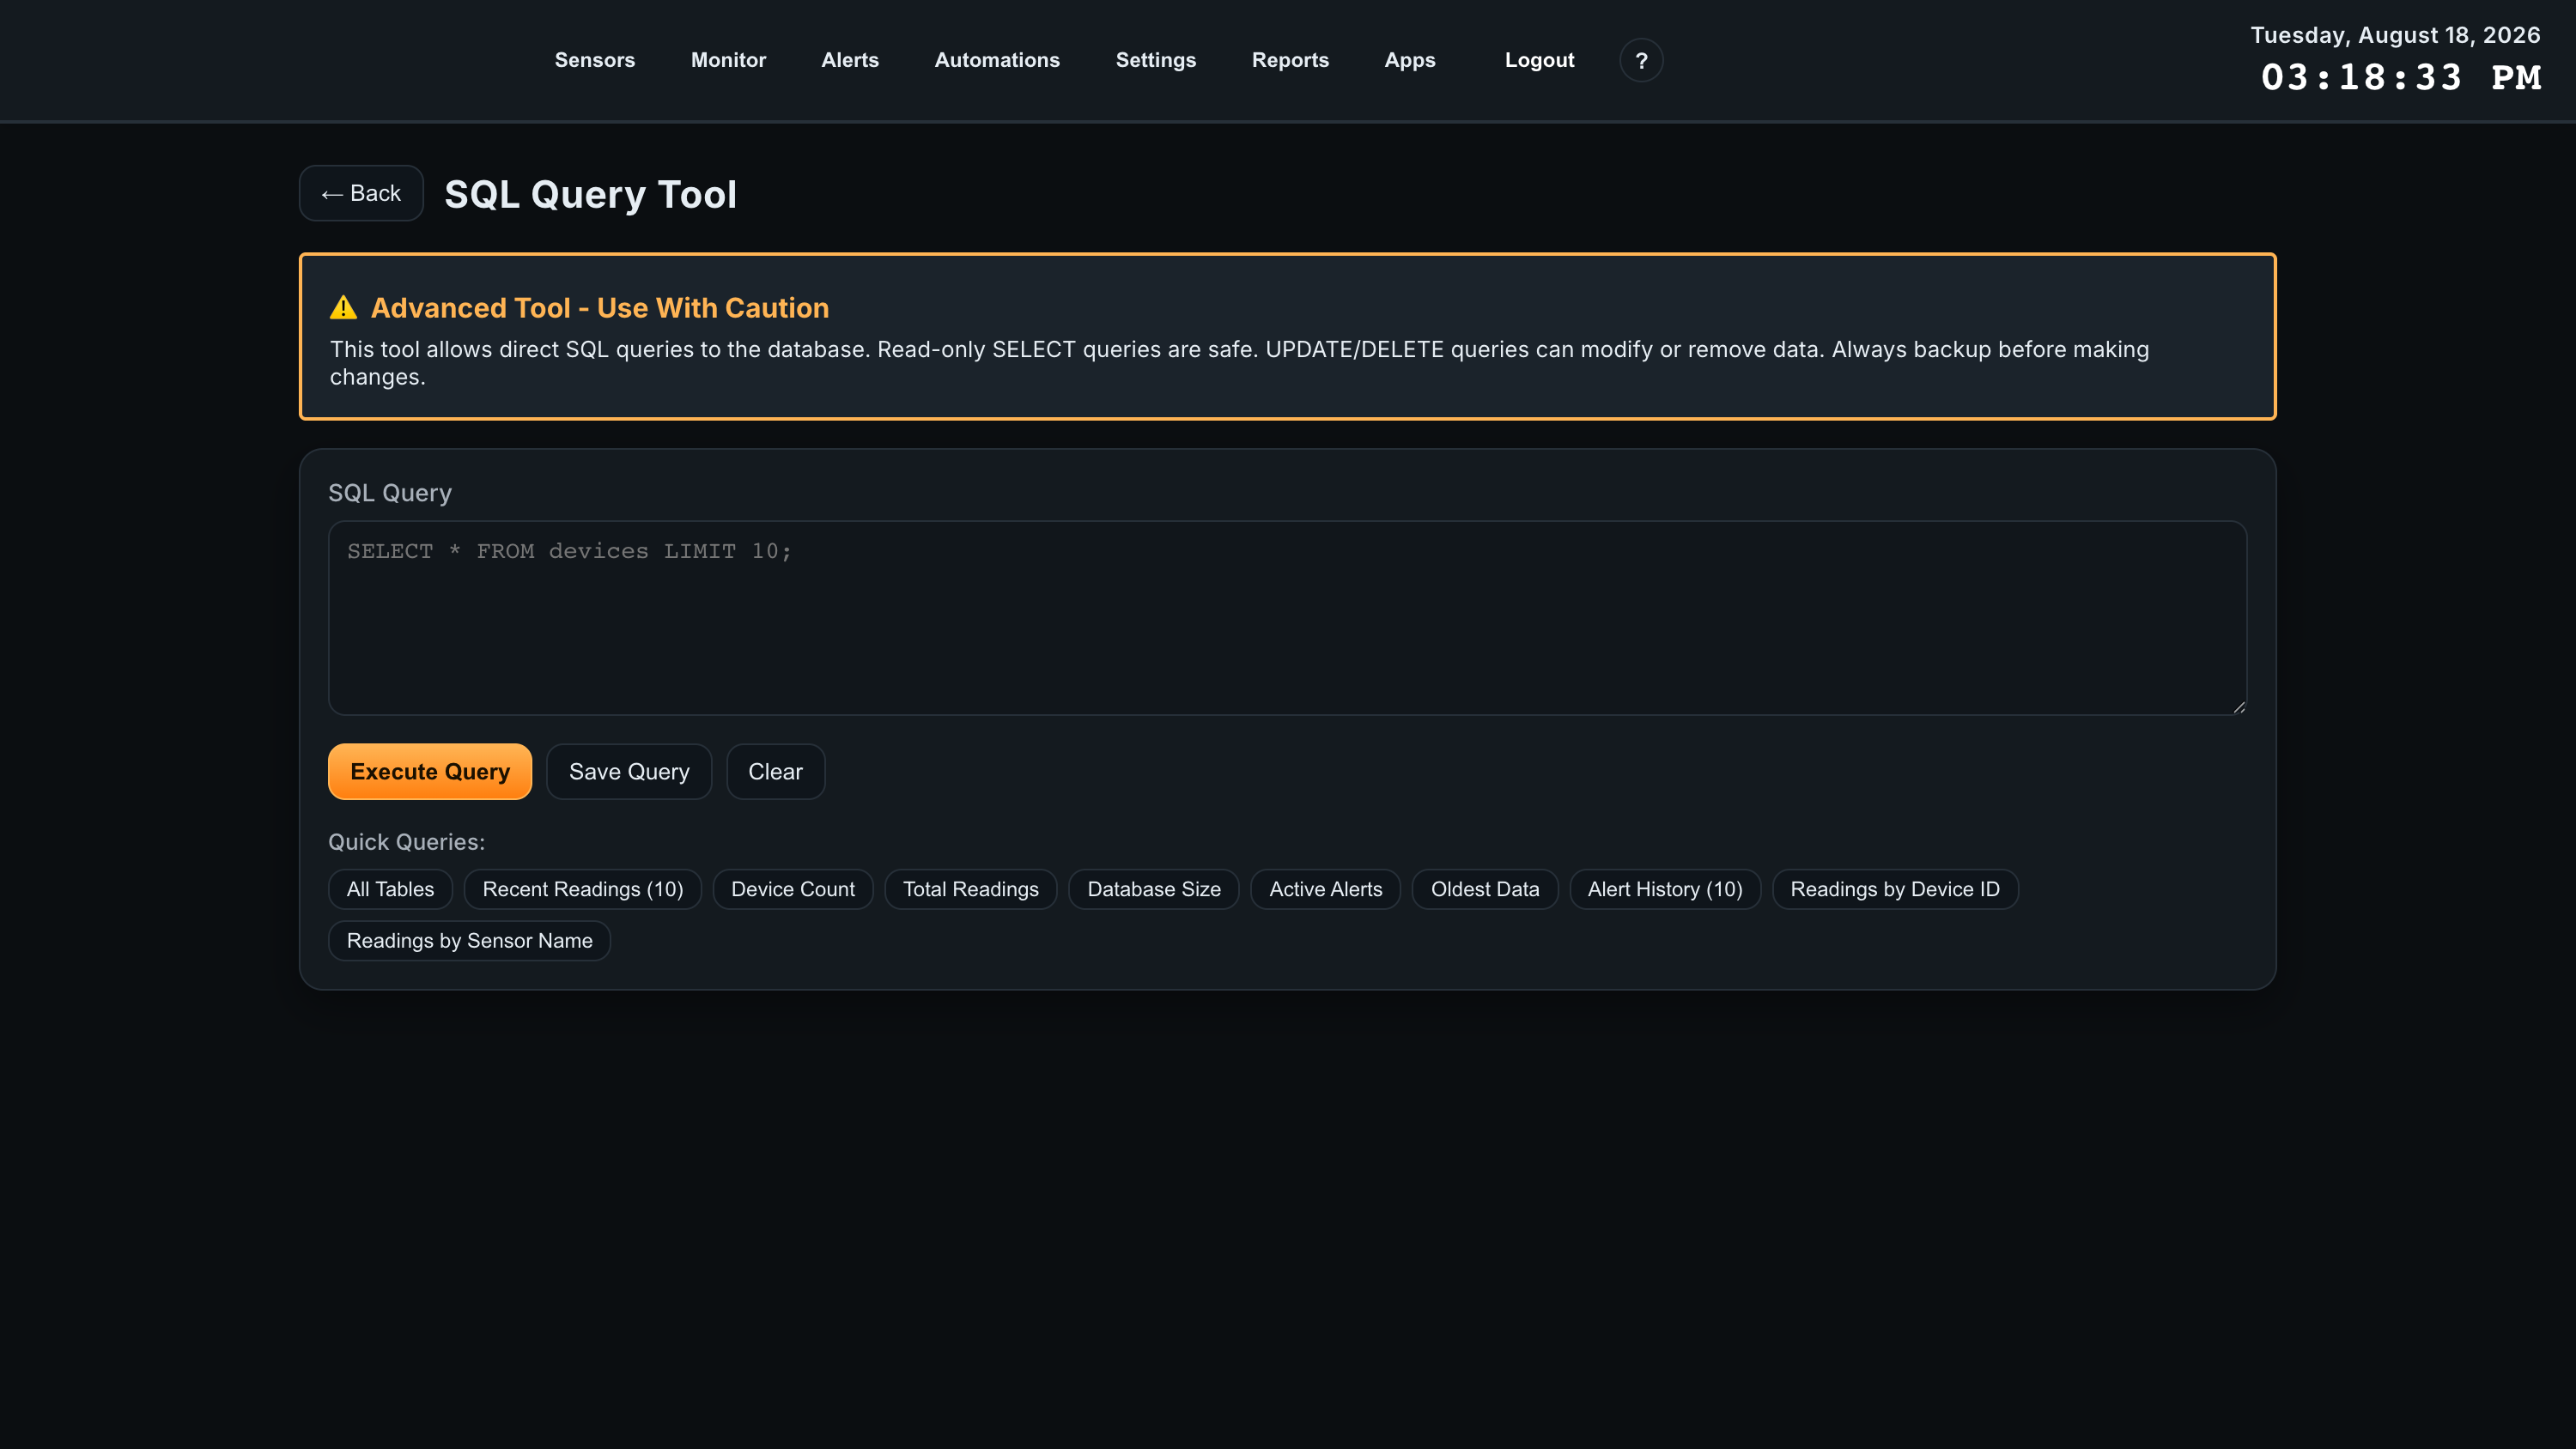
Open SQL Query Console opens the SQL Query Tool, which gives direct access to the gateway’s SQLite database — useful for troubleshooting, ad-hoc reporting, and pulling data the dashboard does not surface. Use ← Back to return to the dashboard.
| Feature | What it does |
|---|---|
| SQL Query | Type any SQL statement, then Execute Query to run it against the live database. Clear empties the editor. |
| Quick Queries | Ready-made queries to start from: All Tables, Recent Readings, Device Count, Total Readings, Database Size, Active Alerts, Oldest Data, Alert History, Readings by Device ID, and Readings by Sensor Name. The last two contain a placeholder to replace with your own device ID or sensor name. |
| Save Query | Save a query you use often under a name, and delete saved ones you no longer need. They persist on the gateway. |
| Export CSV | Once a query has returned rows, export the result set to a CSV file, choosing the filename. |
| Results table | Results are displayed as a scrollable table. Very large result sets are capped at 1,000 rows on screen, with a notice — narrow the query or add a LIMIT to see the rows you want. |
14Troubleshooting
Quick fixes for the most common issues.
| Symptom | What to check |
|---|---|
| Can’t reach Atrium in the browser | Confirm your device is on the same network as the gateway. If the .local hostname won’t resolve, use the LAN IP from your router. Give the gateway 1–2 minutes to finish booting. |
| Device shows Offline (red) | Check sensor power/batteries and range; move it closer or clear obstructions; verify the gateway antenna is connected and upright. Long report intervals can make a device look offline between transmissions. |
| Device shows Warning (amber) | Low battery: replace batteries. Weak signal: reposition sensor/gateway or check the antenna. Sensor error: inspect probe connections and cabling. |
| No new sensors appearing | Confirm sensors are on the same wireless frequency as the gateway. Check the New Sensor Handling setting and the whitelist/blacklist in Settings → Device Management. |
| No email received | Verify SMTP in Settings and use Send Test Email. Confirm a recipient is set on the alert or report, and check spam folders. |
| Can’t log in | Verify credentials. If forgotten, contact your system administrator. Ensure your browser is on the same network as the gateway. |
Factory Reset
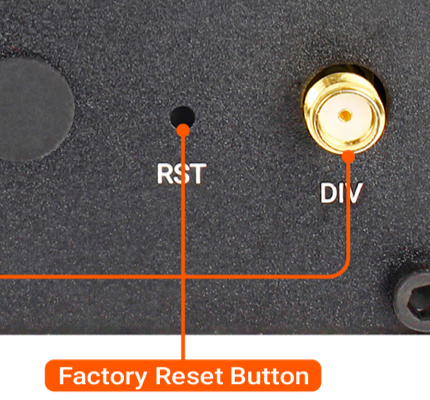
A factory reset restores the gateway’s network settings and Node-RED configuration to their defaults. Use it as a recovery step if the gateway becomes unresponsive or stops booting normally, or when you want to start from a clean configuration.
-
1
Disconnect cablesRemove all Ethernet and USB devices from the gateway.
-
2
Power on the gatewayApply power and wait a few seconds for it to begin booting.
-
3
Press and hold RSTPress and hold the RST (reset) button — shown below — for 5 to 10 seconds.
-
4
Watch the RUN lightThe RUN indicator light will begin to flash rapidly. This confirms the reset has started.
-
5
Release RSTRelease the button. The gateway performs the factory reset and restarts — allow about 2–3 minutes before the interface is reachable again.
15Technical Specifications
At-a-glance hardware and platform details.
| Category | Specification |
|---|---|
| Platform | NCD Enterprise IIoT Gateway (EG5120) |
| Processor | 1.6 GHz quad-core |
| Memory | 2 GB DDR4 |
| Storage | 64 GB flash (local SQL database) |
| Ethernet | Dual ports — ETH0 uplink/client, ETH1 downstream network; customizable firewalls |
| Wi-Fi | 802.11 a/b/g/n/ac, 2.4 GHz & 5 GHz, AP or client mode (WPA/WPA2/AES-CCMP) |
| Cellular | Built-in, automatic SIM detection |
| Sensor radio | Long-range wireless mesh — 900 MHz, 868 MHz, or 2.4 GHz (selectable), up to ~2-mile range |
| Antennas | Frequency-specific XBee dipole, 2 × WiFi (2.4 GHz), 2 × cellular with 1 m cables (all included) |
| Power | 9–60 VDC, 5–20 W (power supply included) |
| Operating system | Debian-based Linux with SSH access |
| Remote management | Cloud fleet management, encrypted VPN and remote access |
| Industrial protocols | Atrium natively: MQTT, HTTP. Via Node-RED or custom code: TCP, AMQP, OPC UA and others |
| Software platform | Atrium — React web app, local API, SQLite database, OTA updates |
| Integrations | AWS, Azure, MongoDB, MySQL, Ubidots, email, custom endpoints; Node-RED pre-installed |
16Advanced Configuration
Everything most users need is in the Atrium dashboard. Underneath it, the EG5120 hardware has its own configuration dashboard for advanced networking and device administration.
Reach it in a browser at http://ncd-xxxx.local:8080, replacing
ncd-xxxx with your gateway’s hostname — the same name you use for the
Atrium dashboard. It signs in with its own credentials, which default to:
| Field | Default |
|---|---|
| Username | ncdio |
| Password | ncdB3ast |